5 Number Summary Boxplots Outliers and Resistance 5

5 Number Summary, Boxplots, Outliers, and Resistance

5 Number Summary on the TI Graphing Calculator

Graph Box and Whisker on the TI Graphing Calculator… • To graph box and whisker … 2 ND Y = 1: PLOT 1…ON ON (should be highlighted if not push ENTER) TYPE: (arrow over 4 times) ENTER GRAPH **If graph does not show up, ZOOM 9: STAT

Resistance • The mean is a non-resistant measurement, which means that extreme values will pull it towards that end of the data. • The median is a resistant measurement. Extreme values have no affect on it. Note- If the mean and median are the same then the dist. is roughly symmetric. Mean smaller-skewed left, mean larger-skewed right

5 Number Summary/Boxplot

Example: Ages of actresses at the time they first won the Oscar 50 44 35 80 26 28 41 21 61 38 49 33 74 30 33 41 31 35 41 42 37 26 34 34 35 26 61 60 34 24 30 37 31 27 39 34 26 25 33

Box Plot We need 5 numbers, called the 5 number summary: 1. minimum value 2. Q 1 (median of 1 st half) 3. median 4. Q 3 (median of 2 nd half) 5. maximum value

Calculate the 5 number summary for actresses data • • • Min = 21 Q 1 = 30 Med = 34 Q 3 = 41 Max = 80 Construct a boxplot for the 5 number summary

Distribution Shape Based Upon Boxplot 1. If the median is near the center of the box and each of the horizontal lines (“whiskers”) are approximately equal length, then the distribution is roughly symmetric. 2. If the median is left of the center of the box and/or the right “whisker” is substantially longer than the left line, the distribution is right skewed. 3. If the median is right of the center of the box and/or the left line is substantially longer than the right line, the distribution is left skewed.

Symmetric

Skewed Right

Skewed Left

In a set of numbers, a number that is much LARGER or much SMALLER than the rest of the numbers is called an Outlier.

Criteria for Outliers Remember that an outlier is a data value that lies very far away from the majority of all the other data values in the data set. The following is criteria to identify outliers in a data set. • The inter-quartile range (IQR) is the value of Q 3 – Q 1 x is an outlier if of one the following inequalities is true: 1. x > Q 3 + 1. 5 x IQR 2. x < Q 1 - 1. 5 x IQR Does our data have any outliers?
 • When we select the 1 st box")
Box plot with outliers (Modified Boxplot) • When we select the 1 st box plot on the TI, it allows us to see outliers. Select the mark that is visible for you.
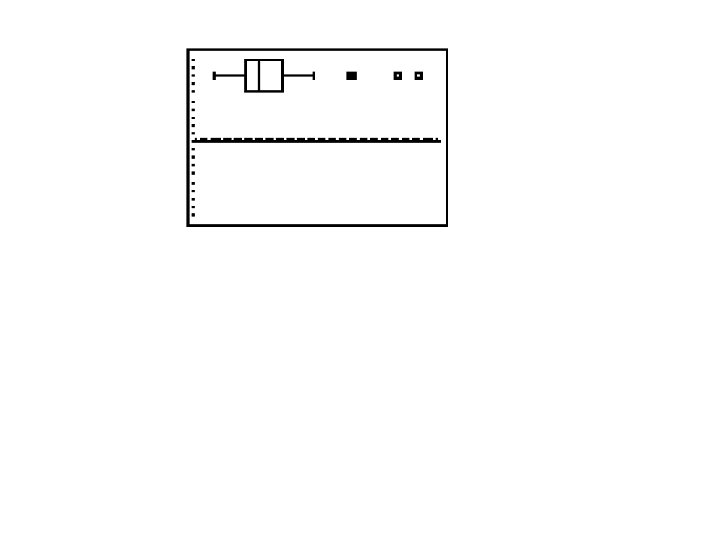

• Trace and go to the right twice. • The 50 is the last data value that is not an outlier.
- Slides: 17