5 Basic Principles of Echocardiography Rasoul Azarfarin MD

5

Basic Principles of Echocardiography Rasoul Azarfarin MD Professor of Anesthesiology Fellowship of Cardiac Anesthesia

Practice Guidelines for Transesophageal Echocardiography • Based on the information available today, we anticipate a recommendation that TEE be used in all patients undergoing cardiac or thoracic aortic surgery and in other surgical patients and in patients with unexplained life -threatening circulatory instability • unless contraindicated by esophageal pathologic abnormalities.

Non-cardiac surgery: • “TEE may be used when the nature of the planned surgery or the patient’s known or suspected cardiovascular pathology might result in severe hemodynamic, pulmonary, or neurologic compromise. • If equipment and expertise are available, TEE should be used when unexplained life -threatening circulatory instability persists despite corrective therapy. ”

TEE in Critical care patients: • “TEE should be used when diagnostic information that is expected to alter management cannot be obtained by transthoracic echocardiography or other modalities in a timely manner”

Properties of Ultrasound

Illustration of an array of piezoelectric crystals contained within an ultrasound transducer

Echocardiography Basics Ultrasound waves sent from chest wall

Table 41 -2 -- Relationship Among Frequency, Wavelength, and Depth of Penetration (The higher the ultrasound transducer frequency, the better the image quality, but the more limited the depth of penetration. )
 Continuous")
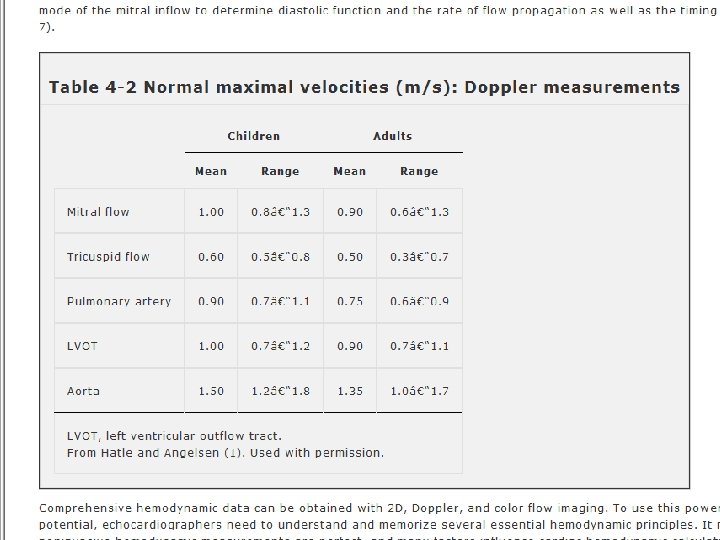
Contents: 1. 2 D Echocardiography TTE windows and views 2. Doppler Echocardiography a) Continuous Doppler b) Pulsed Doppler -Blood velocity Doppler -Color Doppler -Tissue Doppler (Spectral, Strain rate Speckle tracking) 3. Normal Echo Findings a) Cardiac Valves (sizes & velocity) b) Left Ventricle (sizes & functions)

The Modalities of Echo The following modalities of echo are used clinically: 1. Conventional echo Two-Dimensional echo (2 -D echo) Motion- mode echo (M-mode echo) 2. Doppler Echo Continuous wave (CW) Doppler Pulsed wave (PW) Doppler Colour flow(CF) Doppler Tissue Doppler All modalities follow the same principle of ultrasound Differ in how reflected sound waves are collected analysed

M-Mode echocardiography An M- mode echocardiogram is not a "picture" of the heart, but rather a diagram that shows how the positions of its structures change during the course of the cardiac cycle. M-mode recordings permit measurement of cardiac dimensions and motion patterns. Also facilitate analysis of time relationships with other physiological variables such as ECG, and heart sounds.
")
Echocardiography Basics One-dimensional imaging (M-mode)
 This technique is used to \"see\" the actual structures")
Two-Dimensional Echo (2 -D echo) This technique is used to "see" the actual structures and motion of the heart structures at work. Ultrasound is transmitted along several scan lines(90 -120), over a wide arc(about 900) and many times per second. The combination of reflected ultrasound signals builds up an image on the display screen. A 2 -D echo view appears cone-shaped on the monitor.

Doppler echocardiography
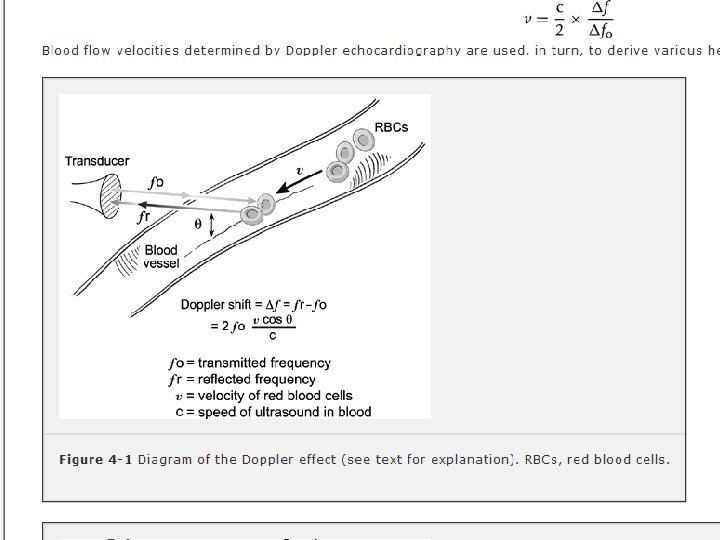

Doppler echocardiography

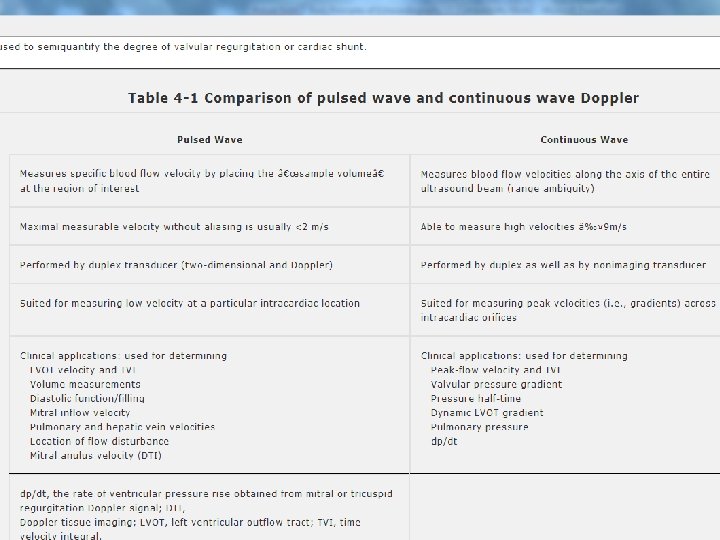
Doppler echocardiography is a method for detecting the direction and velocity of moving blood within the heart. Pulsed Wave (PW) useful for low velocity flow e. g. MV flow Continuous Wave (CW) useful for high velocity flow e. g aortic stenosis Color Flow (CF) Different colors are used to designate the direction of blood flow. red is flow toward, and blue is flow away from the transducer with turbulent flow shown as a mosaic pattern.
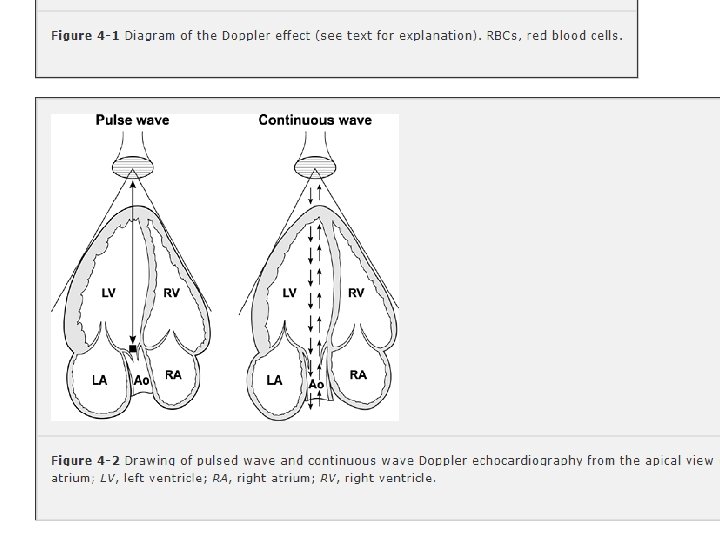

Doppler Technique Advantages Disadvantages Pulsed wave Measures blood flow Cannot measure fast blood velocities at selected areas of flow velocities (>1 m/sec) interest 3 -5 mm wide along because of aliasing the ultrasound scan line Continuous wave To measure blood flow Detects blood flow velocities Cannot identify location of the velocities through the aorta, aortic valve, stenotic valve up to 7 m/sec (not subject to peak velocity along the Nyquist limit) ultrasound scan line lesions, and regurgitant valvular jets Color flow Presents the spatial relationships between structure and blood flow Like pulsed wave Doppler, cannot measure fast blood flow velocities because of aliasing Clinical Uses To measure blood flow velocities through the pulmonary veins and mitral valve and in low-flow areas within the heart To enhance recognition of valvular abnormalities, aortic dissections, and intracardiac shunts

Echocardiography Basics Doppler – Spectral Pulse Continuous Bernoulli equation P = 4 V 2

Doppler – Color
 and turbulent (L) color Doppler")
Normal (R) and turbulent (L) color Doppler

Echocardiography Basics Tissue velocity imaging

3 D Echo
 image")
A schematic of a gated acquisition of a fullvolume three-dimensional (3 -D) image
, or")
Transthoracic Echo A standard echocardiogram is also known as a transthoracic echocardiogram (TTE), or cardiac ultrasound. The subject is asked to lie in the semi recumbent position on his or her left side with the head elevated. The left arm is tucked under the head and the right arm lies along the right side of the body Standard positions on the chest wall are used for placement of the transducer called “echo windows”

Echo windows and views
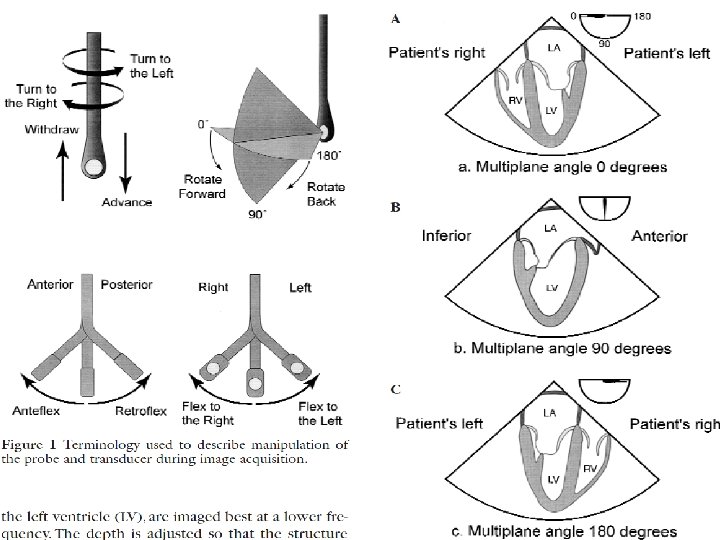

Cross-Sectional TEE Views
 Transducer position: left sternal edge; 2 nd – 4 th")
Parasternal Long-Axis View (PLAX) Transducer position: left sternal edge; 2 nd – 4 th intercostal space Marker dot direction: points towards right shoulder Most echo studies begin with this view It sets the stage for subsequent echo views Many structures seen from this view
 Transducer position: left sternal edge; 2 nd – 4")
Parasternal Short Axis View (PSAX) Transducer position: left sternal edge; 2 nd – 4 th intercostal space Marker dot direction: points towards left shoulder(900 clockwise from PLAX view) By tilting transducer on an axis between the left hip and left shoulder, short axis views are obtained at different levels, from the aorta to the LV apex. Many structures seen
level PSAX at the level of the papillary muscles showing how the")
Papillary Muscle (PM)level PSAX at the level of the papillary muscles showing how the respective LV segments are identified, usually for the purposes of describing abnormal LV wall motion LV wall thickness can also be assessed
 Transducer position: apex of heart Marker dot")
Apical 4 -Chamber View (AP 4 CH) Transducer position: apex of heart Marker dot direction: points towards left shoulder The AP 5 CH view is obtained from this view by slight anterior angulation of the transducer towards the chest wall. The LVOT can then be visualised
 Transducer position: apex of the heart Marker")
Apical 2 -Chamber View (AP 2 CH) Transducer position: apex of the heart Marker dot direction: points towards left side of neck (450 anticlockwise from AP 4 CH view) Good for assessment of LV anterior wall LV inferior wall
 Transducer position: under the xiphisternum Marker dot position:")
Sub–Costal 4 Chamber View(SC 4 CH) Transducer position: under the xiphisternum Marker dot position: points towards left shoulder The subject lies supine with head slightly low (no pillow). With feet on the bed, the knees are slightly elevated Better images are obtained with the abdomen relaxed and during inspiration Interatrial septum, pericardial effusion, desc abdominal aorta

Suprasternal View Transducer position: suprasternal notch Marker dot direction: points towards left jaw The subject lies supine with the neck hyperexrended. The head is rotated slightly towards the left The position of arms or legs and the phase of respiration have no bearing on this echo window Arch of aorta

Echocardiography Basics View?

Echocardiography Basics View?

Echocardiography Basics View?

Valves of the Heart valves maintain the unidirectional flow of blood in the heart by opening and closing depending on the difference in pressure on each side. There are four valves in the heart The two atrioventricular (AV) valves between the atria and the ventricles. • The two semilunar (SL) valves, obvious in the arteries leaving the heart.
 Also known as the bicuspid valve contains two flaps. The mitral")
Mitral Valve (MV) Also known as the bicuspid valve contains two flaps. The mitral valve gets its name from the resemblance to a bishop's mitre (a type of hat). It allows the blood to flow from the left atrium into the left ventricle. It is on the left side of the heart and has two cusps or leaflets, the Anterior MV leaflet (AML) and the Posterior MV leaflet (PMV)
 The tricuspid valve is the three flapped valve on the right")
Tricuspid Valve (TV) The tricuspid valve is the three flapped valve on the right side of the heart, between the right atrium and the right ventricle which stops the backflow of blood between the two. This valve consists of 3 leaflets – a large anterior leaflet (ATL), a small septal leaflet (STL) and a tiny posterior leaflet (PTL)

Semilunar Valves These are positioned on the pulmonary artery and the aorta. The semilunar valves are flaps of endocardium and connective tissue reinforced by fibers which prevent the valves from turning inside out. They are shaped like a half moon, hence the name semilunar These valves do not have chordae tendinae. They are named Aortic and Pulmonary
 Lies between the left ventricle and the aorta and has three")
Aortic Valve (AV) Lies between the left ventricle and the aorta and has three cusps, anterior right coronary cusp (RCC) posterior non-coronary cusp (NCC) middle left coronary cusp (LCC) During ventricular systole, pressure rises in the left ventricle. When the pressure in the left ventricle rises above the pressure in the aorta, the aortic valve opens, allowing blood to exit the left ventricle into the aorta.
 Lies between the right ventricle and the pulmonary artery and has")
Pulmonary Valve (PV) Lies between the right ventricle and the pulmonary artery and has three cusps a posterior (left) cusp, an anterior cusp and a right cusp. Similar to the aortic valve, the pulmonary valve opens in ventricular systole, when the pressure in the right ventricle rises above the pressure in the pulmonary artery. At the end of ventricular systole, when the pressure in the right ventricle falls rapidly, the pressure in the pulmonary artery will close the pulmonary valve.

Systole/Diastole

Interpreting an Echo Report • Left ventricle – Size – Systolic function (EF, regional wall motion) – Diastolic function (relaxation) – Wall thickness (LVH)

Left ventricle - size Normal End-diastole 3. 5 -5. 7 cm End-systole 2. 1 -4. 0 cm

Left ventricle - size Normal End-diastole 3. 5 -5. 7 cm End-systole 2. 1 -4. 0 cm

Left ventricle - wall thickness IVS and PW 0. 6 -1. 1 cm
 FS = EDD-ESD / EDD")
Left ventricle - systolic function Fractional Shortening (FS) FS = EDD-ESD / EDD
")
LV Dimensions and Ejection Fraction (EF)

Left ventricle - systolic function
")
LV volume and Ejection Fraction (EF)
 Basal Level – MV")
Segmental Model: LV • 3 Levels → 17 segments (1) Basal Level – MV annulus to papillary muscle tips (2) Mid Level – Pap muscle tips to base of pap muscle (3) Apical Level – Base of pap muscle to apex

17 Segment Model

Coronary artery distribution

What are Regional Wall Motion Abnormalities? • Normal - > 40% increase in systolic wall thickness • Hypokinesis - < 40% increase in systolic wall thickness • Akinesis – negligible systolic thickening • Dyskinesis – Outward systolic expansion • Aneurysmal – Diastolic deformation with associated outward systolic expansion

Left ventricle - RWMAs

LV diastolic function • • Indicates LV relaxation and compliance Diastolic dysfunction occurs early in the disease process • Four key echocardiographic measurements to assess diastole 1. 2. 3. 4. Mitral inflow velocity profile Pulmonary vein inflow profile Mitral annular velocity or E’ Left atrial size / volume

Mitral Inflow • Increasing LA pressure • Increasing LV edp

Left ventricle - diastolic function Mitral inflow Pulmonary veins Mitral TVI

LV diastolic function - mitral inflow E/A > 1 E/A < 1 E/A >>1

LV diastolic function - mitral TVI E/A > 1 E/A < 1 E/A >>1

Mitral annular velocity • Measures velocity of myocardium at MV annulus • Represented as E’ • E/E’ correlates well with LV filling pressure

Left atrium - size Diameter Normal 2. 0 -4. 0 cm Mild 4. 0 -5. 0 cm Moderate 5. 0 -6. 0 cm Severe >6. 0 cm

Left atrium - size Area Normal <20 cm 2 Mild 20 -30 cm 2 Moderate 30 -40 cm 2 Severe >40 cm 2

Valve regurgitation - quantification Colour - jet size/width PISA Spectral doppler Consequences

AR - LV Response • Chronic AR - decompensated LV • LVEF<55%, LVESD>55 mm, LVESV 60 ml/m 2

MR- Quantification of LV contractility LV systolic function - most important parameter • Ejection fraction, fractional shortening, velocity of circumferential fibre shortening - load dependent • MR allows supranormal values of EF etc. • Early systolic dysfunction if; • EF < 60% (severe MR) • ES diameter < 45 mm (26 mm/m 2)

Mitral stenosis - quantification

Aortic stenosis - quantification

Aortic stenosis - quantification

Right ventricle - size & function

Estimation of Pulmonary Pressure PA systolic pressure • Tricuspid regurgitation jet velocity

Estimation of Pulmonary Pressure RA pressure • IVC size

Cardiac Tamponade

Endocarditis Positive echocardiogram for IE Discrete, echogenic, oscillating intracardiac mass located at a site of endocardial injury (e. g. , on a valve or supporting structure, in pathway of regurgitant jet, or site of implanted material), or Periannular abscess, or New dehiscence of a prosthetic valve

Cardiac Resynchronisation

Cardiac Resynchronisation • Severe heart failure treatment to restore coordination to LV contraction • NYHA 3 -4 • EF < 35% • QRS duration > 120 msec
- Slides: 84