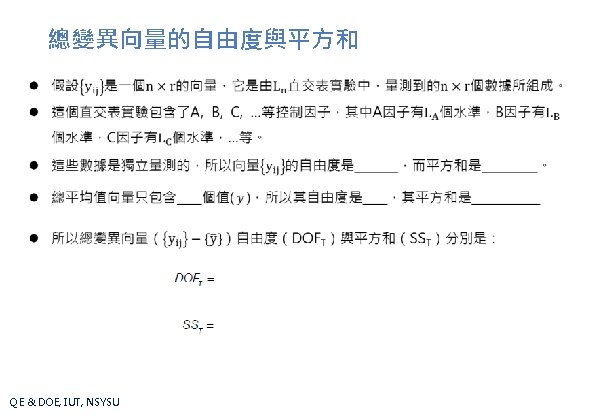
5 Analysis of Variance 1 Decomposition of Variations
 2. 因子的重要性測試(Significance Tests) 3.")
 5. 1")
及因子反應表(下表) Exp. 1 2 3 4 5 6 7 8")
 l 5. 1 -1式中也隱藏著另一個關係:________________, 亦即 以本例而言, l How to prove")
 How to prove the above equation? QE & DOE, IUT, NSYSU")

直交表實驗 表 5. 1 -3 L 4(23)直交表實驗數據及因子反應表 Exp. A B")


 表 5. 1 -5 瓷磚製程實例的變異分析表 Factor A B C")
- Slides: 28
第 5章 變異分析 Analysis of Variance 1. 變異的分解(Decomposition of Variations) 2. 因子的重要性測試(Significance Tests) 3. 實驗誤差的統合(Pooling of Errors) 4. 信賴區間(Confidence Intervals) 5. Excel圖表製作(二)(Graphing/Tabling Using Excel) QE & DOE, IUT, NSYSU
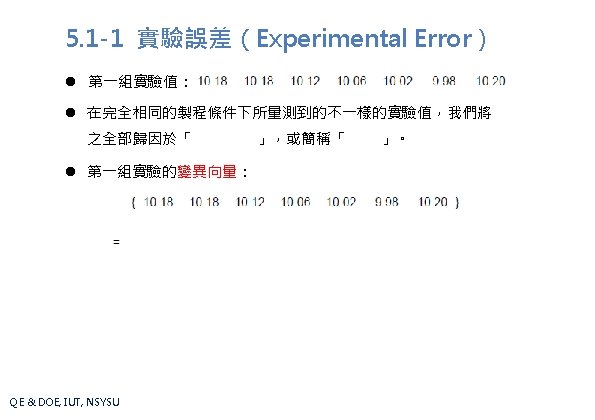
第 5. 1節 變異的分解 Decomposition of Variations 5. 1 -1 實驗誤差(Experimental Errors) 5. 1 -2 變異的分解: 1個控制因子(Decomposition of Variations) 5. 1 -3 變異的分解:多個控制因子(Multiple Control Factors) 5. 1 -4 實例:L 4(23)直交表實驗(Example: L 4(23) Experiments) 5. 1 -5 實例:瓷磚製程實驗(Example: Tile Experiments) QE & DOE, IUT, NSYSU
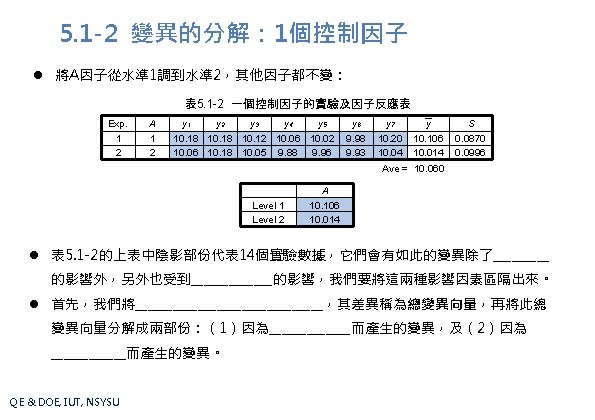
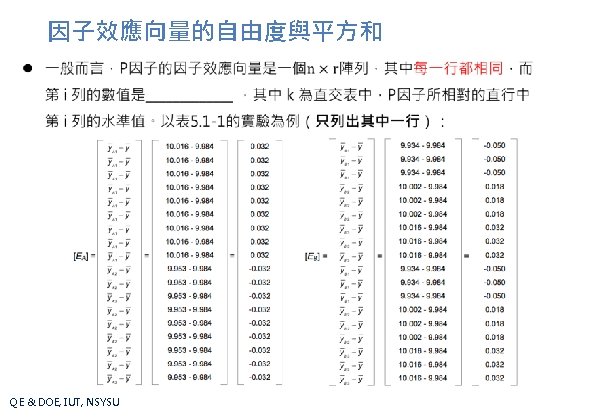
表 5. 1 -1 瓷磚製程實驗的數據(上表)及因子反應表(下表) Exp. 1 2 3 4 5 6 7 8 9 10 11 12 13 14 15 16 17 18 A 1 1 1 1 1 2 2 2 2 2 B 1 1 1 2 2 2 3 3 3 C 1 2 3 1 2 3 D 1 2 3 2 3 1 3 1 2 Level 1 2 3 QE & DOE, IUT, NSYSU E 1 2 3 1 1 2 3 3 1 2 2 3 1 F 1 2 3 1 3 1 2 2 3 1 1 2 3 3 1 2 G 1 2 3 3 1 2 2 3 1 3 1 2 3 A 10. 016 9. 953 H 1 2 3 3 1 2 1 2 3 1 y 2 10. 18 10. 03 9. 81 10. 09 10. 06 10. 20 9. 91 10. 32 10. 04 10. 00 9. 97 10. 06 10. 15 9. 91 10. 02 10. 08 10. 07 10. 10 10. 18 10. 01 9. 78 10. 05 10. 19 9. 88 10. 28 10. 02 9. 98 9. 97 9. 94 10. 08 9. 87 10. 00 10. 02 10. 08 B 9. 934 10. 002 10. 016 C 9. 988 9. 996 9. 969 y 3 y 4 y 5 y 6 y 7 10. 12 10. 06 10. 02 9. 98 10. 20 9. 98 9. 96 9. 91 9. 89 10. 12 9. 74 9. 71 9. 68 9. 87 10. 07 9. 99 9. 92 9. 88 10. 14 10. 05 9. 89 9. 85 9. 78 10. 12 10. 18 10. 17 10. 14 10. 13 10. 22 9. 88 9. 84 9. 82 9. 80 9. 93 10. 25 10. 20 10. 18 10. 36 10. 01 9. 98 9. 95 9. 89 10. 11 9. 93 9. 80 9. 77 9. 70 10. 15 9. 91 9. 88 9. 87 9. 85 10. 05 9. 90 9. 88 9. 80 9. 72 10. 12 10. 04 9. 98 9. 91 9. 90 10. 22 9. 86 9. 87 9. 85 9. 80 10. 02 9. 95 9. 92 9. 78 9. 71 10. 06 9. 99 9. 95 9. 92 9. 85 10. 14 9. 89 9. 85 9. 76 10. 19 10. 05 9. 99 9. 97 9. 95 10. 12 D 9. 989 9. 970 9. 995 E 9. 999 10. 015 9. 938 F 10. 074 9. 972 9. 906 y 10. 106 9. 986 9. 761 10. 024 9. 971 10. 176 9. 866 10. 253 10. 000 9. 904 9. 929 9. 917 10. 040 9. 883 9. 920 9. 990 9. 953 10. 037 Ave = 9. 984 G H 9. 978 10. 032 9. 967 10. 020 10. 007 9. 901 S 0. 0870 0. 0776 0. 0641 0. 0964 0. 1293 0. 0321 0. 0476 0. 0709 0. 0698 0. 1563 0. 0713 0. 1392 0. 1199 0. 0687 0. 1295 0. 0973 0. 1473 0. 0673
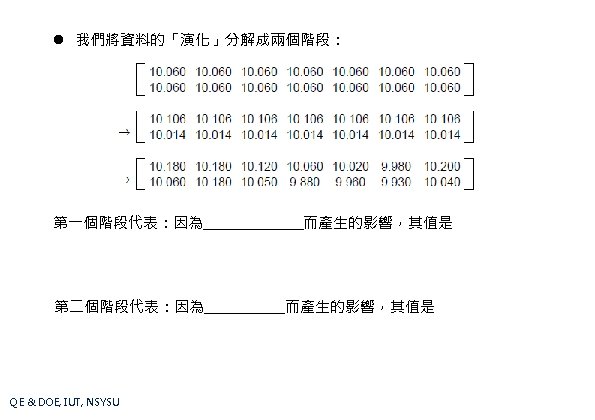
平方和(Sum of Squares, SS) l 5. 1 -1式中也隱藏著另一個關係:________________, 亦即 以本例而言, l How to prove the relationship shown in equation (5. 1 -4)? QE & DOE, IUT, NSYSU
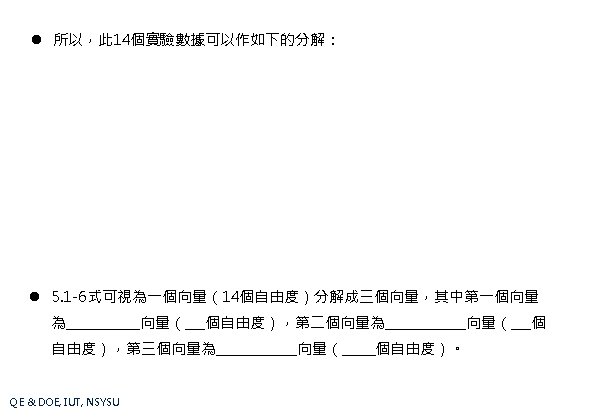
向量分解:畢氏定理(Pythagorean Theorem) How to prove the above equation? QE & DOE, IUT, NSYSU
5. 1 -4 實例:L 4(23)直交表實驗 表 5. 1 -3 L 4(23)直交表實驗數據及因子反應表 Exp. A B C y 1 y 2 y 3 y 4 y 5 y S 1 2 3 4 1 1 2 2 1 2 1 2 2 1 69. 7 62. 1 100. 2 99. 1 72. 4 77. 2 89. 6 104. 4 55. 0 72. 5 95. 2 100. 7 65. 3 69. 8 102. 5 105. 8 68. 7 71. 9 98. 8 95. 6 66. 2 70. 7 97. 3 101. 1 6. 77 5. 52 5. 03 4. 10 Ave. = 83. 825 Level 1 Level 2 QE & DOE, IUT, NSYSU A 68. 46 99. 19 B 81. 74 85. 91 C 83. 67 83. 98
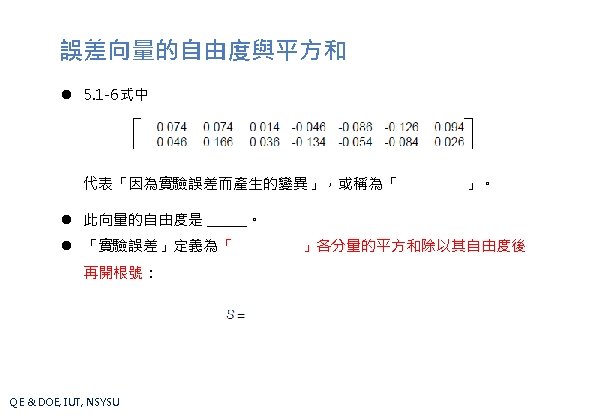
向量分解 DOF: SS: QE & DOE, IUT, NSYSU
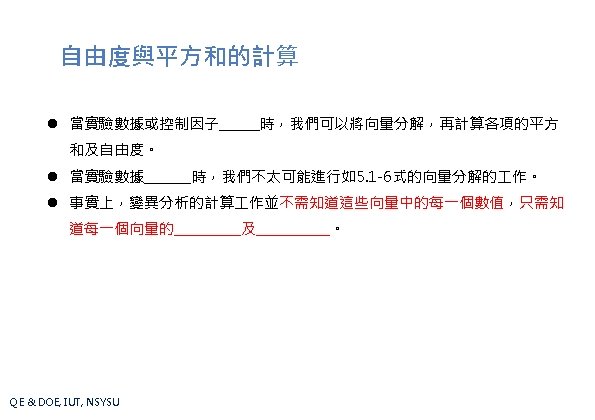
利用公式計算 QE & DOE, IUT, NSYSU
變異分析表 表 5. 1 -4 變異分析表 Factor A B C Error Total SS 4721. 67 86. 94 0. 48 473. 67 5282. 76 DOF 1 16 19 Var 29. 60 Var:變異數;誤差平方和除以自由度,亦即實驗誤差的____。 QE & DOE, IUT, NSYSU
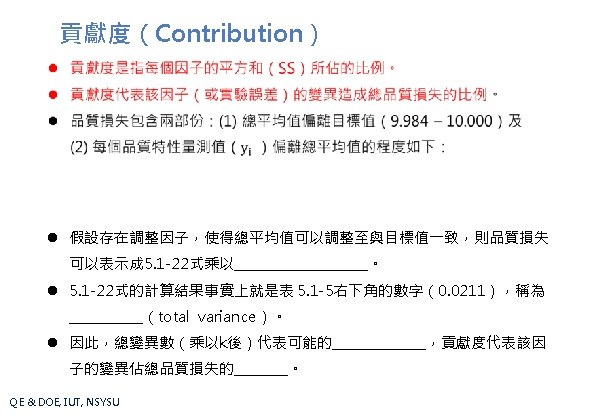
5. 1 -5 實例:瓷磚製程實驗(Tile Experiments) 表 5. 1 -5 瓷磚製程實例的變異分析表 Factor A B C D E F G H Others Error Total SS 0. 1264 0. 1642 0. 0165 0. 0143 0. 1378 0. 6005 0. 0361 0. 4421 0. 0343 1. 0640 2. 6363 DOF 1 2 2 2 2 108 125 Contribution 4. 79% 6. 23% 0. 63% 0. 54% 5. 23% 22. 78% 1. 37% 16. 77% 1. 30% 40. 36% 100. 00% Var 0. 0099 0. 0211 此例中,以下兩式不成立,因為此例是________實驗。 那麼,該如何計算Others那一列的數值? QE & DOE, IUT, NSYSU