
5 4 Analyzing Graphs of Polynomial Functions Maximum
- Slides: 7
5. 4 - Analyzing Graphs of Polynomial Functions
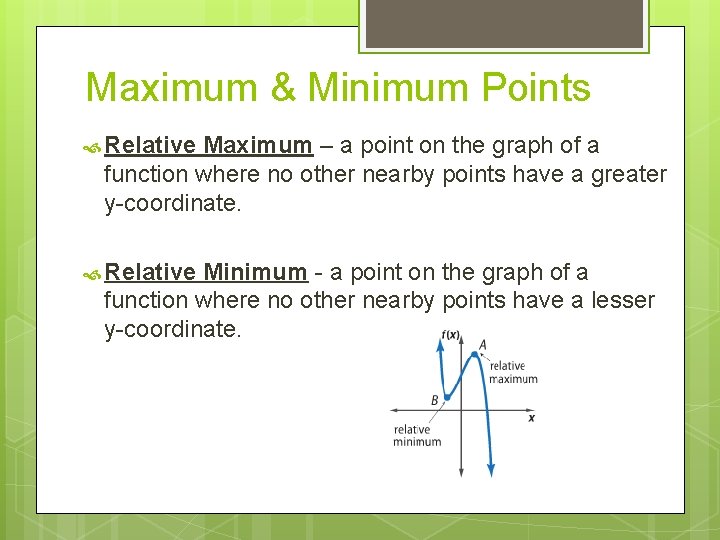
Maximum & Minimum Points Relative Maximum – a point on the graph of a function where no other nearby points have a greater y-coordinate. Relative Minimum - a point on the graph of a function where no other nearby points have a lesser y-coordinate.
Maximum & Minimum Points Extrema – max. and min. values of a function. Turning Point rules to remember The graph of a polynomial function of n has at most n – 1 turning points. If degree 2+ turning points are between roots, imaginary numbers exist
Find Extrema on Calculator: Enter equation into y =. 2 nd TRACE Choose 3: minimum or 4: maximum. Curser on left of min/max, enter. Curser on right of min/max, enter. Enter.
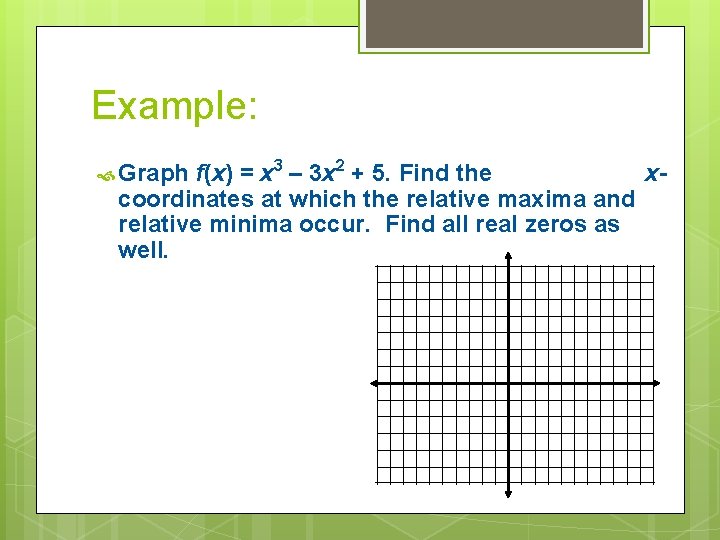
Example: f(x) = x 3 – 3 x 2 + 5. Find the xcoordinates at which the relative maxima and relative minima occur. Find all real zeros as well. Graph
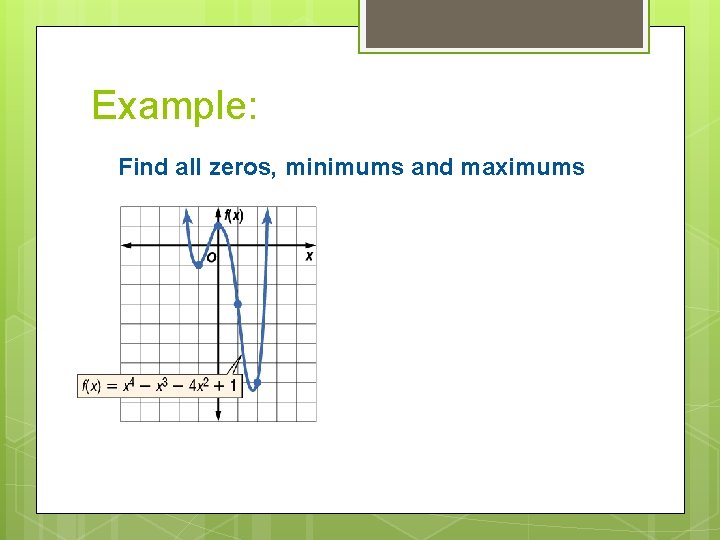
Example: Find all zeros, minimums and maximums
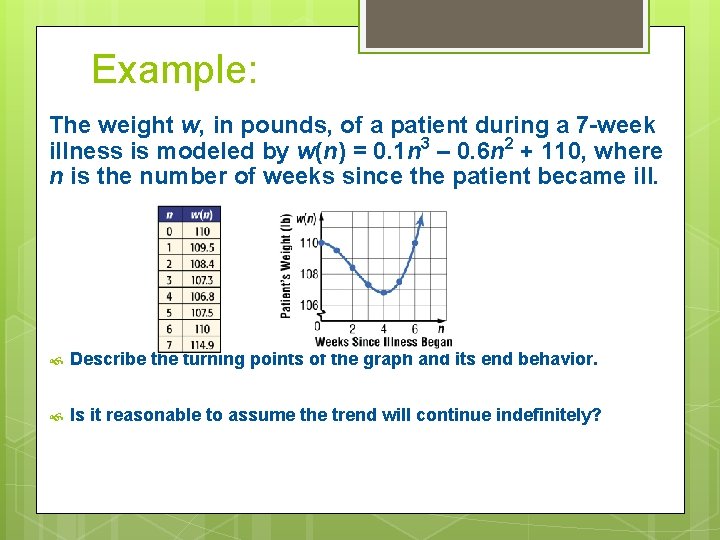
Example: The weight w, in pounds, of a patient during a 7 -week illness is modeled by w(n) = 0. 1 n 3 – 0. 6 n 2 + 110, where n is the number of weeks since the patient became ill. Describe the turning points of the graph and its end behavior. Is it reasonable to assume the trend will continue indefinitely?