5 2 Probability Rules Basic Rules of Probability

5. 2: Probability Rules

Basic Rules of Probability

Probability Models The sample space S of a chance process is the set of all possible outcomes. A probability model is a description of some chance process that consists of two parts: a sample space S and a probability for each outcome. Example of Coin Toss: Sample Space: Either heads or tails. Probability: Heads (0. 5) and Tails (0. 5)

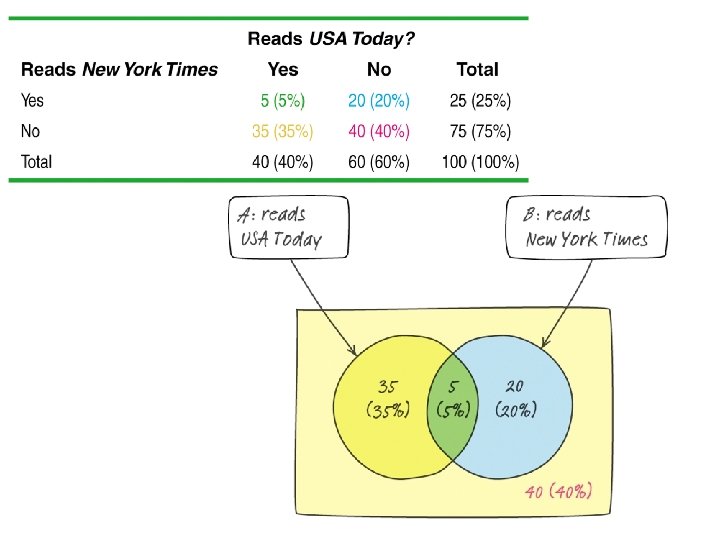
Probability Models Venn Diagram, Tree Diagram, List, Chart, etc.

Probability Models Probability models allow us to find the probability of any collection of outcomes. An event is any collection of outcomes from some chance process. That is, an event is a subset of the sample space. Events are usually designated by capital letters, like A, B, C, and so on. Specific “event” examples: - Flipping 3 heads in a row - Rolling two dice that sum to 5

Sample Space: Rolling Two Dice The probability model for the chance process of rolling two fair, six-sided dice – one that’s red and one that’s green. Sample Space 36 Outcomes Since the dice are fair, each outcome is equally likely. Each outcome has probability 1/36.
=")
Probability Models Event: Rolling a sum of “ 5” with 2 dice or P(A)= sum of 5 Event Space: There are 4 different combination of dice rolls that sum to 5. Solution: Since each outcome has probability 1/36: P(A) = 4/36 or 1/9.

Complement • The event that did not occur…. not A • A= airplane takes off on time • Ac= airplane does not take off on time

Mutually Exclusive • Two events that cannot occur at the same time. There are no common outcomes. • Student is EITHER a Junior or Senior

Intersection • Probability of both events occurring. • For example: A = likes salad, B = likes meat, therefore P(A and B) = likes both salad and meat
 § Mutually")
Calculating Probabilities § Complement of A § Complement = 1 – P(A) § Mutually Inclusive (A or B) § P(A or B) = P(A) + P(B) – P(A and B) § Intersection (A and B) § P(A and B)

2014 AP Statistics Exam Scores Probabilities: Score 1 2 3 4 5 Probability 0. 223 0. 183 0. 235 0. 224 0. 125 (a) Is this a legitimate probability model? Justify. (b) Find the probability that the chosen student scored 3 or better.

2014 AP Statistics Exam Scores Probabilities: Score 1 2 3 4 5 Probability 0. 223 0. 193 0. 183 0. 235 0. 224 0. 125 (a) Is this a legitimate probability model? Justify. Each probability is between 0 and 1 and the sum of the probabilities : 0. 223 + 0. 193 + 0. 235 + 0. 224 + 0. 125 = 1. (b) Find the probability that the chosen student scored 3 or better. The probability of scoring a 3 or better: 0. 235 + 0. 224 + 0. 125 = 0. 584

Online-learning courses are rapidly gaining popularity among college students. Randomly select an undergraduate student who is taking online-learning courses for credit and record the student’s age. Here is the probability model: Age group (yr): Probability: 18 to 23 24 to 29 30 to 39 40 or over 0. 57 0. 14 0. 12 (a) Is this a legitimate probability model? Justify. (b)Find the probability that the chosen student is not in the traditional college age group (18 to 23 years).

Distance-learning courses are rapidly gaining popularity among college students. Randomly select an undergraduate student who is taking distance-learning courses for credit and record the student’s age. Here is the probability model: Age group (yr): Probability: 18 to 23 24 to 29 30 to 39 40 or over 0. 57 0. 14 0. 12 (a)Is this a legitimate probability model? Justify. Each probability is between 0 and 1 and 0. 57 + 0. 14 + 0. 12 = 1 (b)Find the probability that the chosen student is not in the traditional college age group (18 to 23 years). P(not 18 to 23 years) = 1 – P(18 to 23 years) = 1 – 0. 57 = 0. 43

What is the relationship between educational achievement and home ownership? A random sample of 500 people and each member of the sample was identified as a high school graduate (or not) and as a home owner (or not). The two-way table displays the data. High School Graduate Not a High School Graduate Total Homeowner Not a Homeowner Total 221 89 310 119 71 190 340 160 500 What is the probability that a randomly selected person… • (a) is a high school graduate • (b) is a high school graduate and owns a home • (c) is a high school graduate or owns a home

What is the relationship between educational achievement and home ownership? A random sample of 500 people and each member of the sample was identified as a high school graduate (or not) and as a home owner (or not). The two-way table displays the data. High School Graduate Not a High School Graduate Total Homeowner Not a Homeowner Total 221 89 310 119 71 190 340 160 500 What is the probability that a randomly selected person… (a) is a high school graduate = 310/500 (b) is a high school graduate and owns a home = 221/500 (c) is a high school graduate or owns a home = 310 + 119 = 429/500
- Slides: 18