4 Network Design in the Supply Chain Part
 Power. Point presentation to accompany")


")
")
")
")


 Quantity in Tons (Dn)")
")
")

- Slides: 29
4 Network Design in the Supply Chain (Part 1) Power. Point presentation to accompany Chopra and Meindl Supply Chain Management, 5 e Global Edition Copyright © 2013 Pearson Education. 1 -1 5 -1
Network Design Decisions l Facility role l l Facility location l l Where should facilities be located? Capacity allocation l l What role, what processes? How much capacity at each facility? Market and supply allocation l What markets? Which supply sources?
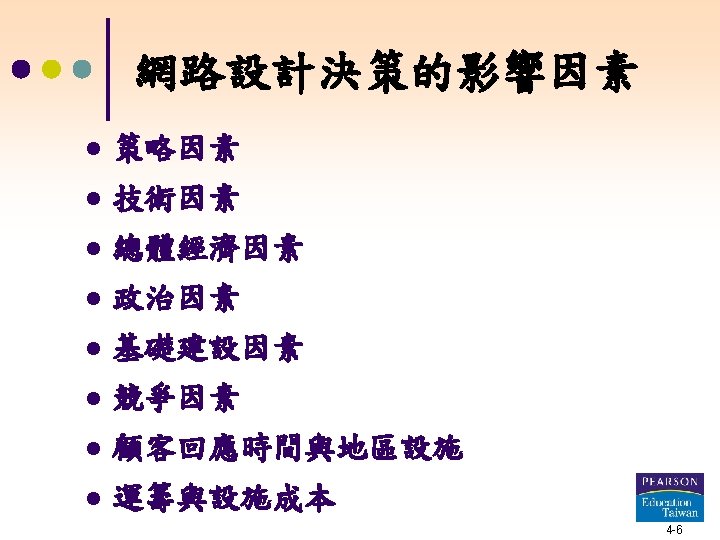
Factors Influencing Network Design Decisions l Strategic factors l Technological factors l Macroeconomic factors l l Tariffs and tax incentives l Exchange-rate and demand risk l Freight and fuel costs Political factors
Factors Influencing Network Design Decisions l Infrastructure factors l Competitive factors l Positive externalities between firms l Locating to split the market l Customer response time and local presence l Logistics and facility costs
Competitive Factors l Positive externalities between firms l Collocation benefits all – Locating to split the market • Locate to capture largest market share
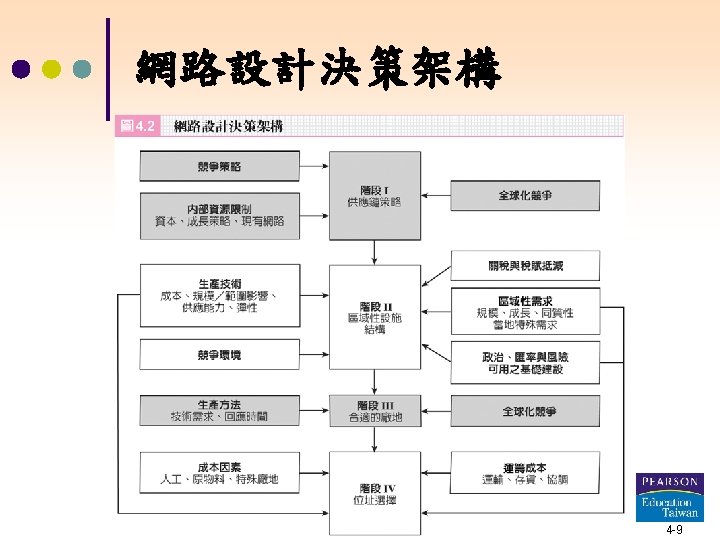
Framework for Network Design Decisions
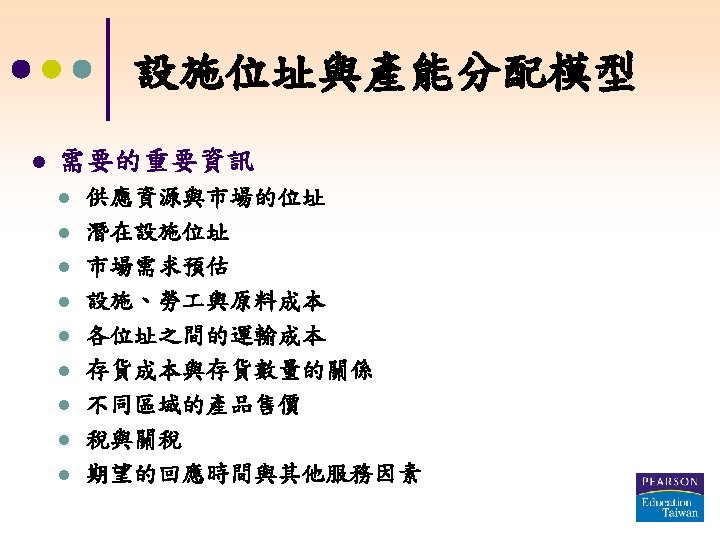
Models for Facility Location and Capacity Allocation l Needed Important information l l l l l Location of supply sources and markets Location of potential facility sites Demand forecast by market Facility, labor, and material costs by site Transportation costs between each pair of sites Inventory costs by site and as a function of quantity Sale price of product in different regions Taxes and tariffs Desired response time and other service factors
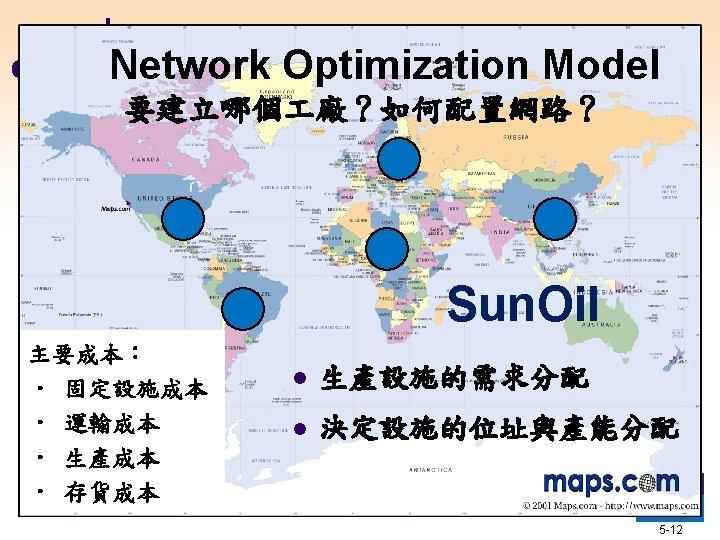
Network Optimization Model $: 1, 000 USD
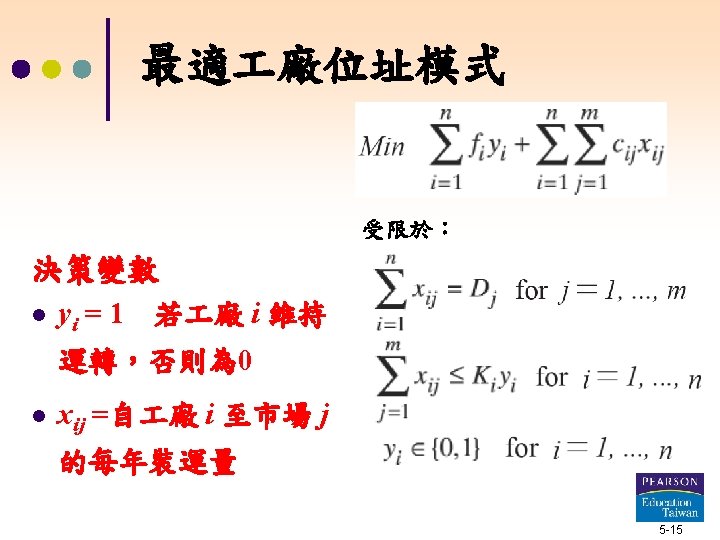
Capacitated Plant Location Model = number of potential plant locations/capacity Decision variables = number of markets or demand points = 1 if plant i is open, 0 otherwise = annual demand from market j = quantity shipped from plant i to market j = potential capacity of plant i = annualized fixed cost of keeping plant i open = cost of producing and shipping one unit from plant i to market j (cost includes production, inventory, transportation, and tariffs) subject to
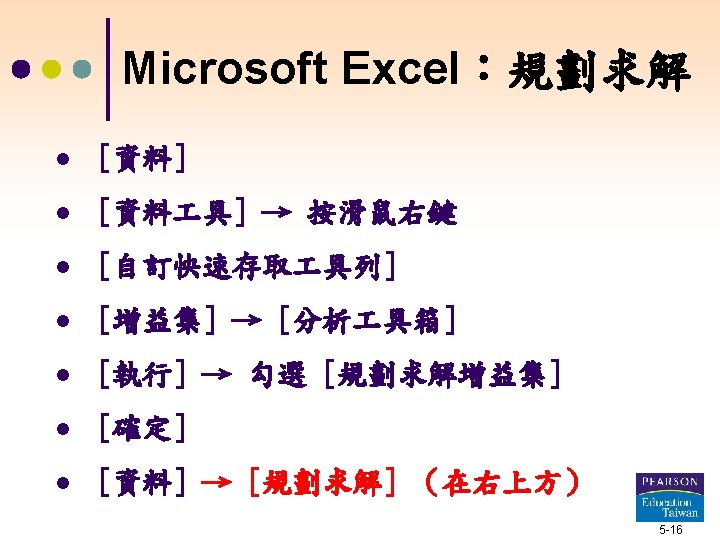
Capacitated Plant Location Model (Excel Step 1)
Capacitated Plant Location Model (Excel Step 2)
Capacitated Plant Location Model (Excel Step 3)
Capacitated Plant Location Model (Excel Cell Formula)
Network Optimization
Optimal Network 4 12 B 8 10 B 7 B 16 5 -22
Gravity Location Model ? ? ? 5 -23
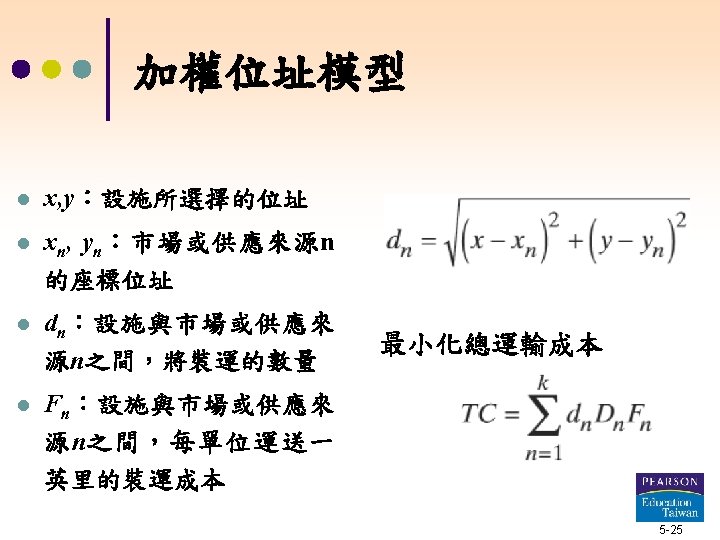
Gravity Location Model xn, yn: coordinate location of either a market or supply source n Fn: cost of shipping one unit for one mile between the facility and either market or supply source n Dn: quantity to be shipped between facility and market or supply source n (x, y) is the location selected for the facility, the distance dn between the facility at location (x, y) and the supply source or market n is given by Minimize Total transportation cost
Gravity Location Model Sources/Market s Transportation Cost $/Ton Mile (Fn) Quantity in Tons (Dn) Buffalo 0. 90 Memphis St. Louis Coordinates xn yn 500 700 1, 200 0. 95 300 250 600 0. 85 700 225 825 Atlanta 1. 50 225 600 500 Boston 1. 50 1, 050 1, 200 Jacksonville 1. 50 250 800 300 Philadelphia 1. 50 175 925 975 New York 1. 50 300 1, 080 Supply sources Markets
Gravity Location Model (Excel Steps)
Gravity Location Model (Excel Cell Formula)
Optimal Location