4 3 Probability Distributions of Continuous ii Probability

4. 3 Probability Distributions of Continuous
 Probability of an interval event is given by the area under the curve")
(ii) Probability of an interval event is given by the area under the curve of f(x) and above that interval. Note: If X is continuous r. v. then: (i) P(X= x)=0 for any x (ii) (iii) (iv)
 cumulative probability (vi) (vii) a A = 1 B Total area = 1")
(v) cumulative probability (vi) (vii) a A = 1 B Total area = 1

4. 4 The Normal Distribution: n One of the most important continuous distributions n Many measurable characteristics are normally or approximately normally distributed. (examples: height, weight, …) n The continuous r. v. X which has a normal distribution has several important characteristics: (1) (2) The density function of X , f(x) , has a bell-Shaped curve:
 The highest point of the curve of f(x) at the mean μ. The")
(3) The highest point of the curve of f(x) at the mean μ. The curve of f(x) is symmetric about the mean μ. μ = mean = mode = median � (4) The normal distribution depends on two parameters: mean = μ and variance = (5) If the r. v. X is normally distributed with mean μ and variance , we write: X ~ Normal or X ~ N (6) The location of the normal distribution depends on μ The shape of the normal distribution depends on

Normal

The Standard Normal Distribution: The normal distribution with mean μ = 0 and variance is called the standard normal distribution and is denoted by Normal (0, 1) or N(0, 1) • The standard normal distribution, Normal (0, 1), is very important because probabilities of any normal distribution can be calculated from the probabilities of the standard normal distribution. Resutl: If X ~ Normal , then ~ Normal (0, 1)
: Suppose Z ~ Normal (0, 1). (i) From")
Calculating Probabilities of Normal (0, 1): Suppose Z ~ Normal (0, 1). (i) From Table (A) page 223, 224 (ii) (Table A) a 0 (iii) a 0 b
")
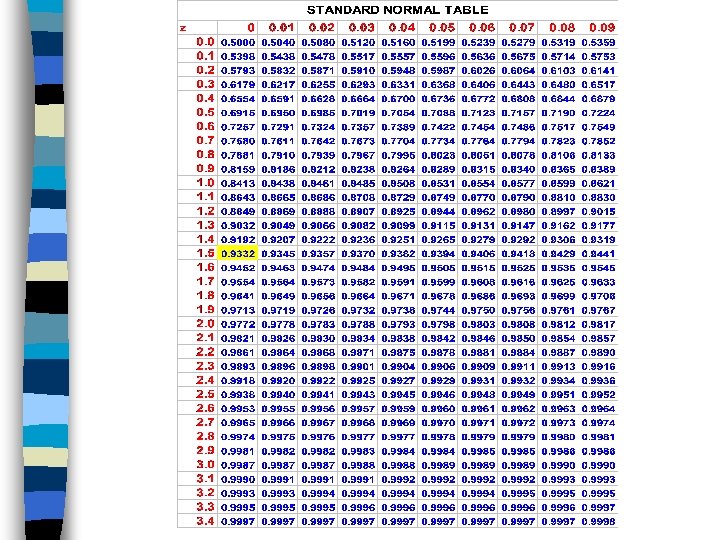
Table (A)
 for every a. Notation: For example: Example: Z ~ N(0, 1)")
(iv) for every a. Notation: For example: Example: Z ~ N(0, 1)
 (2) Z 0. 00 0. 01 … : 1. 5 0. 9332 :")
(1) (2) Z 0. 00 0. 01 … : 1. 5 0. 9332 : Z 0. 00 … 0. 08 : : : … … 0. 9 0. 8365
 Z … 0. 02 0. 03 Example: Z ~ N(0, 1) If Z")
(3) Z … 0. 02 0. 03 Example: Z ~ N(0, 1) If Z … 0. 05 … Then : 1. 6 0. 9505 :
 n")
Calculating Probabilities of Normal : n X ~ Normal Normal (0, 1) n
 X = hemoglobin level for healthy adults males =")
Example 4. 8 (p. 124) X = hemoglobin level for healthy adults males = 16 2 = 0. 81 X ~ Normal (16, 0. 81) The probability that a randomly chosen healthy adult male has hemoglobin level less than 14 is 1. 32% of healthy adult males have hemoglobin level less than 14.

Example 4. 9 : X = birth weight of Saudi babies = 3. 4 = 0. 35 2 = (0. 35)2 X ~ Normal (3. 4, (0. 35)2 ) The probability that a randomly chosen Saudi baby has a birth weight between 3. 0 and 4. 0 kg is 82. 93% of Saudi babies have birth weight between 3. 0 and 4. 0 kg.
: If is random sample of size n from Normal ,")
SOME RESULTS: Result (1): If is random sample of size n from Normal , then: (i) Normal (ii) Normal (0, 1) where Result (2): (Central Limit Theorem) If is a random sample of size n from any distribution with mean μ and variance , then: Normal (0, 1) (approximately) when the sample size n is large Note: “ ” means “approximately distributed”
: ( is unknown) If is a random sample of size n from")
Result (3): ( is unknown) If is a random sample of size n from any distribution with mean μ , then: when n is large
- Slides: 18