4 1 Inequalities and Their Graphs Inequalities less


- Slides: 24
4. 1 Inequalities and Their Graphs
Inequalities “less than or equal to” “less than” “greater than or equal to”
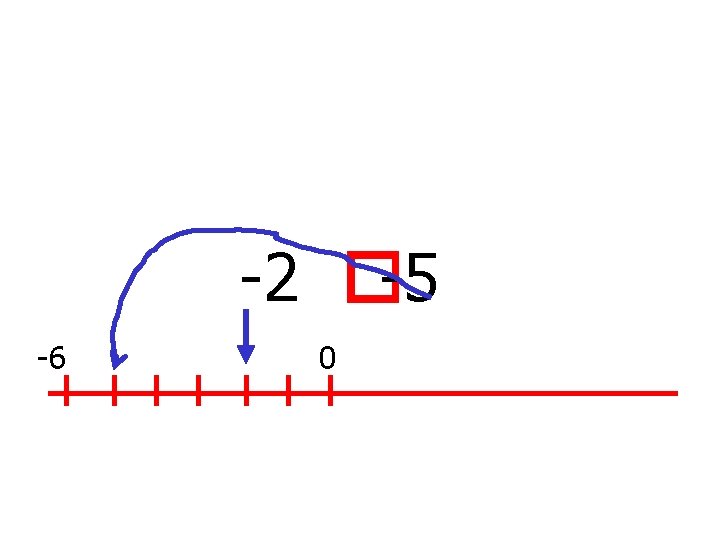
Review: fill in the blank with <, >, or =to make each statement true. 2 � 3
Solutions A # is a solution if it makes the inequality true
x<3 Is 2 a solution? Thumb up if yes Thumb down if not a solution
x<3 Is 0 a solution? Thumb up if yes Thumb down if not a solution
x<3 Is -5 a solution? Thumb up if yes Thumb down if not a solution
x<3 Is 3 a solution? Thumb up if yes Thumb down if not a solution
Graphing Inequalities • There are many solutions to an equality so it is important to show the visual representation with a graph.
Graph the solution of x< 3 2. 999 -6 -4 -2 0 2 4 6
How to graph inequalities • Place a circle on the # • If it is < or > leave the circle un-shaded, if it is ≤ or ≥ shade the circle • When x is on the left hand side, if it is > or ≥ shade to the right if it is < or ≤ shade to the left
Graph the solution of x < -1 -1 0
Graph the solution of x > -2 -6 -4 -2 0 2 4 6
Graph the solution of x -2 If you have ≤ or ≥ you draw a closed circle -6 -4 -2 0 2 4 6
Graph the solution of x |-2| -6 -4 -2 0 2 4 6
-6 -4 -2 0 This is the graph of: -2 x > -2 x < -2 1) x 2) 3) 4) 2 4 6
-6 -4 -2 0 This is the graph of: 1 x > -1 x>1 1) x 2) 3) 4) 2 4 6
Write the inequality shown in this graph -6 -4 -2 0 2 4 6
Write the inequality shown in this graph -6 -4 -2 0 2 4 6
Write the inequality shown in this graph -6 -4 -2 0 2 4 6
Write the inequality shown in this graph -6 -4 -2 0 2 4 6
Assignment: Page 173 # 2 -30 even