33 000 13 000 km 3 71 000


 380 360 340 320 Mauna Loa Observatory, Hawaii")


 380 360 340 320 Mauna Loa Observatory, Hawaii")


 60% 10% after Jetz, et al.")


 300 250 200 • Vostock Ice Core, Antarctica")


- Slides: 52
33, 000 13, 000 km 3 71, 000 km 3 425, 000 km 3 40, 000 km 3 15, 300, 000 km 3 1, 350, 000 km 3
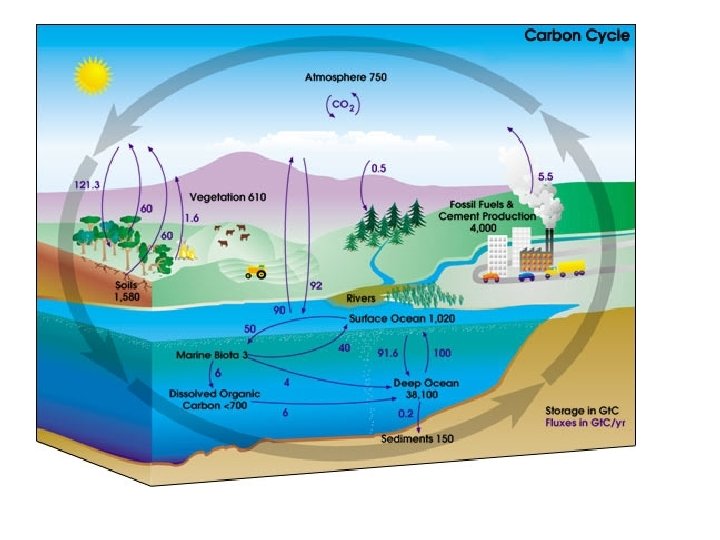
Carbon Cycling
Nitrogen Cycling
Global Biogeochemical Cycles • 350 -550 billion tons of carbon trapped in microbes • 85 -130 billion tons nitrogen in microbes • 9 -14 billion tons phosphorus in microbes • 85% of the 15 billion tons of nitrogen fixed annually is fixed by bacteria • 50% of oxygen produced by cyanobacteria
Carbon Cycling
Carbon dioxide concentration (ppm) 380 360 340 320 Mauna Loa Observatory, Hawaii
1900 1901 1902 1903 1904 1905 1906 1907 1908 1909 1910 1911 1912 1913 1914 1915 1917 1918 1919 Hottest years on 1916 Record 1920 1921 1922 1923 1924 1925 1926 1927 1928 1929 1930 1932 1933 1934 1935 1936 1937 1938 1939 1940 1941 1942 1943 1944 1945 1946 1947 1948 1949 1950 1951 1952 1953 1954 1955 1956 1957 1958 1959 1960 1961 1962 1963 1964 1965 1966 1967 1968 1969 1970 1971 1972 1973 1974 1975 1976 1977 1978 1979 1980 1981 1982 1983 1984 1985 1986 1987 1988 1989 1990 1991 1992 1993 1994 1995 1996 1997 1998 1999 2000 2001 2002 2003 2004 2005 2006 2007 2008 2009 2010 2011 2012
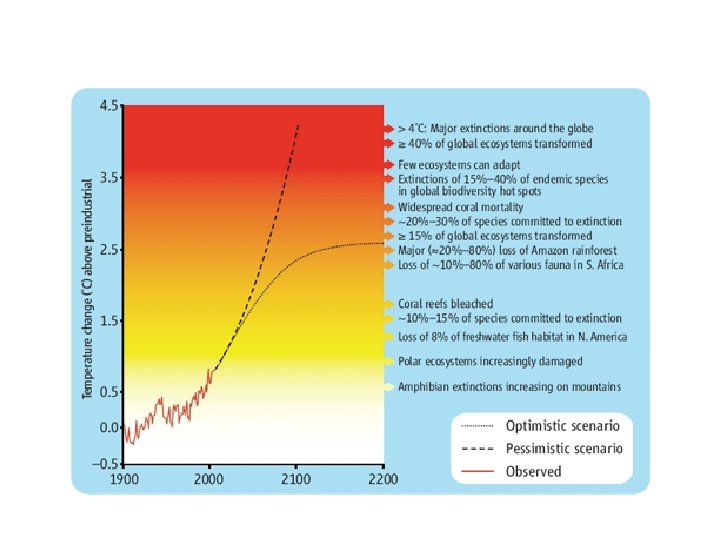
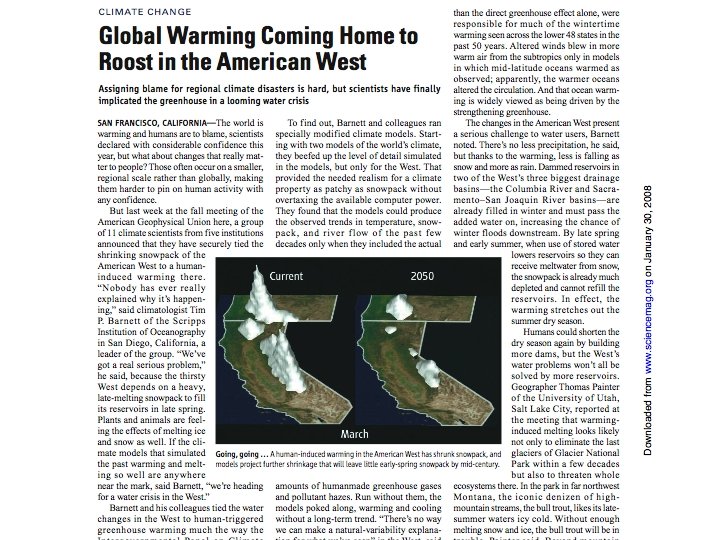
IPCC Projected Impacts
Carbon dioxide concentration (ppm) 380 360 340 320 Mauna Loa Observatory, Hawaii
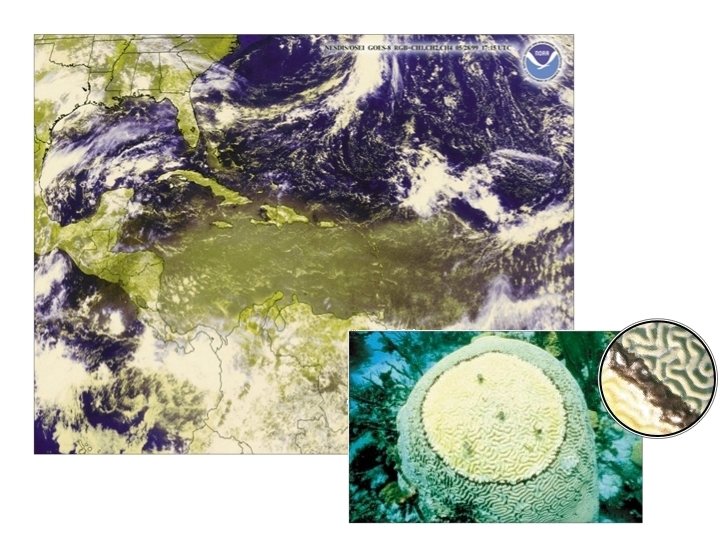
Ocean Acidification CO 2 + H 20 H 2 CO 3 HCO 3 - + H+
Hoegh-Guldberg, et al. Science, 2008
Location Of The Stations Ambika Badh, 2009
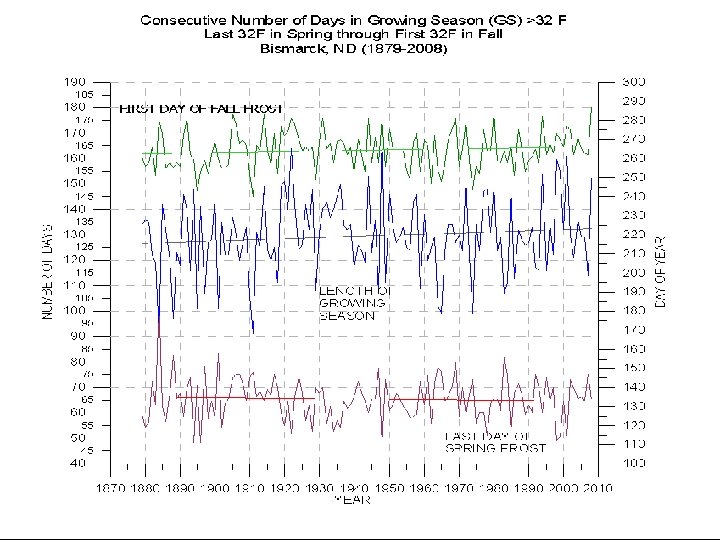
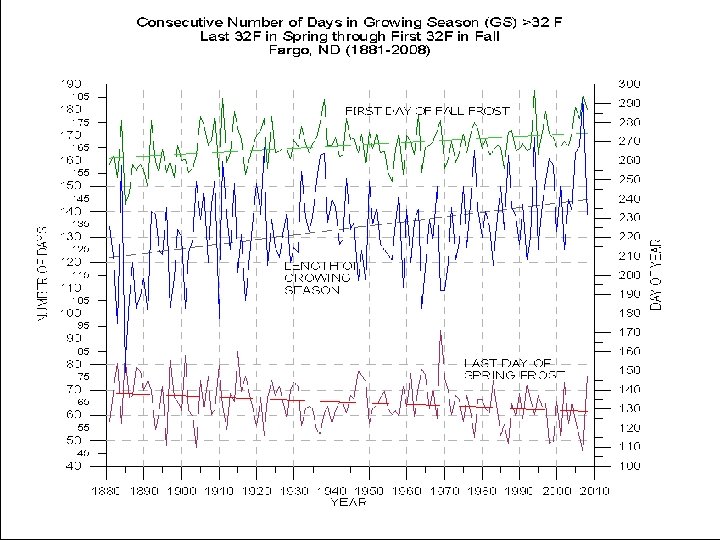
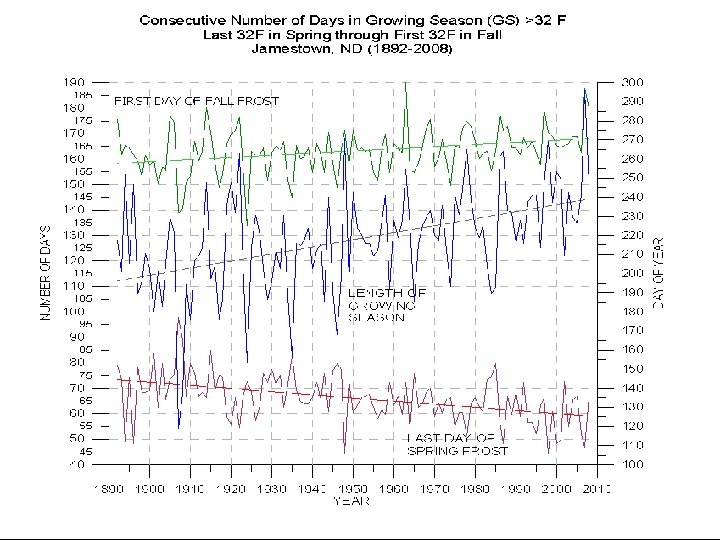
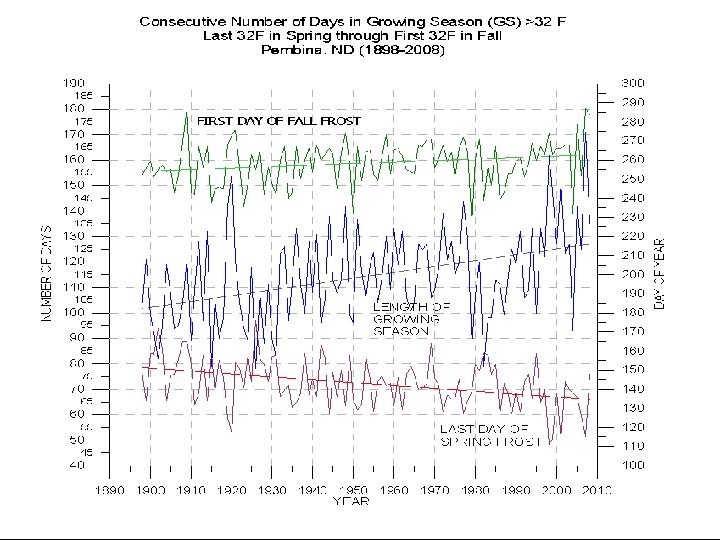
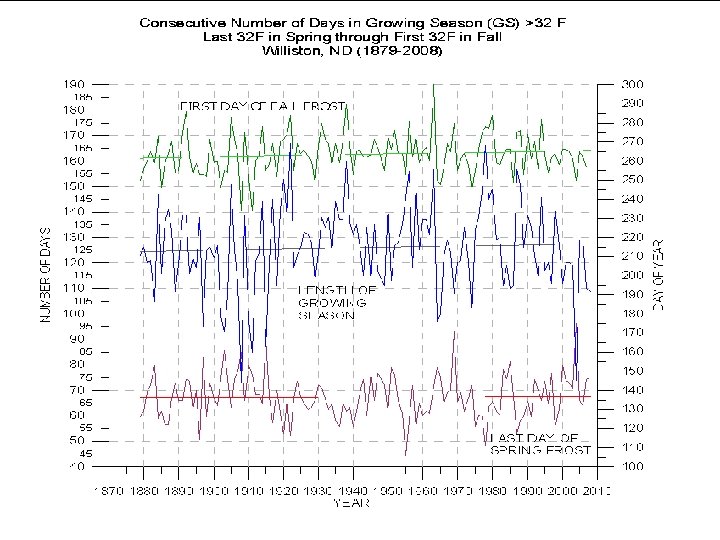
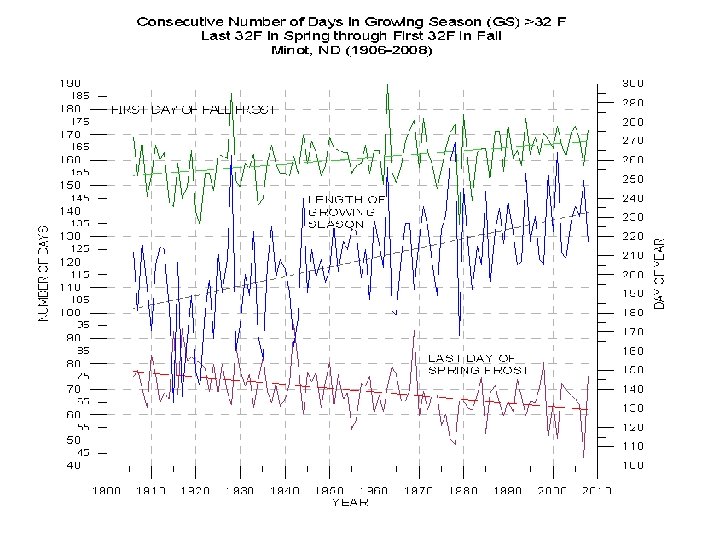
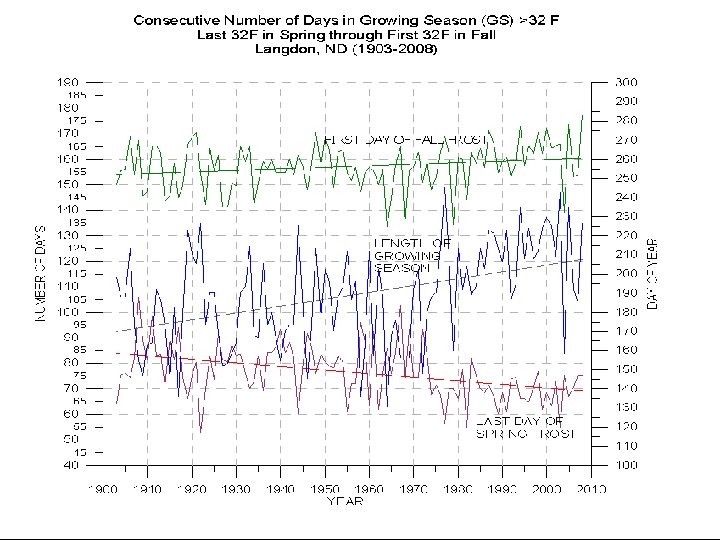
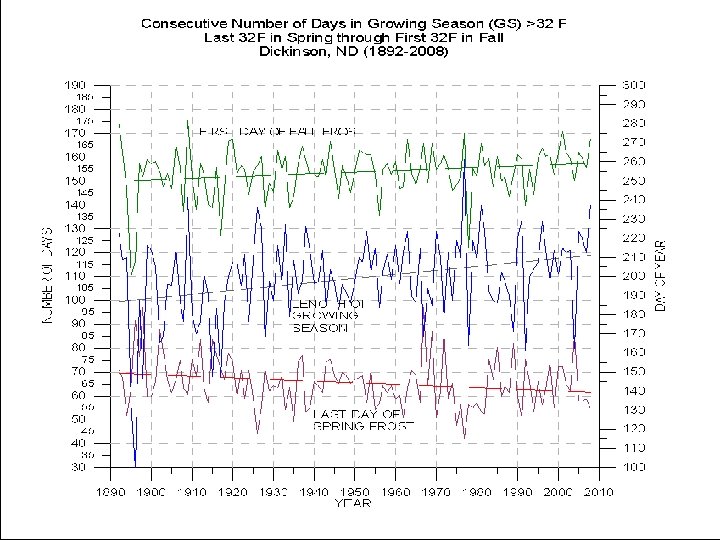
1879 1884 1889 1894 1899 1904 1909 1914 1919 1924 1929 1934 1939 1944 1949 1954 1959 1964 1969 1974 1979 1984 1989 1994 1999 2004 Average Growing season length for North Dakota 160 150 140 130 Growing season length 120 110 100 90 80
Ambika Badh’s Predictions at 2007 NDAS meeting • Longer growing season • Higher yield • Better quality and different varieties of crop • Stronger economy • Changes in rainfall pattern (+/-) • Higher risk of flood • Higher risk of drought
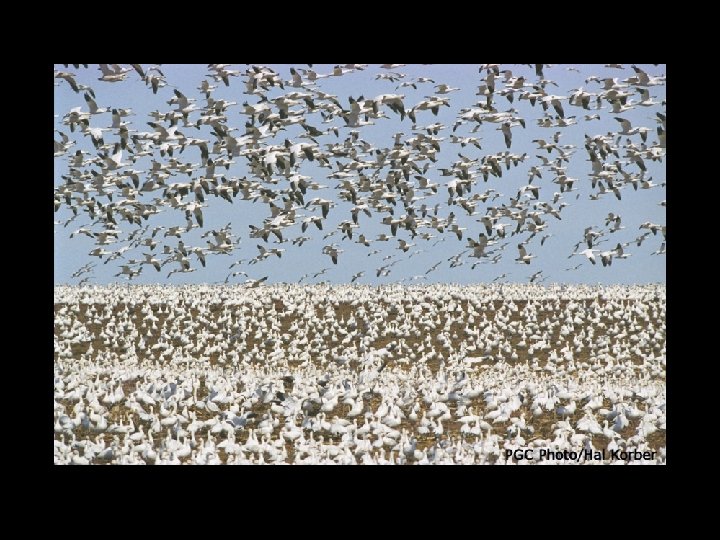
Bird range shrinkage by 2050 (8, 750 species) 60% 10% after Jetz, et al. PLOS Biology, 2007
Fig. 25 -5, p. 454
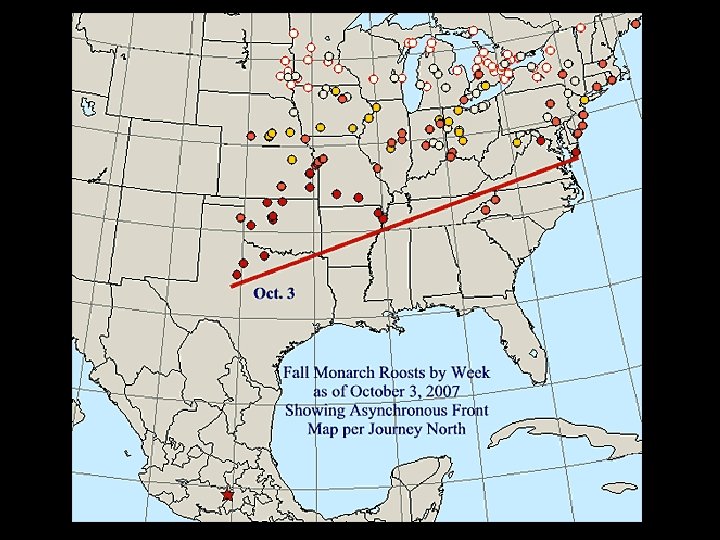
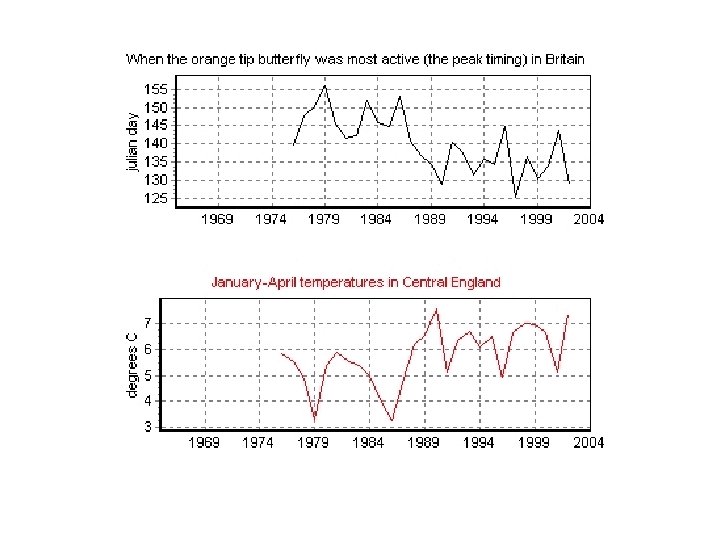
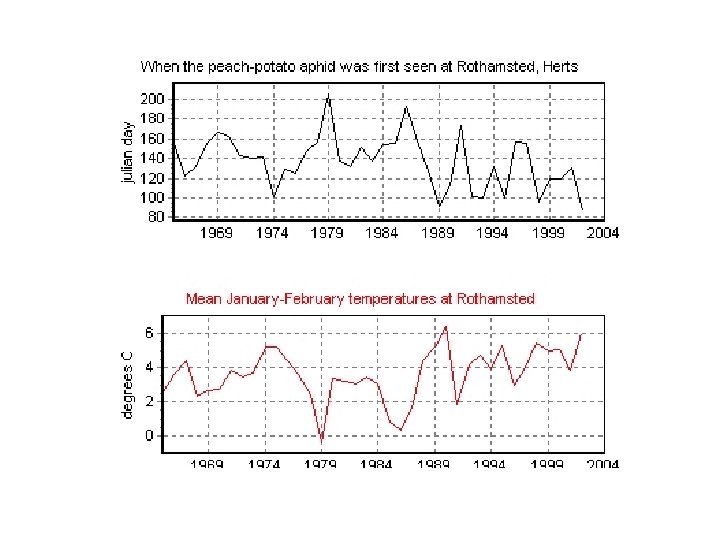
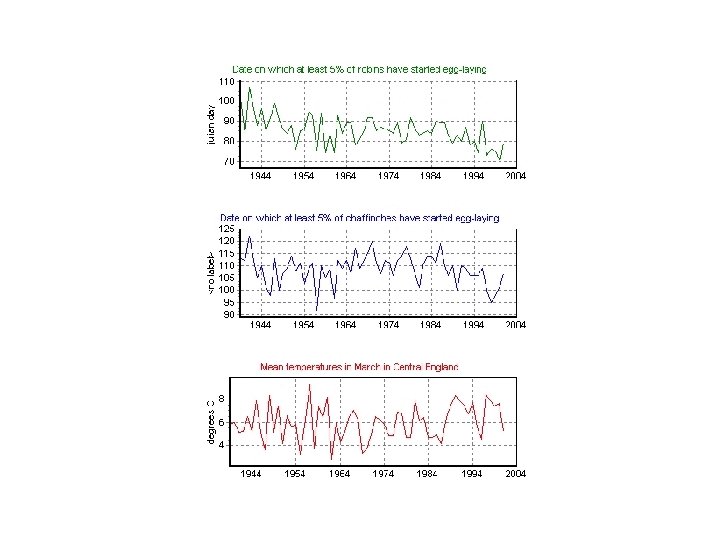
• Parmesan, et al. Nature. 1999
The end
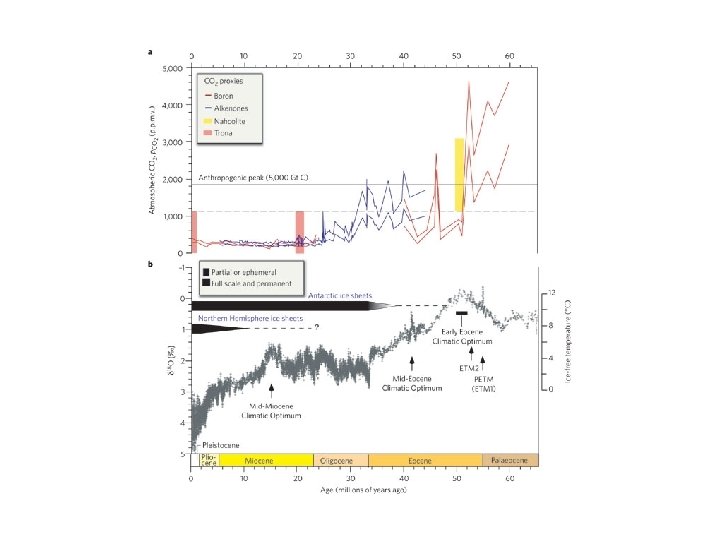
Carbon dioxide concentration (ppm) 300 250 200 • Vostock Ice Core, Antarctica
Projected Temperature Change Moderate Greenhouse Gas Increase Large Greenhouse Gas Increase
• Parmesan, et al. Nature. 1999
• Parmesan, et al. Nature. 1999