31 E7 Column Resolution The resolution Rs of


B required to elute the two species in Figure 31 -17")


 9, 10")
 is best since it shows")


- Slides: 34
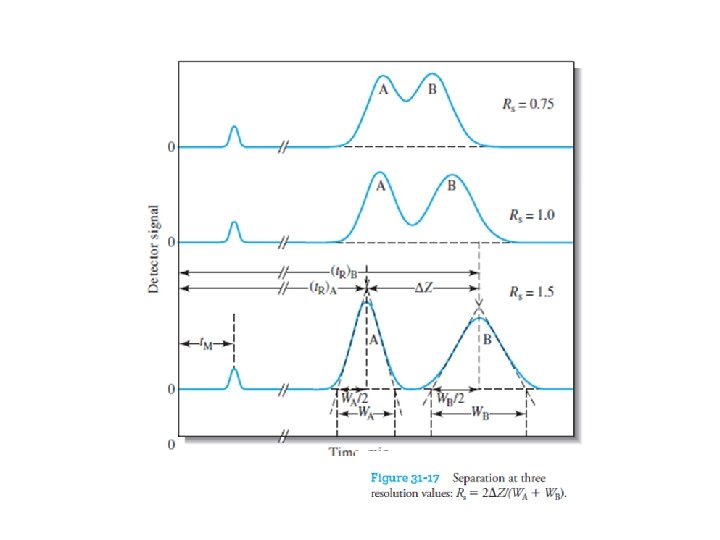
31 E-7 Column Resolution The resolution, Rs, of a column tells us how far apart two bands are relative to their widths. The resolution provides a quantitative measure of the ability of the column to separate two analytes (Figure 31 -17)
The resolution of each column is defined as where all of the terms on the right side are as defined in the figure
A resolution of 1. 5 gives an essentially complete separation of two components in a mixture, but a resolution of 0. 75 does not. At a resolution of 1. 0, zone A contains about 4% B, and zone B contains about 4% A. At a resolution of 1. 5, the overlap is about 0. 3%. The resolution for a given stationary phase can be improved by lengthening the column, thus increasing the number of plates. The added plates, however, result in an increase in the time required for separating the components.
The resolution of a chromatographic column is a quantitative measure of its ability to separate analytes A and B.
Effect of Retention Factor and Selectivity Factor on Resolution The resolution of a column is related to number of plates it contains, and to the retention and selectivity factors of a pair of solutes on the column. For the two solutes A and B in Figure 31 -17, the resolution is given by the equation where k. B is the retention factor of the slower-moving species and α is the selectivity factor.
This equation can be rearranged to give the number of plates needed to realize a given resolution:
Effect of Resolution on Retention Time The goal in chromatography is the highest possible resolution in the shortest possible elapsed time. Unfortunately, these goals tend to be incompatible, and a compromise between them is usually necessary.
The time (t. R)B required to elute the two species in Figure 31 -17 with a resolution of Rs is given by where u is the linear velocity of the mobile phase.
Optimization Techniques Eqs. 31 -30 and 31 -32 serve as guides for choosing conditions that lead to a desired resolution in shortest time. Each equation is made up of three parts. The first describes the efficiency of the column in terms of "N or H. The second, which is the quotient containing α, selectivity term that depends on properties of the two solutes.
The third component is the retention factor term, which is the quotient containing k. B, the term that depends on the properties of both the solute and the column. Variation in Plate Height equivalent to theoretical plates The column resolution improves as the square root of the number of plates increases Equation 31 -30. However, that increasing the N requires longer time unless the increase is achieved by reducing the H and not by increasing column length.
Methods for minimizing plate height Reducing the particle size of the packing material, the diameter of the column, and the thickness of the liquid film. Optimizing the flow rate of the mobile phase is also helpful.
Variation in the Retention Factor. Often, a separation can be improved significantly by manipulation of the retention factor k. B. Increases in k. B generally enhance resolution (but at the expense of elution time). To determine the optimum range for k. B, it is convenient to write Equation 31 -30 in the form
Figure 31 -18 Effect of retention factor k. B on resolution Rs and elution time (t. R)B. It is assumed that Q and Q’ remain constant with variations in k. B.
where Q and Q’ contain the rest of the terms in the two equations. Fig. 31 -18 is a plot of Rs/Q and (t. R)B/Q’ as a function of k. B, assuming Q and Q ’ remain approximately constant. It is clear that values of k. B > 10 should be avoided because they provide little increase in resolution but markedly increase the time required for separations.
q The minimum in the elution-time curve occurs at k. B < 2. q Often, the optimal value of k. B lies in the range from 1 to 5. q Usually, the easiest way to improve resolution is by optimizing k. q For gaseous mobile phases, k can often be improved by temperature changes.
q For liquid mobile phases, changes in the solvent composition often permit manipulation of k to yield better separations. q An example of the dramatic effect that relatively simple solvent changes can bring about is demonstrated in Figure 31 -19. q Where, modest variations in the methanol/water ratio convert unsatisfactory chromatograms (a & b) to chromatograms with well-separated peaks for each component (c & d).
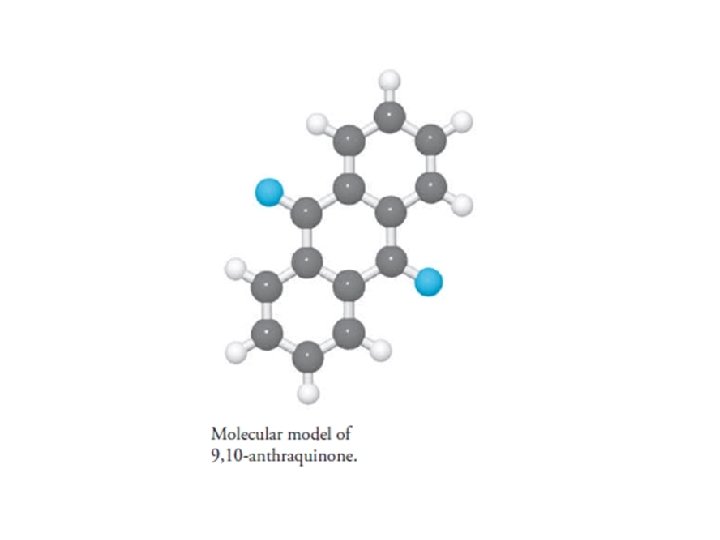
Figure 31 -19 Effect of solvent variation on chromatograms. Analytes are (1) 9, 10 -anthraquinone; (2) 2 -methyl-9, 10 -anthraquinone; (3) 2 -ethyl-9, 10 anthraquinone; (4) 1, 4 -dimethyl-9, 10 -anthraquinone; and (5) 2 -t-butyl-9, 10 anthraquinone.
q For most purposes, the chromatogram shown in (c) is best since it shows adequate resolution in minimum time. q The retention factor is also influenced by the stationary phase film thickness.
Variation in the Selectivity Factor. q Optimizing k and increasing N are not sufficient to give a satisfactory separation of two solutes in a reasonable time when a approaches unity. q A means must be sought to increase a while maintaining k in the range of 1 to 10. At least four options are available.
These options in decreasing order of their desirability as determined by potential and convenience are (1) (2) (3) (4) changing the composition of the mobile phase, changing the column temperature, changing the composition of the stationary phase, and using special chemical effects.
q An example of the use of option 1 has been reported for the separation of anisole (C 6 H 5 OCH 3) and benzene. q With a mobile phase that was a 50% mixture of water and methanol, k was 4. 5 for anisole and 4. 7 for benzene while α was only 1. 04. q Substitution of an aqueous mobile phase containing 37% tetrahydrofuran gave k values of 3. 9 and 4. 7 and α value of 1. 20. q Peak overlap was significant with the first solvent system and negligible with the second.
q A less convenient but often highly effective method for improving a while maintaining values for k in their optimal range is to alter the chemical composition of the stationary phase. q To take advantage of this option, most laboratories that frequently use chromatography maintain several columns that can be interchanged with a minimum of effort.
q Increases in temperature usually cause increases in k but have little effect on a values in liquid-liquid and liquid-solid chromatography. q In contrast, with ion-exchange chromatography, temperature effects can be large enough to make exploration of this option worthwhile before resorting to a change in column packing material.
q A final method to enhance resolution is to incorporate into the stationary phase a species that complexes or otherwise interacts with one or more components of the sample. q A well-known example occurs when an adsorbent impregnated with a silver salt is used to improve the separation of olefins. q The improvement is a result of the formation of complexes between the silver ions and unsaturated organic compounds.
The General Elution Problem q Fig. 31 -20 shows hypothetical chromatograms for a sixcomponent mixture made up of three pairs of components with widely different distribution constants and thus widely different retention factors. q In chromatogram (a), conditions have been adjusted so that the retention factors for components 1 and 2 (k 1 and k 2) are in the optimal range of 1 to 5.
Figure 31 -20 The general elution problem in chromatography. Fig. 31 -20
q The factors for the other components are far larger than the optimum, however. q Thus, the bands corresponding to components 5 and 6 appear only after an inordinate length of time has passed; q Furthermore, the bands are so broad that they may be difficult to identify unambiguously.
q Components 5 and 6 bunches the peaks for the first four components to the point where their resolution is unsatisfactory. q In this case, however, the total elution time is ideal. q The phenomenon illustrated in Figure 31 -20 is encountered often enough to be given a name: the general elution problem. q A common solution to this problem is to change conditions that determine the values of k as the separation proceeds.
q These changes can be performed in a stepwise manner or continuously. q Therefore, for the mixture shown in Fig. 31 -20, conditions at the outset could be those producing chromatogram (a). q Immediately after the elution of components 1 and 2, conditions could be changed to those that are optimal for separating components 3 and 4 (as in chromatogram c). q With the appearance of peaks for these components, the elution could be completed under the conditions used for producing chromatogram (b).
q Often such a procedure leads to satisfactory separation of all the components of a mixture in minimal time. q For liquid chromatography, variations in k are brought about by varying the composition of the mobile phase during elution. q Such a procedure is called gradient elution or solvent programming. q Elution under conditions of constant mobile-phase composition is called isocratic elution.
q For gas chromatography, the temperature can be changed in a known fashion to bring about changes in k. q This temperature-programming mode can help achieve optimal conditions for many separations.
31 E-8 Applications of Chromatography is a powerful and versatile tool for separating closely related chemical species. In addition, it can be used for the qualitative identification and quantitative determination of separated species.