3 Data visualization Infographic https www slideshare netethos


- Slides: 54
3 การนำเสนอมหลายแบบ : Data visualization / Infographic ■ https: //www. slideshare. net/ethos 3/the-secret-to-memorable-data -visualizations
4 Outline ■ ตาราง Table ■ กราฟ แผนภม ► ► ► Graph & Chart Line Bar Histogram : Epidemic Curve Pie Maps Survival curve
ตวอยาง case H 5 N 1 ของไทย Source: https: //www. cdc. gov/mmwr/PDF/wk/mm 5305. pdf 6
7 กราฟ และแผนภม ■ เปนเครองมอชวยให “เหนภาพ ” ชดขน ชวยยนยน ■ “หนงภาพแทนแสนอกษร ” ■ Estimated ตารางและภาพขางลาง ขอมลเดยวกน number of dogs in Estimated District A, Thailand, 2010 Number of dogs, District A, … 300 Dog type Unconfined owned dog Stray dog Estimated Number 200 288 100 78 0 Unconfined owned dog Stray dog Data source: Wongphruksasoong V, Santayakorn S, Sitthi W, Ardkham B, Pisek S, Srisai P, et al. Census versus capture-recapture method to estimate dog population in Lumlukka District, Phathum Thani Province, Thailand, 2010. OSIR. 2016 Mar; 9(1): 15 -20. <http: //www. osirjournal. net/issue. php? id=93>.
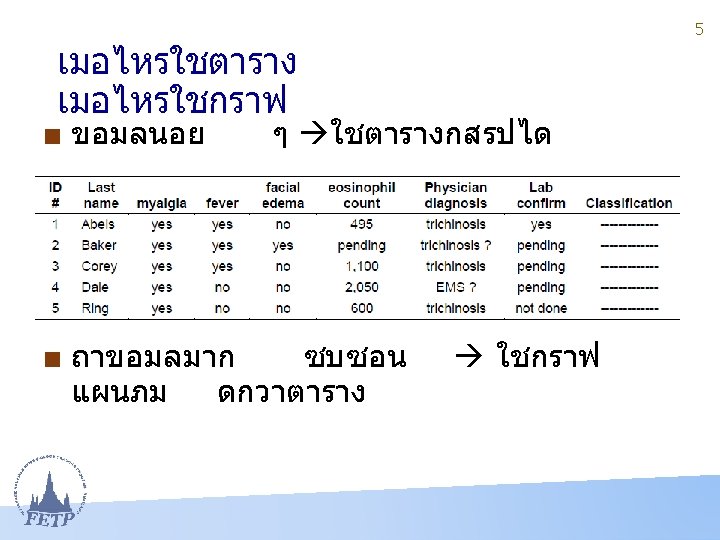
ตารางตวแปรเดยว What Table 1. Reported cases of influenza by age, Thailand, 2015 10 When Where # decimals, and alignment Source: report 506, BOE, DDC, MOPH, Thailand Sum of the column
ตารางตวแปรเดยว มรอยละสะสม cumulative% Table 2. Reported cases of influenza by age, Thailand, 2015 Source: report 506, BOE, DDC, MOPH, Thailand 11
ตารางสองตวแปร 12 Table 3. Reported cases of influenza by age and sex, Thailand, 1 Jan-18 June 2018 Variable 1 Source: report 506, BOE, DDC, MOPH, Thailand Variable 2
ตารางสองตวแปร Table 3. Dog type and vaccination coverage in urban district A, Thailand, 2010 Note: unknown history excluded 13 Row % Data source: Wongphruksasoong V, Santayakorn S, Sitthi W, Ardkham B, Pisek S, Srisai P, et al. Census versus capture-recapture method to estimate dog population in Lumlukka District, Phathum Thani Province, Thailand, 2010. OSIR. 2016 Mar; 9(1): 15 -20. <http: //www. osirjournal. net/issue. php? id=93>. ■ ตารางสามตวแปร : มความซบซอน ระมดระวงในการใช ใชไดเมอมการอธบายเพมเตม
Composite Table Vaccination with ALVAC and AIDSVAX to Prevent HIV-1 Infection in Thailand S. Rerks-Ngarm, et. al N Engl J Med 2009; 361. 15
16 Composite Table Vaccination with ALVAC and AIDSVAX to Prevent HIV-1 Infection in Thailand S. Rerks-Ngarm, et. al N Engl J Med 2009; 361.
18 Knowledge check ■ Which is correct about composite table? A. B. C. D. Good for powerpoint presentation Commonly used for journal article Line listing Use for mapping ■ In table display, which is not a common mistake? A. B. C. D. Decimal use : bad alignment, too much decimal Unclear title Inappropriate color use All of the above
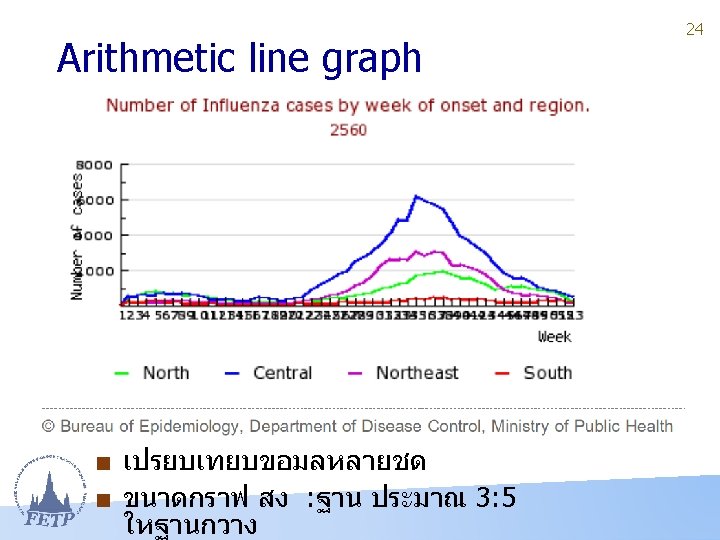
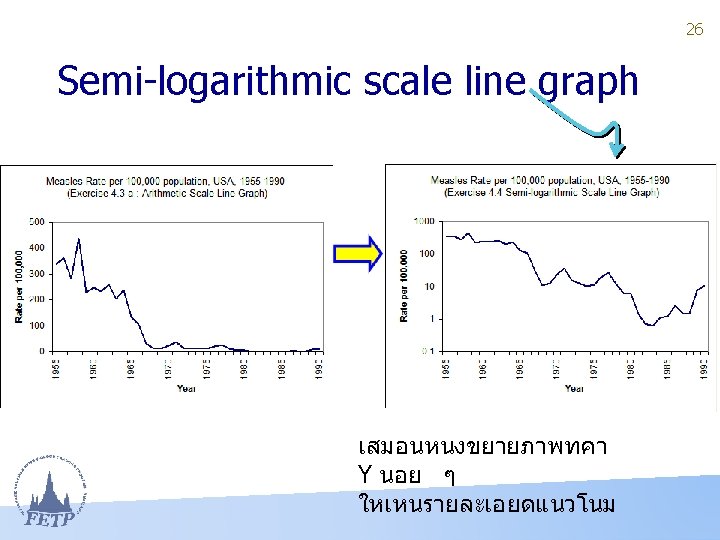
Arithmetic line graph 21
22 Encephalitis and JE incidence trend, Thailand, 1981 -2005
Encephalitis and JE incidence trend, Thailand, 1970 -2005 Incidence, cases per 100, 000 6 1 3 2 วคซน เจ อ จดทะเบยน ในประเทศไทย 5 4 ฉดวคซน เจ อ )เฉพาะพนทระบ าด( 3 booster มผปวย JE เทาไหร ในป พ. ศ. 2553 Estimated JE 2 How many JE in 2010? 1 0 1970 23 1975 1980 1985 1990 1995 2000 2005
28
29
Epidemic curve of botulism outbreak, by time and date of symptom onset* — Nan province, Thailand, March 2006 Source: https: //www. cdc. gov/mmwr/PDF/wk/mm 5514. pdf 30
31 Cumulative frequency and Survival curves ■ Find 5 -year survivals among each group ■ Number of years at 50% survival
Scatter diagrams or Scattergram Ecological data One dot = one nation 32
Bar chart Source: https: //www. cdc. gov/mmwr/PDF/wk/mm 5514. pdf 33
Please interpret this table Factors studied for association with HIV infection among female prostitutes in Chiang Mai, Thailand, August 1989 Source: modified from “Risk factors for HIV among prostitutes in Chiangmai, Thailand. ” Taweesap Siraprapasiri, et al. , AIDS 1991, 5: 59 -582 John Snow Award at EIS conference, US CDC 34
Please interpret this table Factors studied for association with HIV infection among female prostitutes in Chiang Mai, Thailand, August 1989 Source: modified from “Risk factors for HIV among prostitutes in Chiangmai, Thailand. ” Taweesap Siraprapasiri, et al. , AIDS 1991, 5: 59 -582 John Snow Award at EIS conference, US CDC 35
Grouped Bar Charts 36
Stacked Bar Charts 37
100% Component Bar Charts 38 N ■ In MS excel, changing chart format is very easy.
Combo: Bar and Line graph Compare the heights of bars and show the total in line Graph title with explanation! Source: EID Vol. 24, No. 7, July 2018 DOI: https: //doi. org/10. 3201/eid 2407. 180028 https: //wwwnc. cdc. gov/eid/article/24/7/pdfs/18 -0028. pdf 39
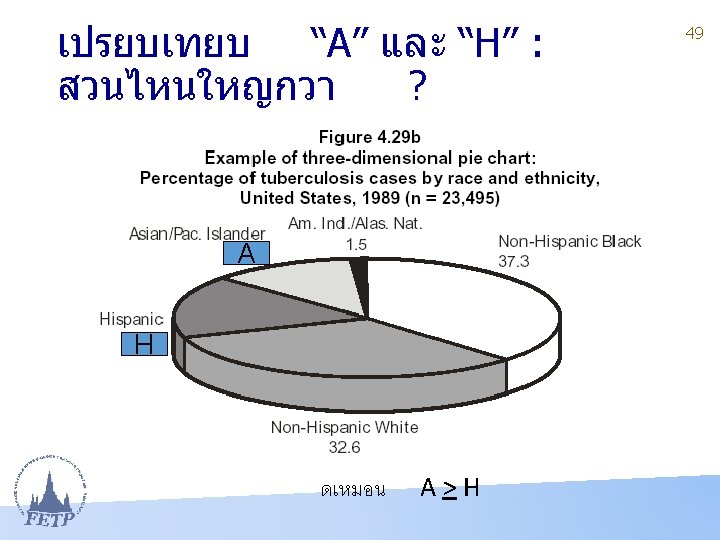
Pie Charts 40
Pie Charts Source: “From evidence into action: opportunities to protect and improve the nation’s health. ” Public health England 2014 41
42 แผนท ■ Display data by geographic area ■ Two types: spot map and area map Data demonstration Spot Map Area Map Number of cases Yes Case rate No Yes
Spot Map 43
Area Map Influenza morbidity rate Thailand, 2017 Rate /100, 000 Pop 44
Area Map : combined with charts 45 Figure 2. Suspected and confirmed diphtheria cases and deaths, by state, Venezuela, 2016– 2017. The highest number of cases occurred in the state where Amerindians reside (Bolivar, red). A) Number of suspected cases of diphtheria reported from week 28 of 2016 through week 24 of 2017, by state. B) Location of confirmed cases and deaths, Venezuela, 2017. The affected Amerindian communities reside in the area within the dotted line. Map obtained from d-maps (http: //d-maps. com/carte. php? num_car=4080&lang=es). https: //wwwnc. cdc. gov/eid/article/24/7/pdfs/17 -1712. pdf
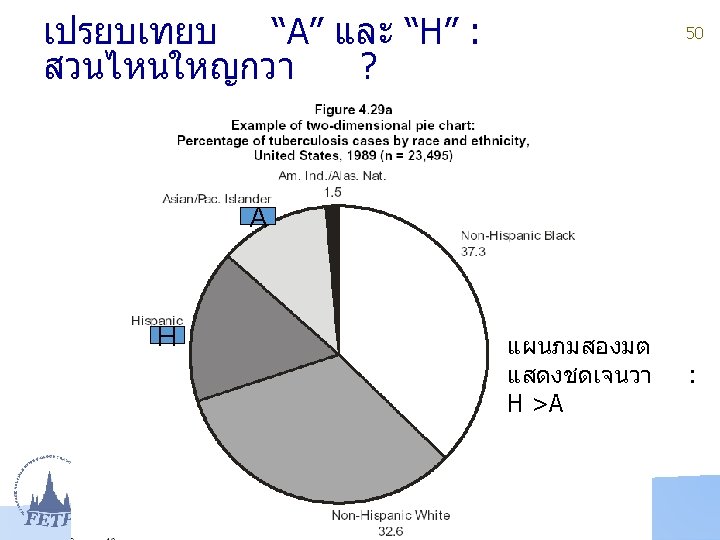
Pitfalls: 3 -Dimension 46 ■ In 1985 What is the height ratio of the white bar to the grey bar? Is it ½?
47 • Accurately interpretation in 2 -D presentation 2/3
Box Plots ■ Display the distribution of data ■ Commonly used in some statistics programs 48
Diagram : SARS 2003 in HK source : 51
52 Excel practice ■ ■ ■ Line graph Bar chart: vertical, horizontal Histogram, Epidemic curve Pie chart Etc. ■ Copy from excel -> paste special as picture**
53 Conclusion in your own words
54 Thank you Suggested reading: ■ Lesson Four: Displaying Public Health Data ■ Outbreak investigation and surveillance report ► www. osirjournal. net ► www. cdc. gov/mmwr ■ https: //www. cdc. gov/mmwr/PDF/wk/mm 4821. pdf ■ https: //www. cdc. gov/mmwr/PDF/wk/mm 5514. pdf