3 D Visualization of Cataclysmic Variables with Interactive
 by: Deidrick Capers")
3 -D Visualization of Cataclysmic Variables with Interactive Data Language(IDL) by: Deidrick Capers

What is a Cataclysmic Variable? Class of binary star systems l Contains white dwarf and red dwarf l White dwarf has powerful gravitational and electromagnetic fields l Accretion disc/stream between stars l Polars l

CV with Accretion Disc
")
Magnetic CV (Polar)

Visualization 101: 2 -D Before 3 -D Fortran program determines position, velocity, and density of particles l 30, 000 particles total l Bash shell scripts for extraction of relevant particles l Direct graphics programs: x-axis vs. y-axis, x-axis vs. z-axis l 2 -D scatter plot as series of colored points l

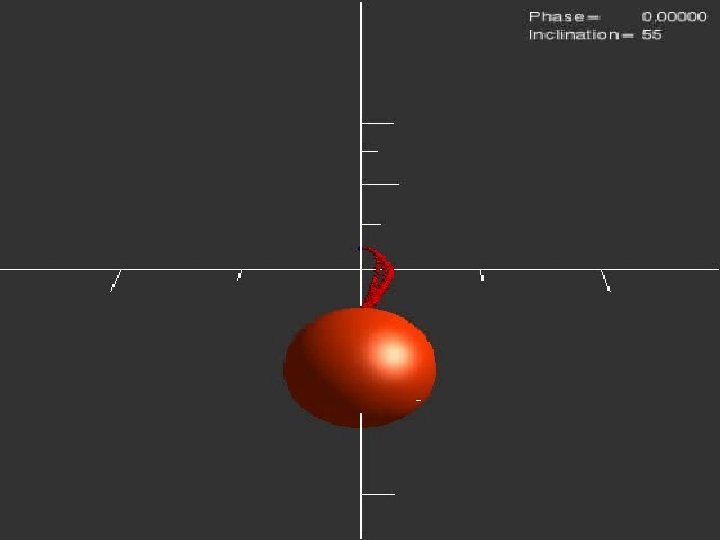
Visualization 102: Survival of the Fittest l l l 2 -D plots become part of 3 -D model program Orbs used to represent positions of particles Stream and stars are placed on grid

What is IDL? l l l Interactive Data Language Powerful visualization tool Used by medical industry

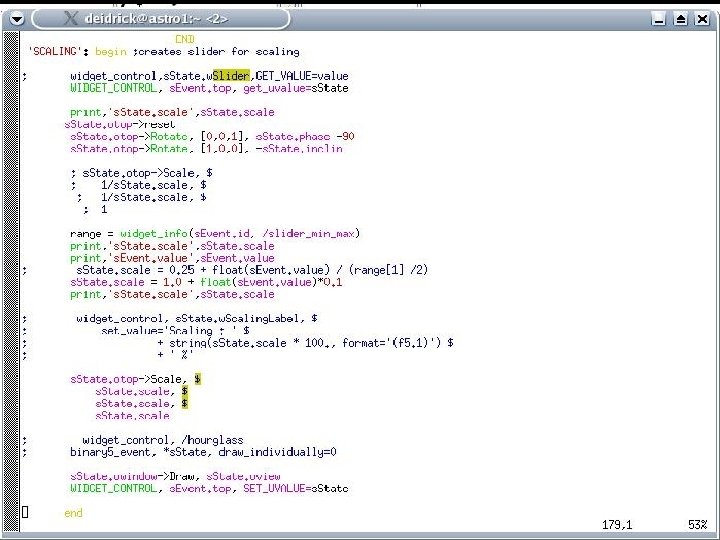
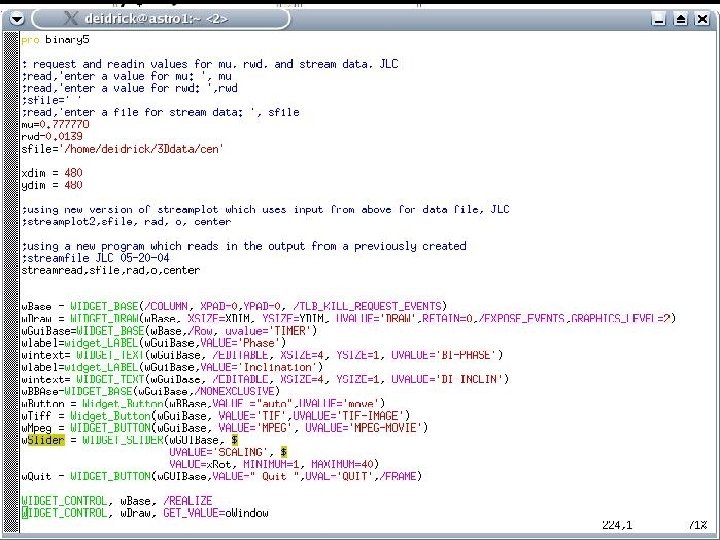
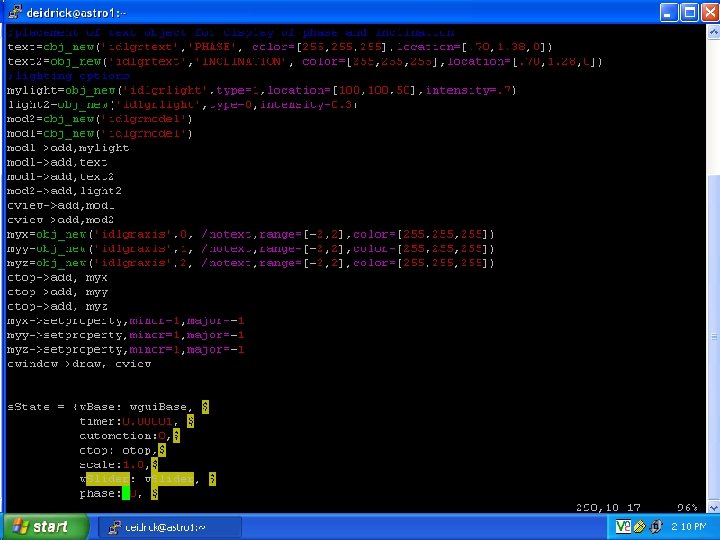
IDL Program Code 2 part program/object-oriented l Part 1 defines events: mouse clicks, sliders, scroll bars etc. l Part 2 specifies actual window structure: placement of labels, buttons, lists/names l Objects- red/white dwarf, surface polygons l Physical objects- light/text/axis objects l

Program Features l l l Phase adjustment Inclination adjustment Zoom feature Transfer of snapshot to TIF MPEG generator Automotion

Future Work l l Exporting of program to non-IDL machines Increase of detail in CV depiction

Acknowledgements South Carolina State University l Dr. Cash l Dr. Walter l NASA URIA l

THE END
- Slides: 16