3 D Mapping of Ocean Water Masses and
")
 Matthew Oliver (U. Del.")


 FLAGS No. of profiles Downloaded")


- Slides: 20
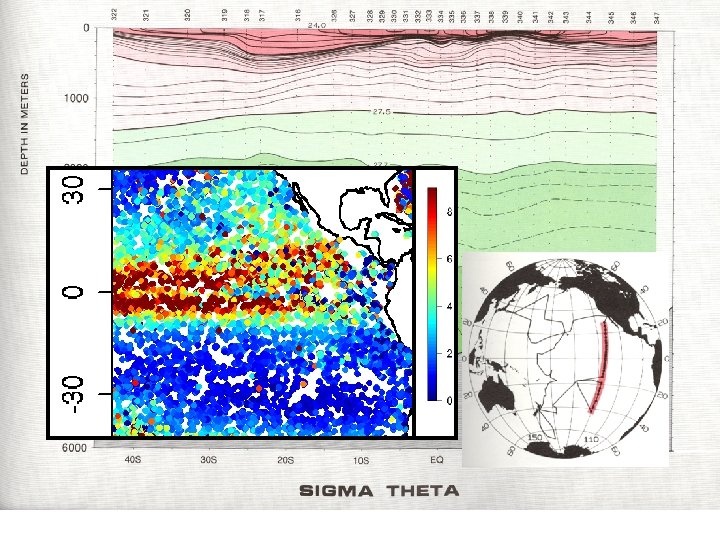
3 -D Mapping of Ocean Water Masses and Provinces Matthew Oliver (U. Del. ) Matthew Grossi (U. Del) Erick Geiger (U. Del) Argo Profile Distribution Province Distribution
Mapping Dynamic Ocean Biogeographic Provinces Andrew Irwin (Mt. Allison University) Matthew Oliver (U. Del. ) Oscar Schofield (Rutgers) Paul Falkowski (Rutgers) Thursday 12: 15 pm
Typical Argo Profile
Reflections on the European Pine Sawfly Holling, C. S. 1959. The components of predation as revealed by a study of small mammal predation of the European pine sawfly. Canad. Entomol. 91: 293 -320. Holling, C. S. 1959. Some characteristics of simple types of predation and parasitism. Canad. Entomol. 91: 385 -398. Prey switching curve
Reflections on the European Pine Sawfly Holling, C. S. 1959. The components of predation as revealed by a study of small mammal predation of the European pine sawfly. Canad. Entomol. 91: 293 -320. Holling, C. S. 1959. Some characteristics of simple types of predation and parasitism. Canad. Entomol. 91: 385 -398. No. of Prey Killed by One Predator 12 A=10 10 8 6 A/2 4 2 0 0 20 40 60 B=15 Prey Density 80 100 120
Reflections on the European Pine Sawfly No. of Prey Killed by One Predator 0 5 10 15 0 40 60 80 100 120 A=10 A/2 B=15 Prey Density 20
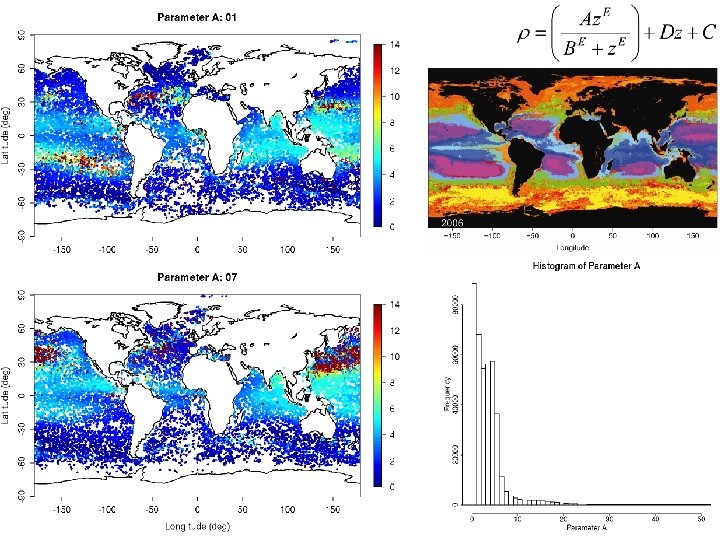
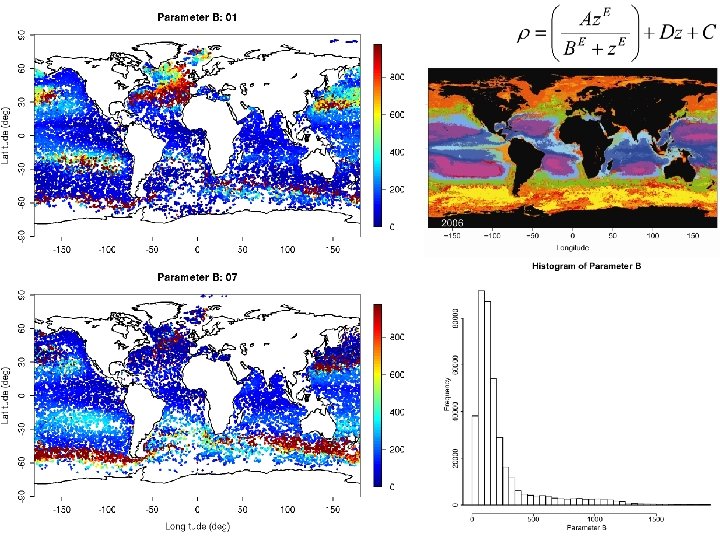
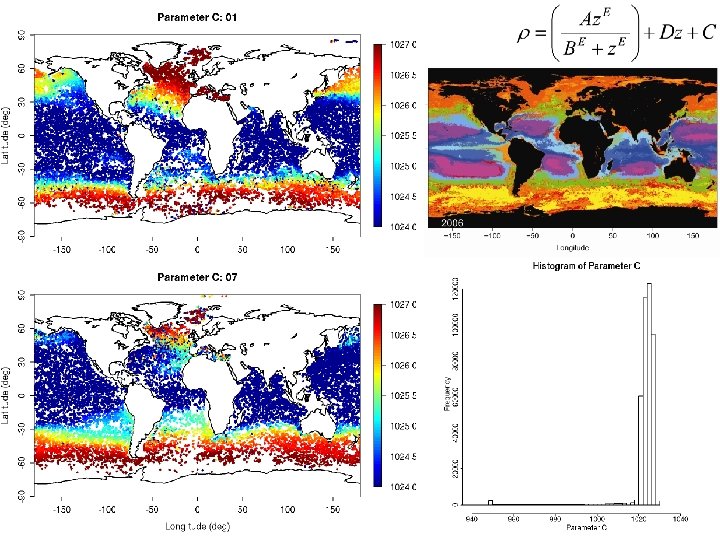
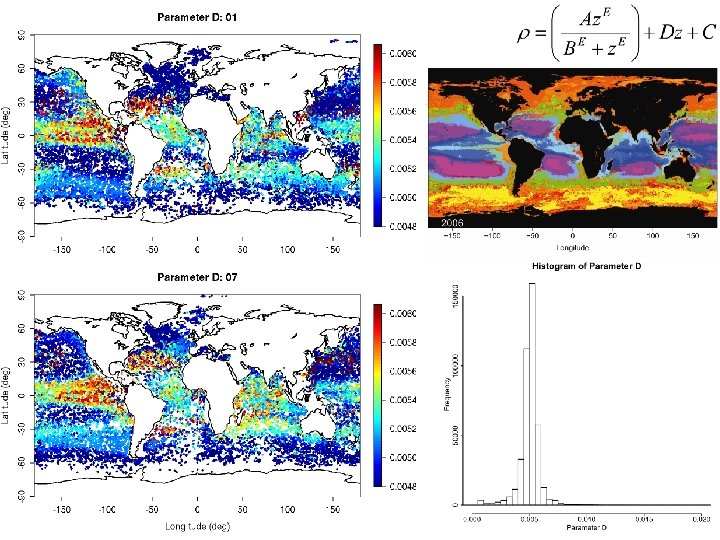
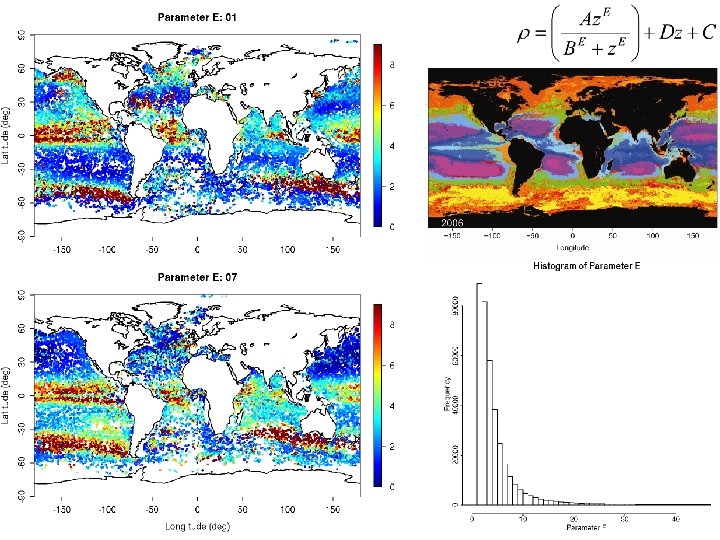
Modified Holling III Curve All Models are wrong, some are useful – G. Box A=0. 08 B=143 C=1027 D=0. 005 E=15. 7 E A=4. 1 B=147 C=1022 D=0. 005 E=11. 3 D A=7. 3 B=137 C=1021 D=0. 004 E=1. 04 C
Argo Analysis ARGO DATA ASSESSMENT USING QUALITY CONTROL (QC) FLAGS No. of profiles Downloaded 500253 Missing variables 2000 Failed QC 82962 Profile <10 m 920 Total analyzed: 414371 Remaining 498253 415291 414371
A
B
C
D
E
Future Work on minimizing the number of parameters to fit a curve Moving analysis beyond density and into temperature and salinity Moving analysis into coastal ocean Matching with Water Masses and Biomes