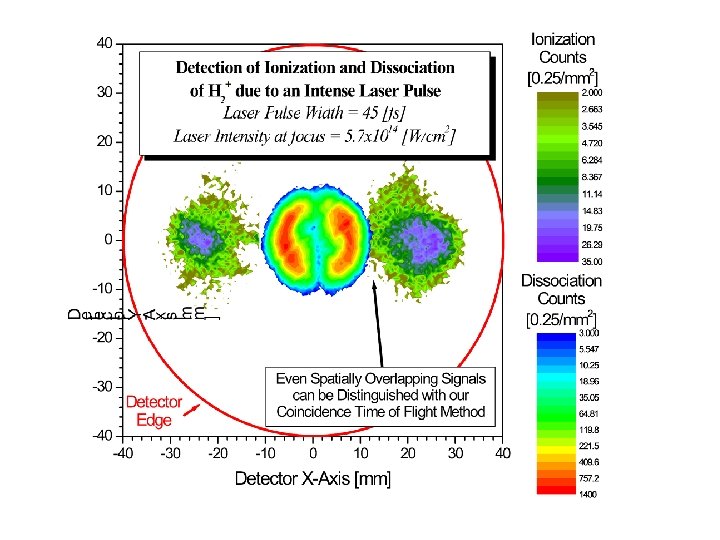
3 D Imaging of the Ionization and Dissociation


 Laser focus VS (x")


![Nitrogen data • Difficult to dissociate – Detection rate < 1 Hz – [O+O+]:](https://slidetodoc.com/presentation_image_h2/b705334bd8eda3b468d3c21315f208cd/image-13.jpg "Nitrogen data • Difficult to dissociate – Detection rate < 1 Hz – [O+O+]:")


 1 -3 photon")


")

 FIG. 8. Total number of photofragments registered by the")
: – 14 fs (H 2+), 18")
- Slides: 26
3 -D Imaging of the Ionization and Dissociation of O 2+ and N 2+ in an ‘Intense’ ‘Short’ Laser Pulse A. Max Sayler, Pengqian Wang, Mark A. Smith, Jingfan Xia, Kevin D. Carnes, and Itzik Ben-Itzhak* J. R. Macdonald Laboratory Supported by the Chemical Sciences, Geosciences and Biosciences Division, Office of Basic Energy Sciences, Office of Science, U. S. Department of Energy. Thanks to: Brett Esry for providing conceptual help with theoretical predictions The KLS for providing the fs laser. (Bing Shan & Zenghu Chang) Charles Fehrenbach for help with the ECR.
Introduction • Ionization Suppression • Directly Measure Dissociation • Work by others – H 2+ • Williams et al. : 1 st to measure dissociation • Sändig et al. : 2 D dissociation experiment • Paviĉić et al. : 2 D diss. and ion. experiment (HD+) – Other Molecules • Assion et al. (Na 2+): I ≤ 1× 10¹⁴, 80 fs • Wunderlich et al. (Ar 2+): Tunneling (I ≤ 5× 10¹² )
Goals • Experimentally determine the effect of short intense laser pulses on molecular ions – Test abundance of existing theory for H 2+ – Probe behavior of more complex (more interesting) molecules • N 2 + , O 2 + – Span the nonlinear region of laser intensities Outside Available Intensity Range – Span a region in laser pulse width (from Floquet limit to sub vibrational time scale) • Experimentally Available Area Below Available Width Range
Experimental Setup Spectrometer O+ O 2+ Beam (8 ke. V) Laser focus VS (x 1, y 1, t 1) Faraday Cup O (x 2, y 2, t 2) Delay Line Detector
Experimental Setup Advantages • • Detection of all fragments in coincidence 3 D momentum imaging Separation of ions from atoms (i. e. ionization from dissociation) Simultaneous measurement of ionization and dissociation Disadvantages & problems • Ionization – resolving X+ from the other X+ in time (data reconstruction) • No neutral targets • Background peaks in the O 2+ and N 2+ data (ECR limit)
Collecting Needles Typical N 2+ Data • Collecting true 3 D information allows extreme data cleaning • Momentum must be conserved 1 st Particle 2 nd Particle
Position Signal Electronics Problems However, Ionization is Seen Dissociation Rate ~ 10 Hz Ionization O 2 + Dissociation ~ 8% I = 3. 6 x 10¹⁴ W/cm/cm w = 72 fs
H 2+ Data • ‘Easy’ for theorists • A full presentation by Pengqian later I = 1. 3 x 10¹⁴ W/cm 2 w = 135 fs • Weak Field / Long Pulse Limit • Peaked along laser polarization
Floquet Picture BH BS • Deciphering the Jargon ATD – – – Bond Hardening Bond Softening Above Threshold Diss. Coupling Non-adiabatic-coupling • CW laser approximation – How short is short? • Perturbative approximation – How weak is weak? Kulander et al. PRA 53, 2562 (1996)
N 2+ Got Nitrogen? ? ? O 2+
• • Binding Energy Vibrational Population Dissociative State Crossings Interesting Structure
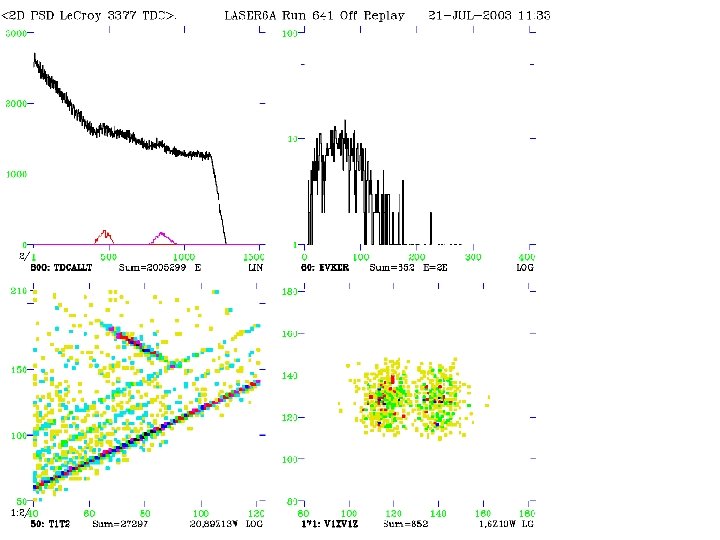
Nitrogen data • Difficult to dissociate – Detection rate < 1 Hz – [O+O+]: [N+N+]= 25: 1 • I ~ 1014 W/cm 2 • Structure (Low Stats. ) – A Single broad KER peak – Peaked along polarization (within error)
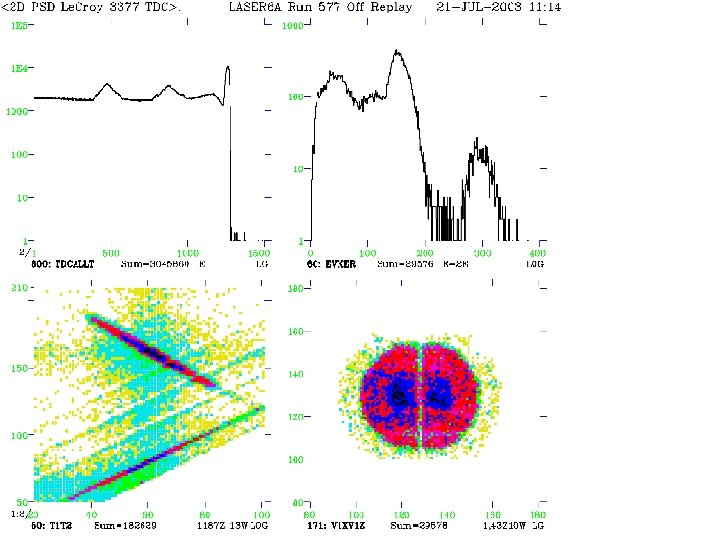
Oxygen data • 4+ Large Scale Distributions • Multi-photon dissociation Relative Yield of Peaks: A = 40% B = 16% C = 35% D = 6% • 2 Sets of Angular Distributions? Width ~ 50 fs I ~ 1014 W/cm 2
Angular Distributions
Angular Distributions
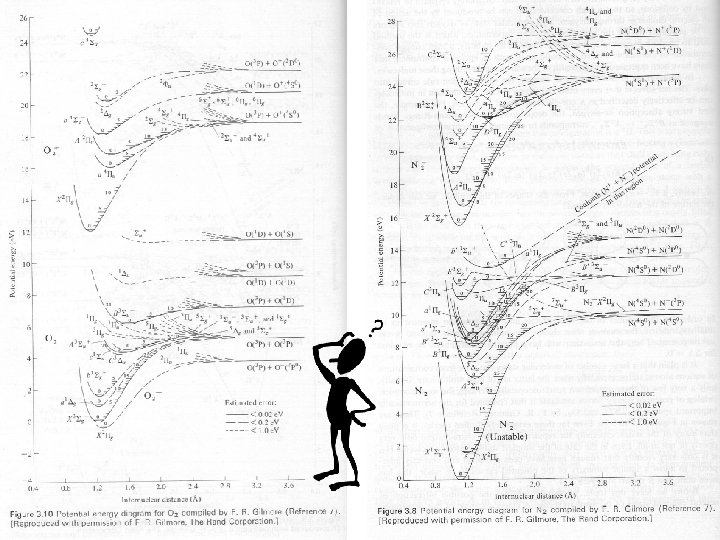
O 2+ ‘Floquet’ Curves 1 photon Beebe et al. JCP (1975) 1 -3 photon
Near Future Plans • Measurements – Dissociation : Ionization – Laser Intensity and width dependences • Calculations – Franck-Condon – Experimental quality ‘Floquet’ • Improve measurements – Higher statistics – Focused laser spatial Intensity
Near Future Plans • Measurements – Dissociation : Ionization – Laser Intensity and width dependences • Calculations – Franck-Condon – Experimental quality ‘Floquet’ Far Future Plans • Utilize KLS advances – Shorter pulses – Higher Intensity – Frequency dependence • Theory – Calculate Dissociation and Ionization Rates as a function of (KER, θ, I, w, λ, …) – Test interesting predictions • Improve measurements – Higher statistics – Focused laser spatial Intensity • Neutral molecular beam? – Dissociation – Vibrational and Rotational dist.
Previous experimental work 2 D imaging experiment, Sändig et al. PRL 85, 4876 (2000) E H 2 +(v) H E H 2 + hν Schematic setup • Dissociation channel only • Dissociation along E • High energy resolution H+
Recent 2 D imaging work Clearly structured fragment kinetic energy spectra discovered in the Coulomb explosion of H 2+ and D 2+ Paviĉić et al. Eur. Phys. J. D 26, 3941 (2003) 0. 6× 10¹⁴ W/cm 2 1. 0× 1014 W/cm 2 The momentum distribution of the H+ fragments as projected onto the multi-channel plate detector (I = 1× 10¹⁵ W/cm 2). One photon and two photons in the first step followed by CREI. In order to match the spectrum, both were shifted by 1. 07 e. V, i. e. 1/RC, where RC=12 a. u. H 2+
Wunderlich et al. (Ar 2+) FIG. 8. Total number of photofragments registered by the MCP detector ~integrated over angle and energy, averaged over 15 000 laser pulses per data point, indicated by circles! and the secondary electron multiplier ~triangles! after irradiating Ar 21 with laser light at 532 nm. The rovibrational population of the molecules is Boltzmann distributed at k. T 50. 068 e. V. The solid line shows the result of a numerical simulation of the experiment using light-induced potentials to calculate dissociation rates of Ar 2 1. The dashed line is the result of a simulation using Fermi’s golden rule. FIG. 4. Number of dissociated Ar 2 1 molecules as a function of laser intensity. Solid lines show results of computational simulations using light-induced potential curves; dashed lines stand for Fermi’s golden rule. All parameters of the simulation were determined experimentally. (a) Thermal population distribution in the Ar 2 1 beam. LIP anf FGR yield indistinguishable predictions. Each data point represents the average of 8000 to 20 000 laser shots (535 nm). (b) Low vibrational levels only are populated. LIP predict the correct result: more photofragments due to tunneling through the barrier of E 1. The radius of the molecular beam is reduced from 0. 7 to 0. 3 mm as compared to (a), averaged over 16 000 shots (532 nm).
Order of magnitude • Nuclear vibration period (v=0): – 14 fs (H 2+), 18 fs (O 2+), 15 fs (N 2+) • Binding Energy: 3 e. V (H 2+), 6 e. V (O 2+), 8 e. V (N 2+) • Nuclear rotation period: 500 fs (H 2+) • Electronic ‘rotational period’: 0. 1 fs • Mean* laser wavelength: 790 nm • Laser oscillation period: 2. 635 fs • Minimum laser pulse width: 10 fs • Maximum laser intensity: 4 x 10¹⁵ • Intensity: 3. 51 x 1016 W/cm 2 = 1 a. u. • • f = 20 cm Rr = 5 mm Spot Dia. = 70 µm Detector rad. = 40 mm L = 700 mm V = 950 V d. T = 0. 5 ns Dx = 0. 25 mm