
3 Causal Models Part III DAGs and new

- Slides: 66
3 Causal Models Part III: DAGs and new approaches to bias Matthew Fox Advanced Epidemiology
Discussion: How do we decide what are potential candidates for an adjusted model?
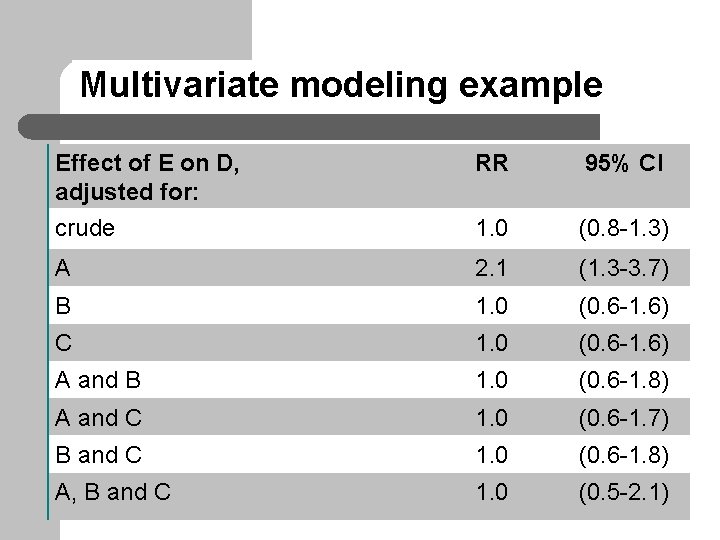
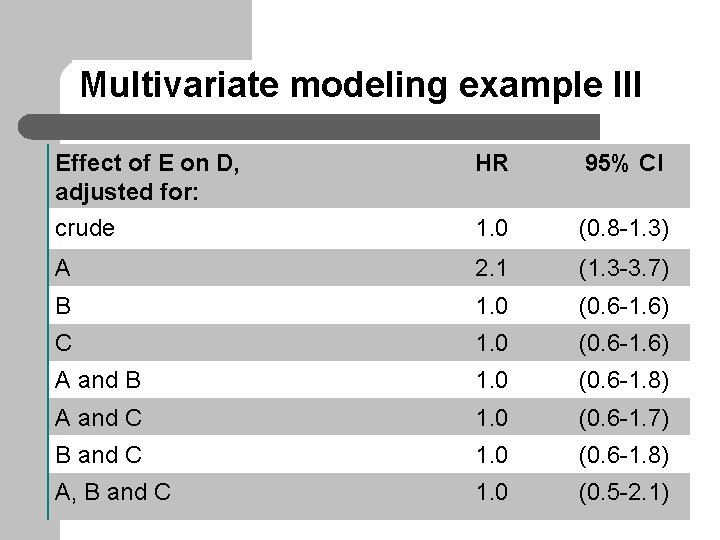
Multivariate modeling example Effect of E on D, adjusted for: crude RR 95% CI 1. 0 (0. 8 -1. 3) A 2. 1 (1. 3 -3. 7) B 1. 0 (0. 6 -1. 6) C 1. 0 (0. 6 -1. 6) A and B 1. 0 (0. 6 -1. 8) A and C 1. 0 (0. 6 -1. 7) B and C 1. 0 (0. 6 -1. 8) A, B and C 1. 0 (0. 5 -2. 1)
Discussion: If a variable is not a confounder is it reasonable to include it in a model to see its effect on the outcome as well?
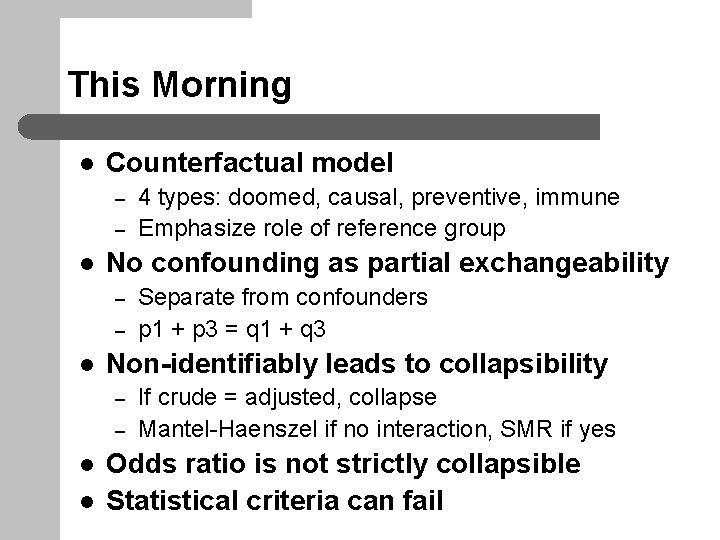
This Morning l Counterfactual model – – l No confounding as partial exchangeability – – l Separate from confounders p 1 + p 3 = q 1 + q 3 Non-identifiably leads to collapsibility – l 4 types: doomed, causal, preventive, immune Emphasize role of reference group If crude = adjusted, collapse Mantel-Haenszel if no interaction, SMR if yes Odds ratio is not strictly collapsible Statistical criteria can fail
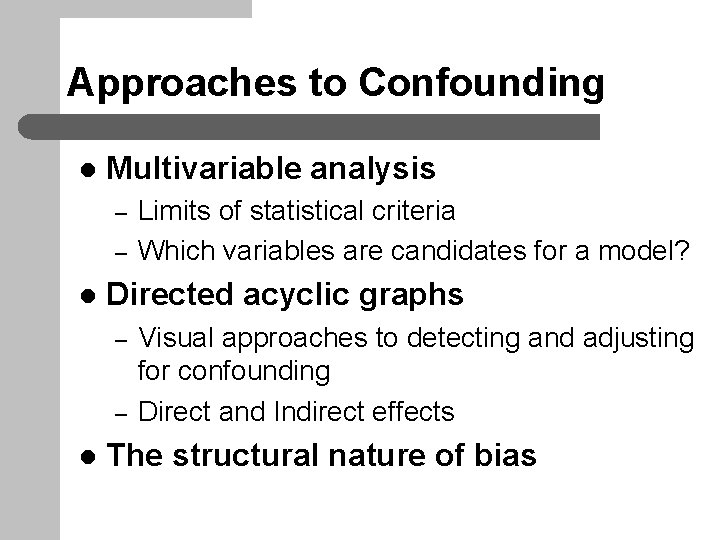
Approaches to Confounding l Multivariable analysis – – l Directed acyclic graphs – – l Limits of statistical criteria Which variables are candidates for a model? Visual approaches to detecting and adjusting for confounding Direct and Indirect effects The structural nature of bias
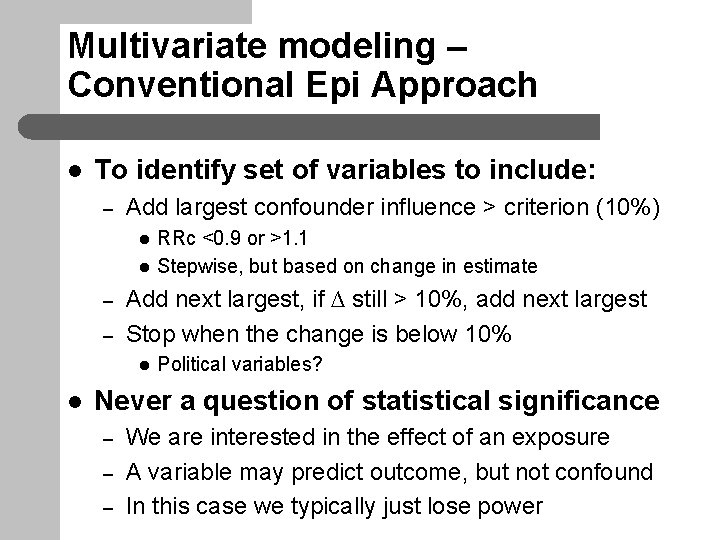
Multivariate modeling – Conventional Epi Approach l To identify set of variables to include: – Add largest confounder influence > criterion (10%) l l – – Add next largest, if ∆ still > 10%, add next largest Stop when the change is below 10% l l RRc <0. 9 or >1. 1 Stepwise, but based on change in estimate Political variables? Never a question of statistical significance – – – We are interested in the effect of an exposure A variable may predict outcome, but not confound In this case we typically just lose power
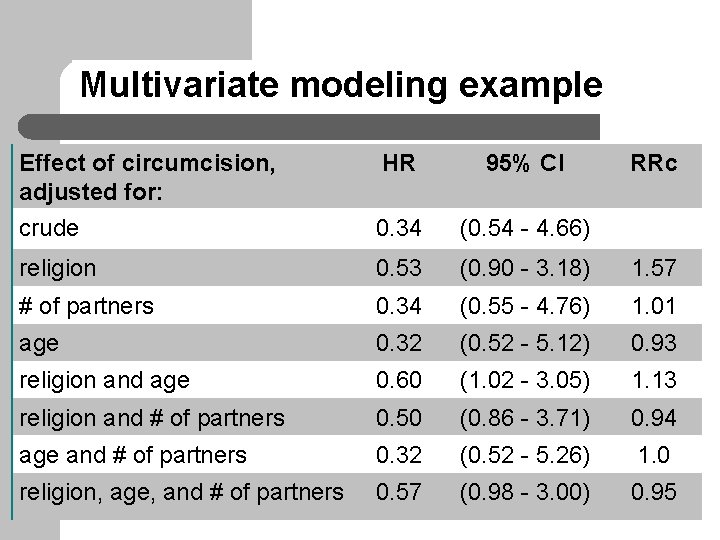
Multivariate modeling example Effect of circumcision, adjusted for: crude HR 95% CI RRc 0. 34 (0. 54 - 4. 66) religion 0. 53 (0. 90 - 3. 18) 1. 57 # of partners 0. 34 (0. 55 - 4. 76) 1. 01 age 0. 32 (0. 52 - 5. 12) 0. 93 religion and age 0. 60 (1. 02 - 3. 05) 1. 13 religion and # of partners 0. 50 (0. 86 - 3. 71) 0. 94 age and # of partners 0. 32 (0. 52 - 5. 26) 1. 0 religion, age, and # of partners 0. 57 (0. 98 - 3. 00) 0. 95
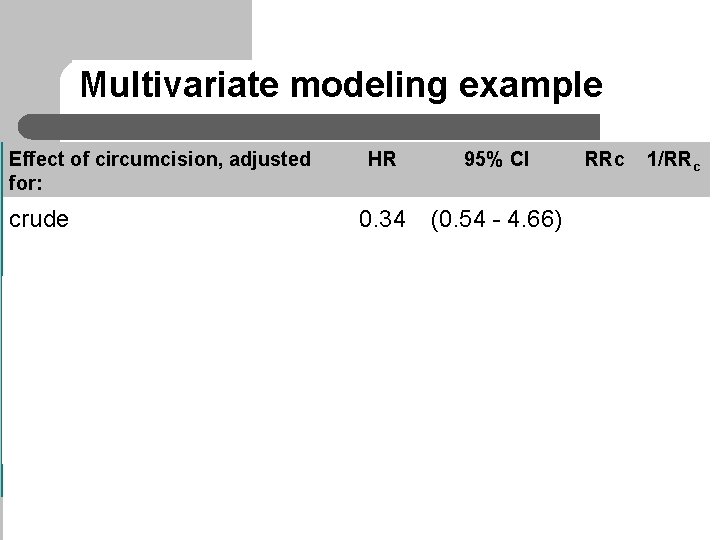
Multivariate modeling example Effect of circumcision, adjusted for: HR 95% CI RRc 1/RRc crude 0. 34 (0. 54 - 4. 66) religion 0. 53 (0. 90 - 3. 18) 0. 64 1. 57 # of partners 0. 34 (0. 55 - 4. 76) 0. 99 1. 01 age 0. 32 (0. 52 - 5. 12) 1. 08 0. 93 religion and age 0. 60 (1. 02 - 3. 05) 0. 88 1. 13 religion and # of partners 0. 50 (0. 86 - 3. 71) 1. 06 0. 94 age and # of partners religion, age, and # of partners 0. 32 0. 57 (0. 52 - 5. 26) 1. 00 (0. 98 - 3. 00) 1. 05 0. 95
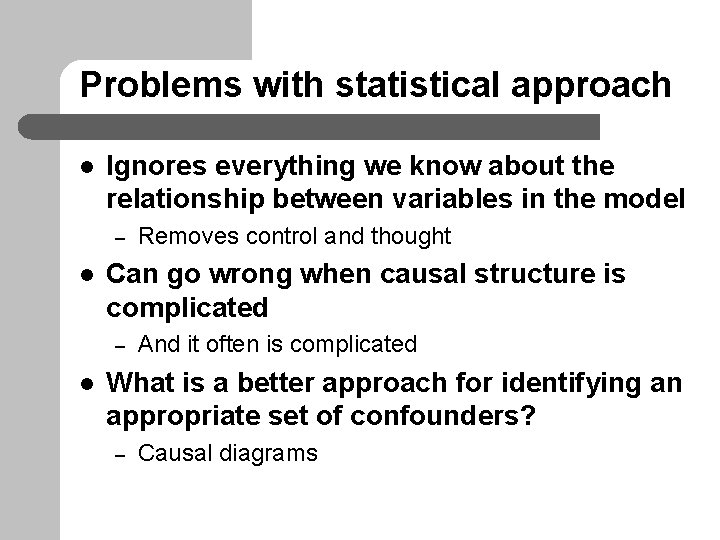
Problems with statistical approach l Ignores everything we know about the relationship between variables in the model – l Can go wrong when causal structure is complicated – l Removes control and thought And it often is complicated What is a better approach for identifying an appropriate set of confounders? – Causal diagrams
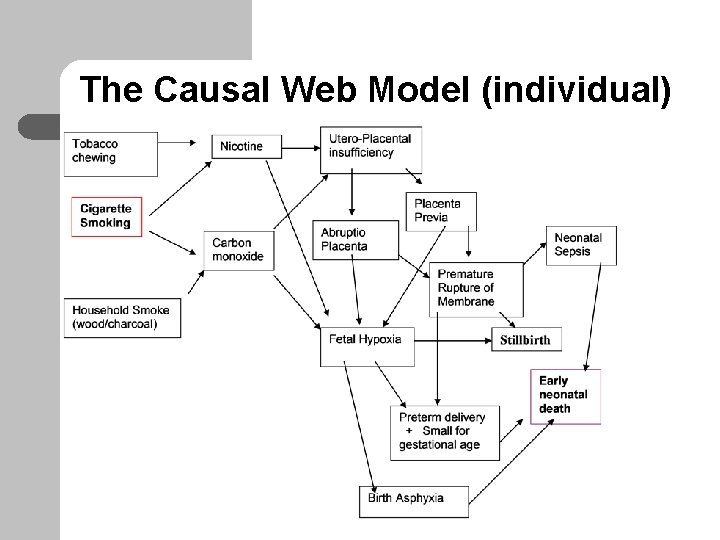
The Causal Web Model (individual)
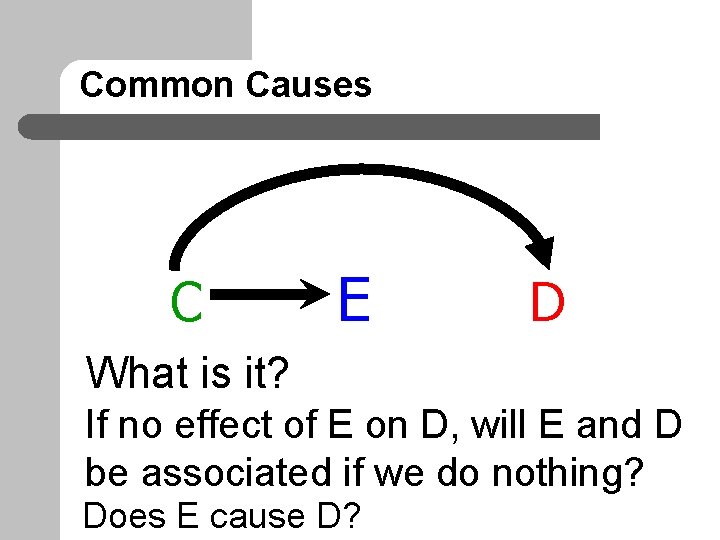
Common Causes C E D What is it? If no effect of E on D, will E and D be associated if we do nothing? Does E cause D?
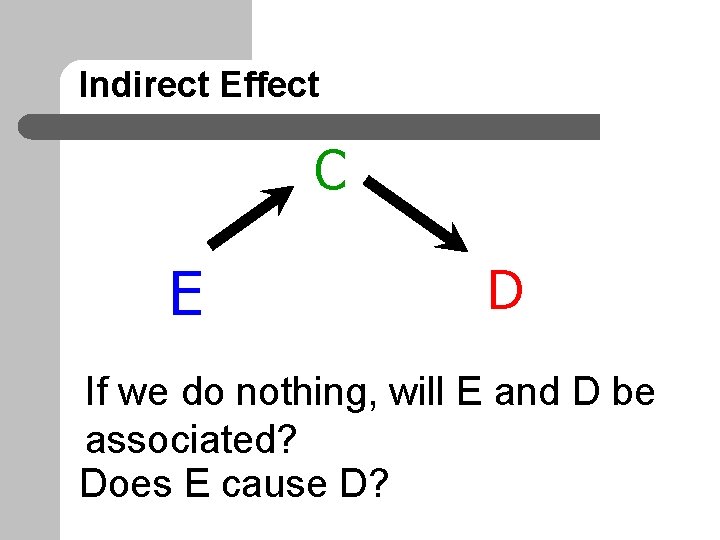
Indirect Effect C E D If we do nothing, will E and D be associated? Does E cause D?
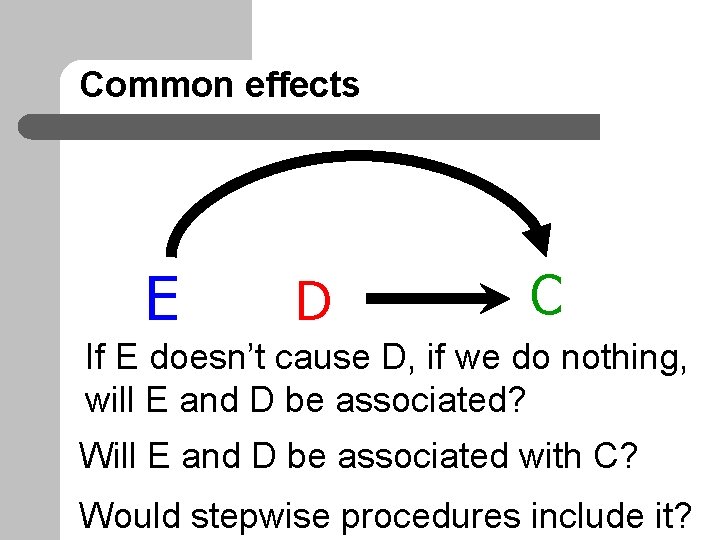
Common effects E D C If E doesn’t cause D, if we do nothing, will E and D be associated? Will E and D be associated with C? Would stepwise procedures include it?
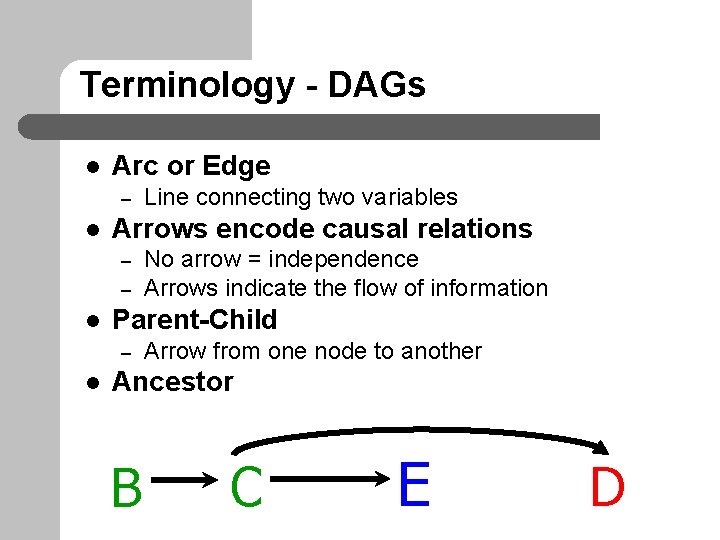
Terminology - DAGs l Arc or Edge – l Arrows encode causal relations – – l No arrow = independence Arrows indicate the flow of information Parent-Child – l Line connecting two variables Arrow from one node to another Ancestor B C E D
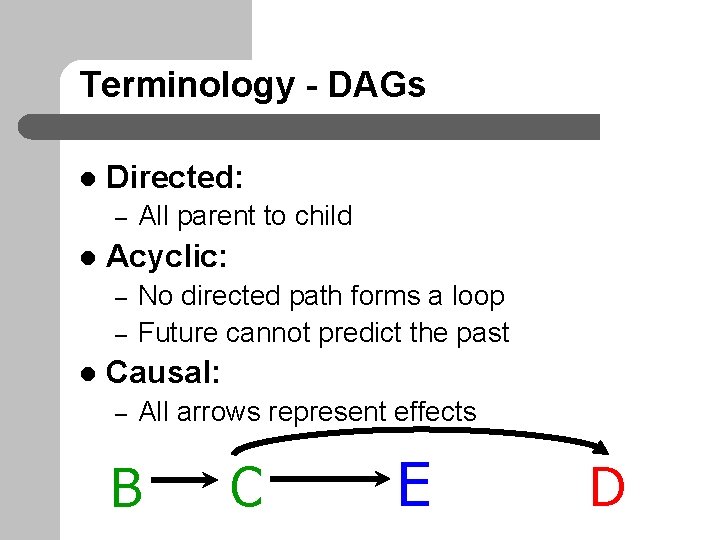
Terminology - DAGs l Directed: – l Acyclic: – – l All parent to child No directed path forms a loop Future cannot predict the past Causal: – All arrows represent effects B C E D
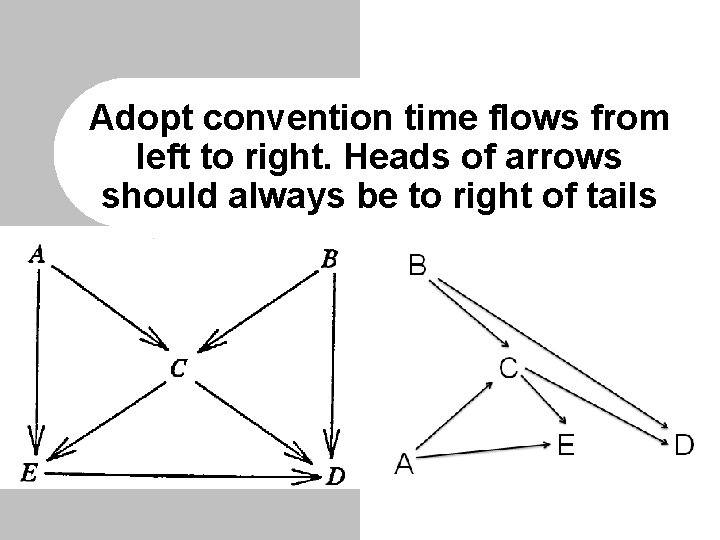
Adopt convention time flows from left to right. Heads of arrows should always be to right of tails
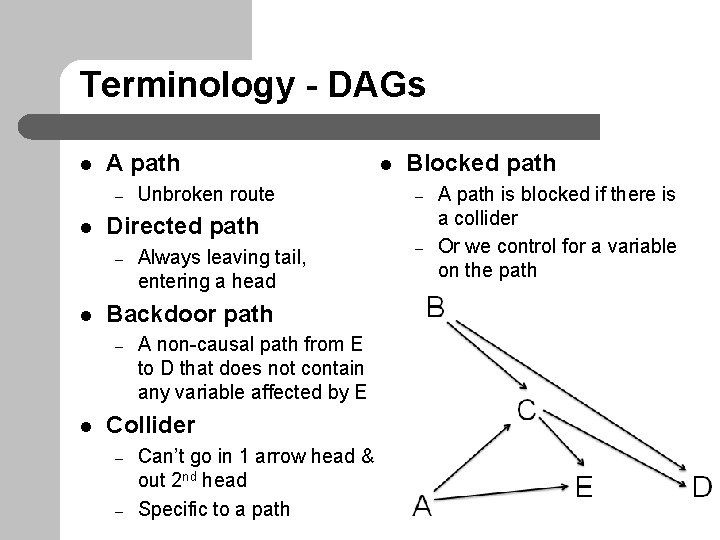
Terminology - DAGs l A path – l Always leaving tail, entering a head Backdoor path – l Blocked path – Directed path – l Unbroken route l A non-causal path from E to D that does not contain any variable affected by E Collider – – Can’t go in 1 arrow head & out 2 nd head Specific to a path – A path is blocked if there is a collider Or we control for a variable on the path
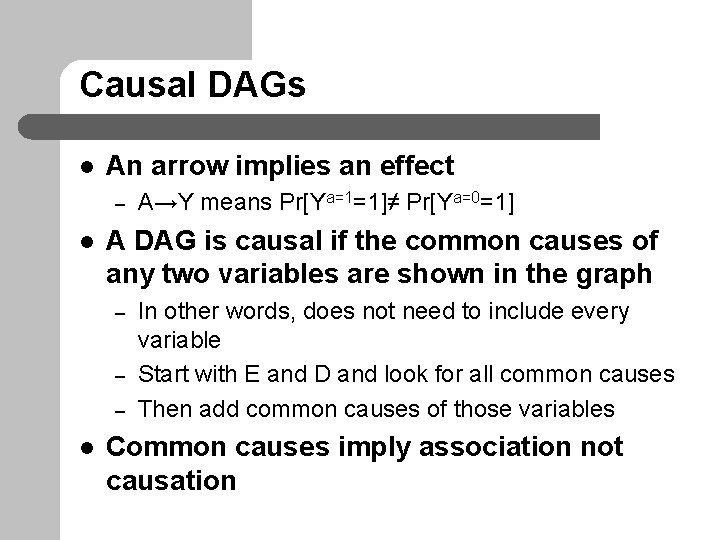
Causal DAGs l An arrow implies an effect – l A DAG is causal if the common causes of any two variables are shown in the graph – – – l A→Y means Pr[Ya=1=1]≠ Pr[Ya=0=1] In other words, does not need to include every variable Start with E and D and look for all common causes Then add common causes of those variables Common causes imply association not causation
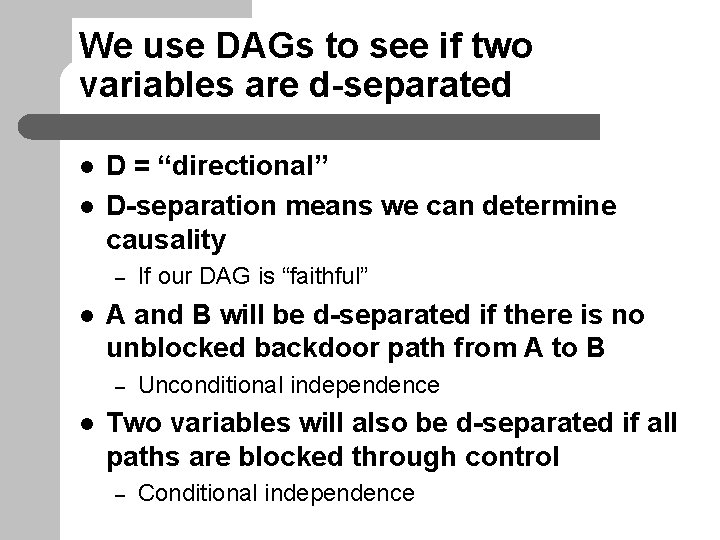
We use DAGs to see if two variables are d-separated l l D = “directional” D-separation means we can determine causality – l A and B will be d-separated if there is no unblocked backdoor path from A to B – l If our DAG is “faithful” Unconditional independence Two variables will also be d-separated if all paths are blocked through control – Conditional independence
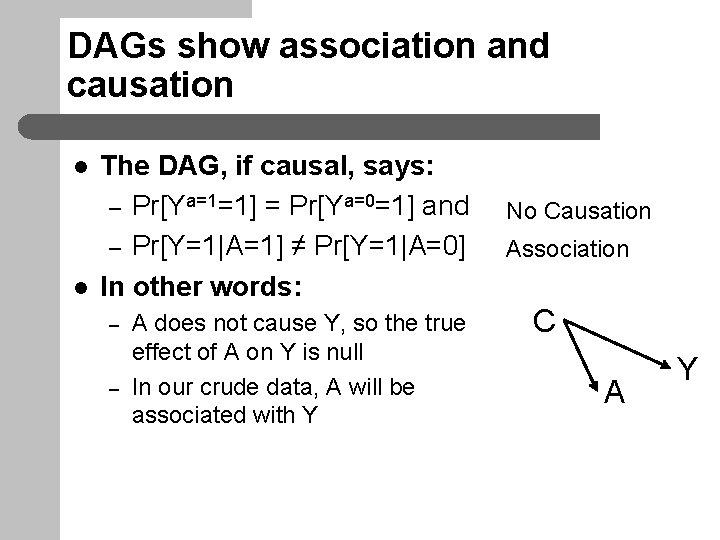
DAGs show association and causation l l The DAG, if causal, says: – Pr[Ya=1=1] = Pr[Ya=0=1] and – Pr[Y=1|A=1] ≠ Pr[Y=1|A=0] In other words: – – A does not cause Y, so the true effect of A on Y is null In our crude data, A will be associated with Y No Causation Association C A Y
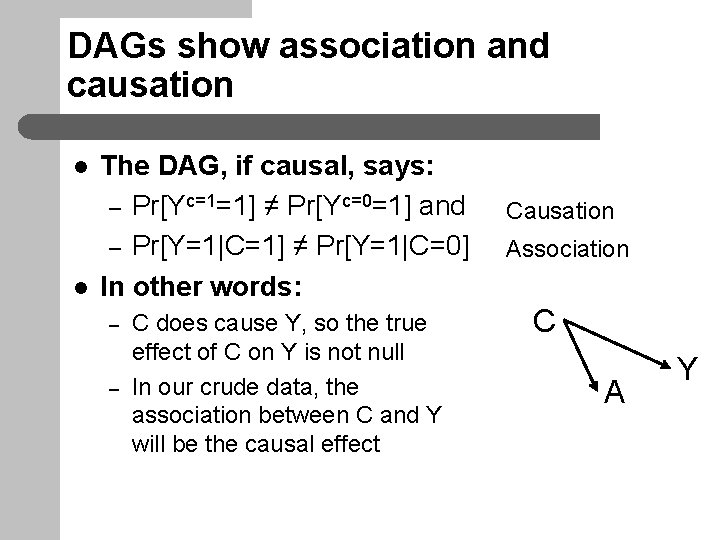
DAGs show association and causation l l The DAG, if causal, says: – Pr[Yc=1=1] ≠ Pr[Yc=0=1] and – Pr[Y=1|C=1] ≠ Pr[Y=1|C=0] In other words: – – C does cause Y, so the true effect of C on Y is not null In our crude data, the association between C and Y will be the causal effect Causation Association C A Y
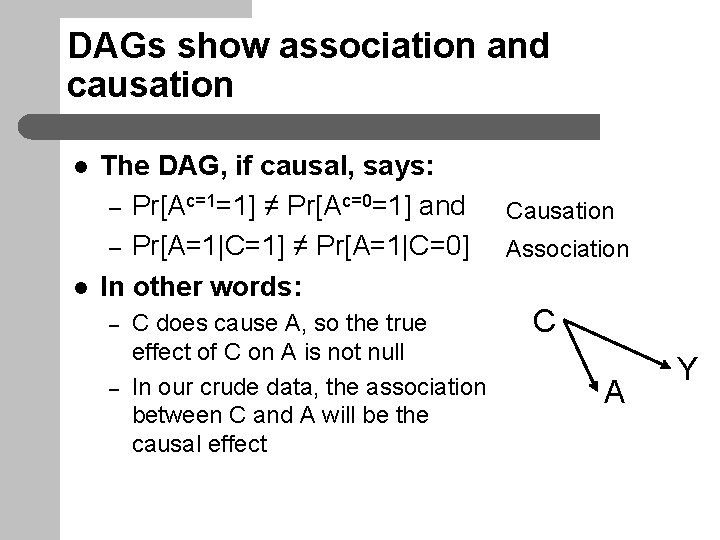
DAGs show association and causation l l The DAG, if causal, says: – Pr[Ac=1=1] ≠ Pr[Ac=0=1] and – Pr[A=1|C=1] ≠ Pr[A=1|C=0] In other words: – – C does cause A, so the true effect of C on A is not null In our crude data, the association between C and A will be the causal effect Causation Association C A Y
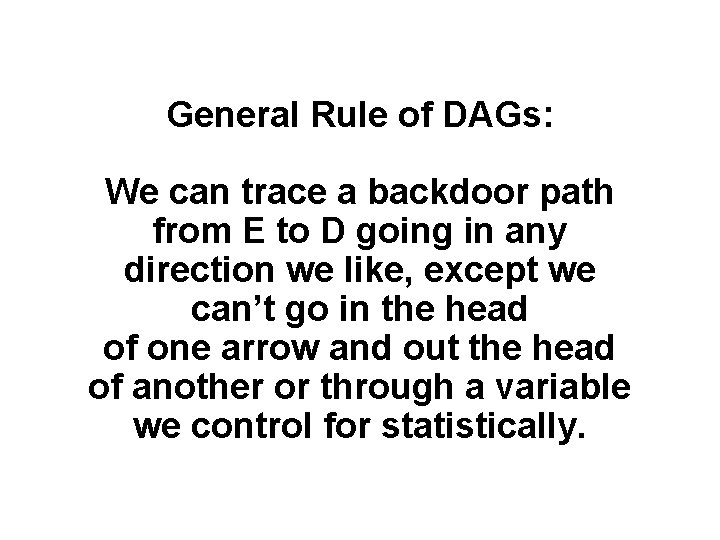
General Rule of DAGs: We can trace a backdoor path from E to D going in any direction we like, except we can’t go in the head of one arrow and out the head of another or through a variable we control for statistically.
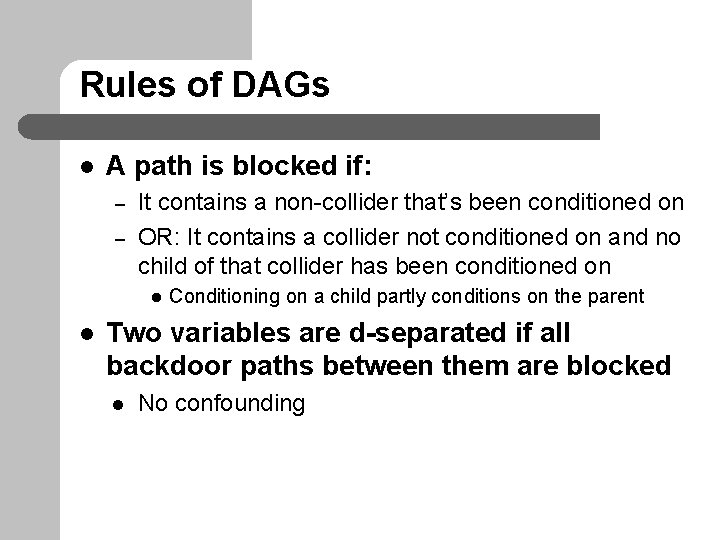
Rules of DAGs l A path is blocked if: – – It contains a non-collider that’s been conditioned on OR: It contains a collider not conditioned on and no child of that collider has been conditioned on l l Conditioning on a child partly conditions on the parent Two variables are d-separated if all backdoor paths between them are blocked l No confounding
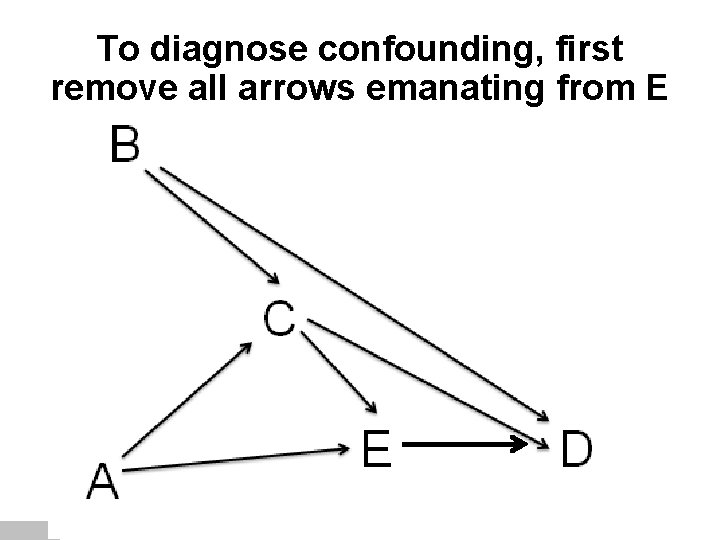
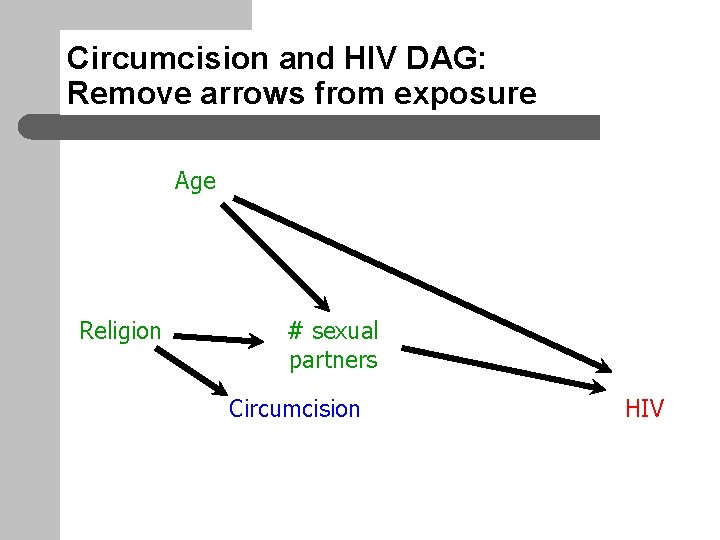
To diagnose confounding, first remove all arrows emanating from E
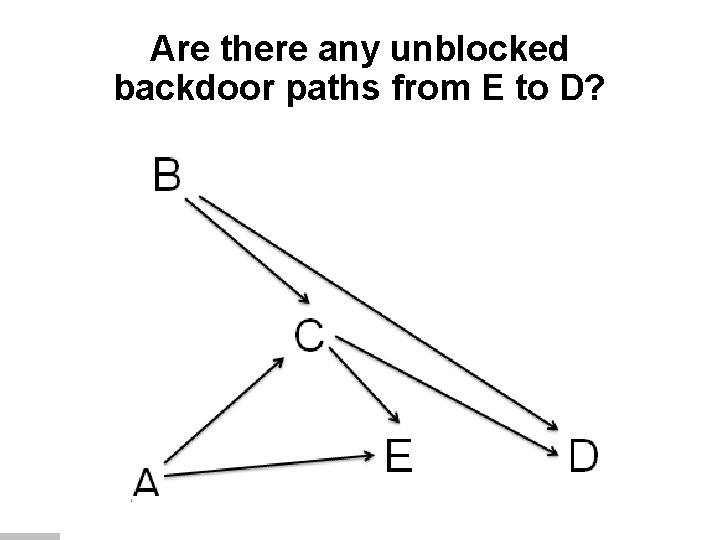
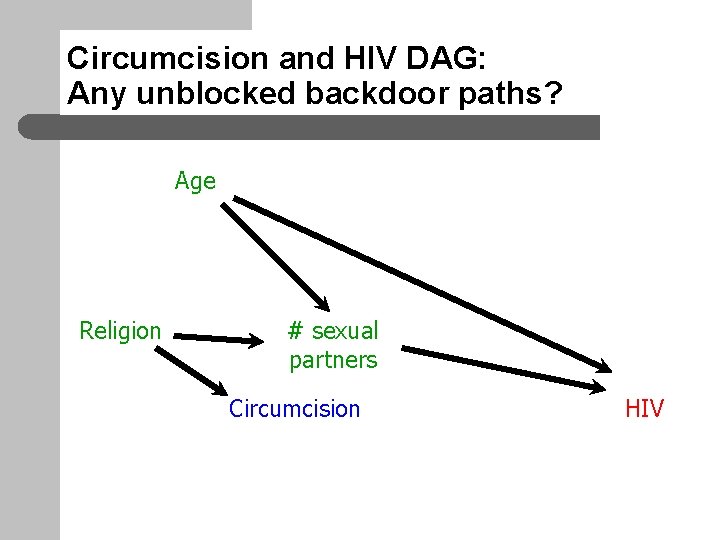
Are there any unblocked backdoor paths from E to D?
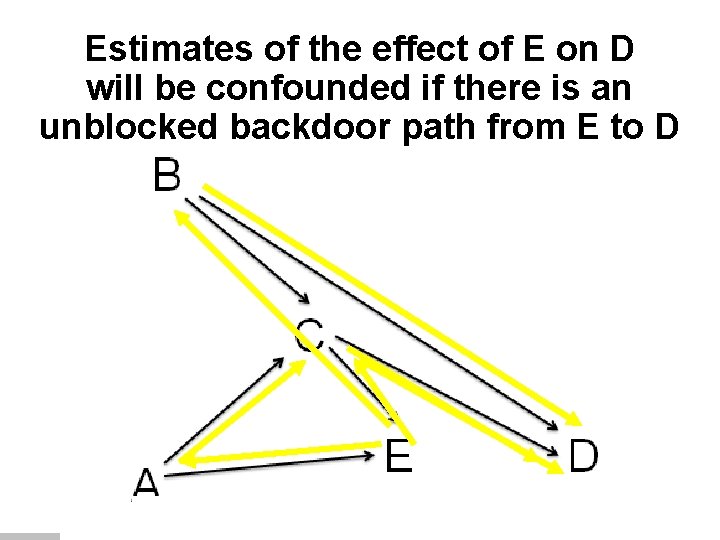
Estimates of the effect of E on D will be confounded if there is an unblocked backdoor path from E to D
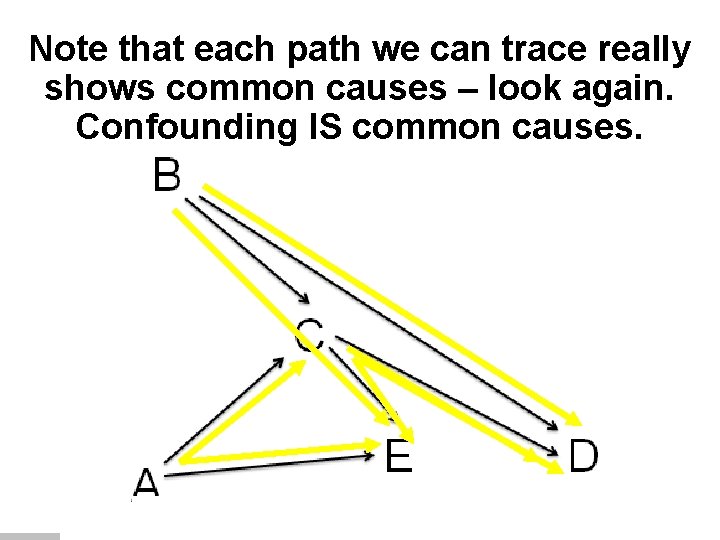
Note that each path we can trace really shows common causes – look again. Confounding IS common causes.
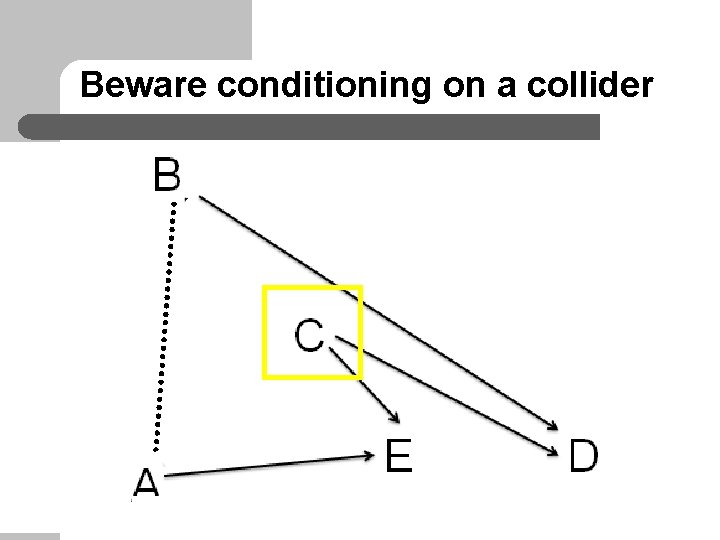
Beware conditioning on a collider
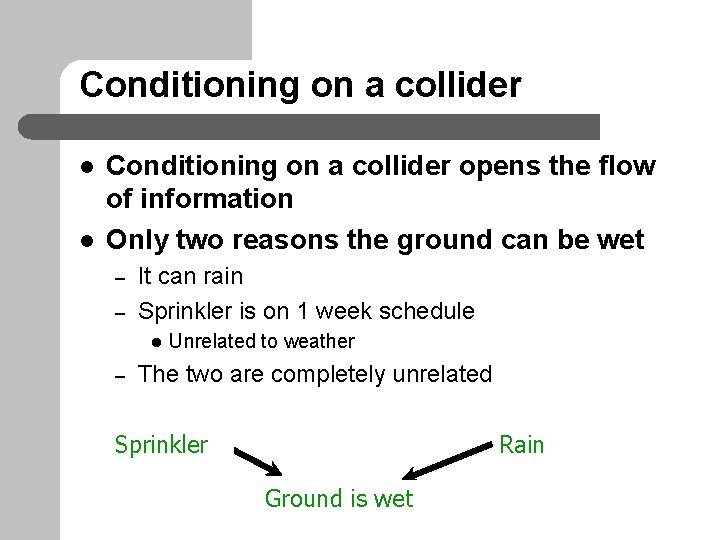
Conditioning on a collider l l Conditioning on a collider opens the flow of information Only two reasons the ground can be wet – – It can rain Sprinkler is on 1 week schedule l – Unrelated to weather The two are completely unrelated Sprinkler Rain Ground is wet
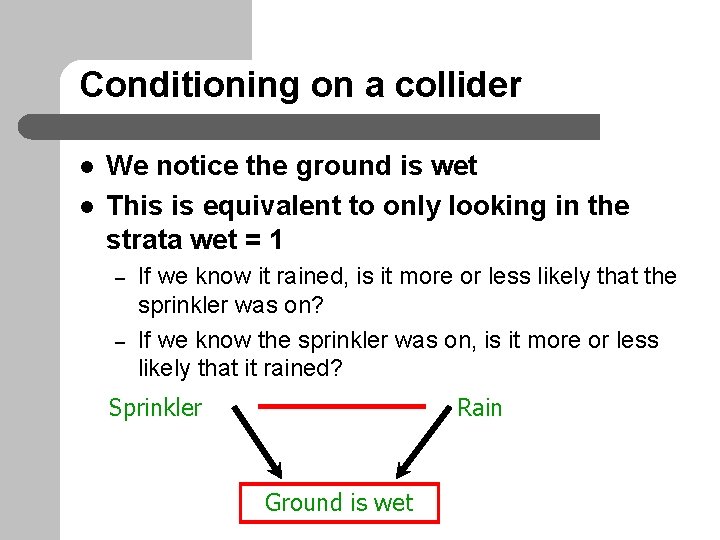
Conditioning on a collider l l We notice the ground is wet This is equivalent to only looking in the strata wet = 1 – – If we know it rained, is it more or less likely that the sprinkler was on? If we know the sprinkler was on, is it more or less likely that it rained? Sprinkler Age Rain Ground is wet
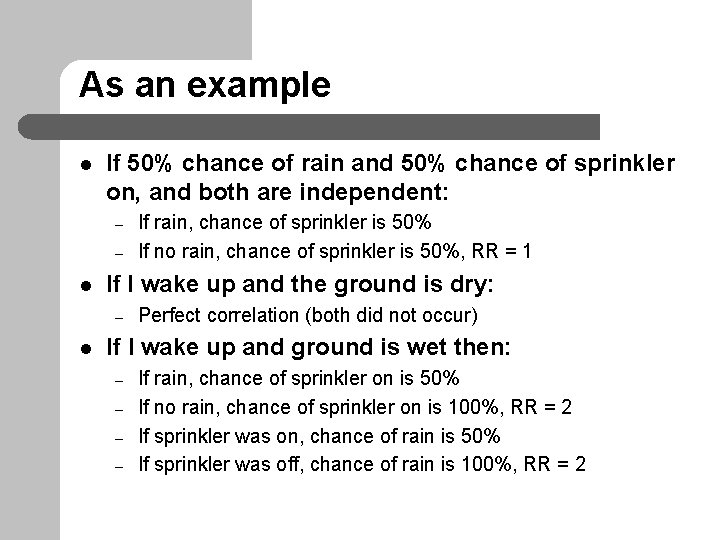
As an example l If 50% chance of rain and 50% chance of sprinkler on, and both are independent: – – l If I wake up and the ground is dry: – l If rain, chance of sprinkler is 50% If no rain, chance of sprinkler is 50%, RR = 1 Perfect correlation (both did not occur) If I wake up and ground is wet then: – – If rain, chance of sprinkler on is 50% If no rain, chance of sprinkler on is 100%, RR = 2 If sprinkler was on, chance of rain is 50% If sprinkler was off, chance of rain is 100%, RR = 2
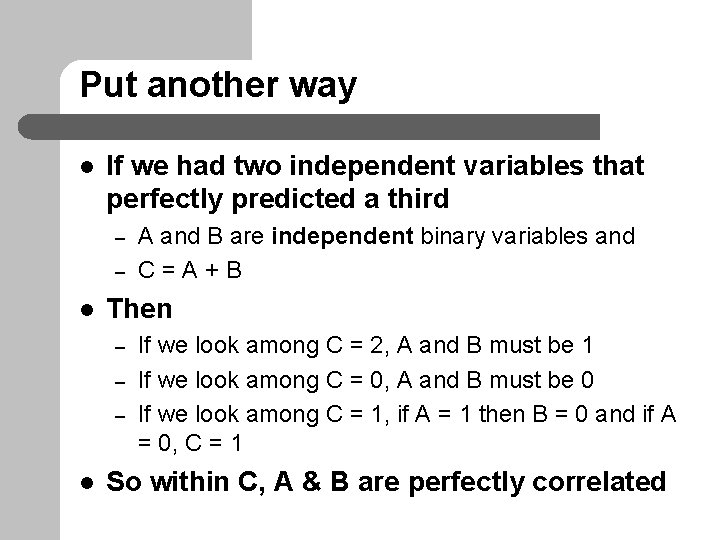
Put another way l If we had two independent variables that perfectly predicted a third – – l Then – – – l A and B are independent binary variables and C=A+B If we look among C = 2, A and B must be 1 If we look among C = 0, A and B must be 0 If we look among C = 1, if A = 1 then B = 0 and if A = 0, C = 1 So within C, A & B are perfectly correlated
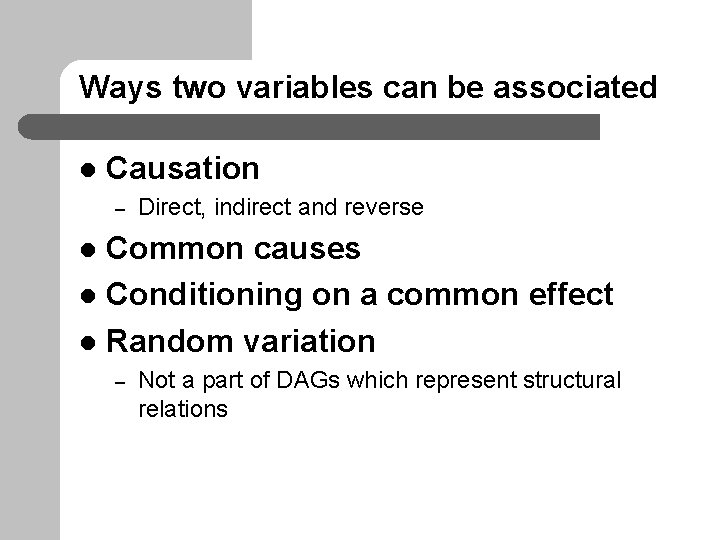
Ways two variables can be associated l Causation – Direct, indirect and reverse Common causes l Conditioning on a common effect l Random variation l – Not a part of DAGs which represent structural relations
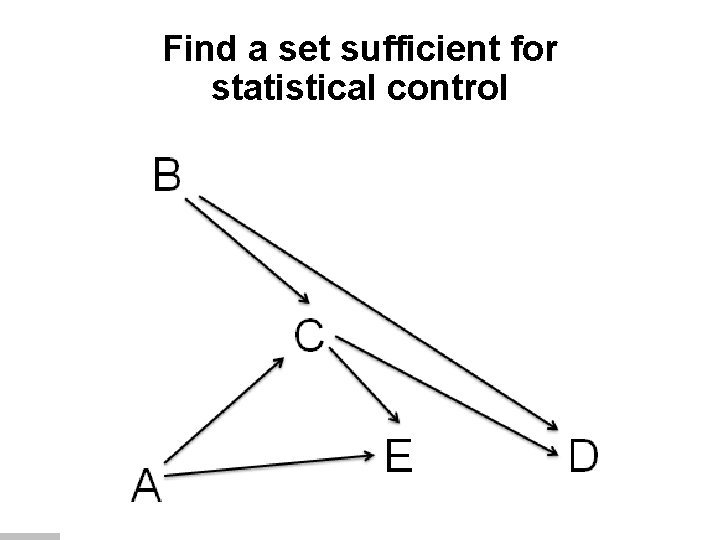
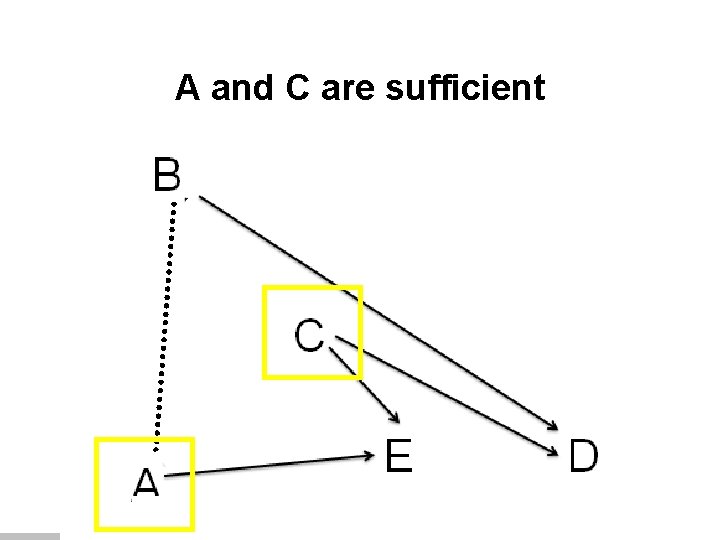
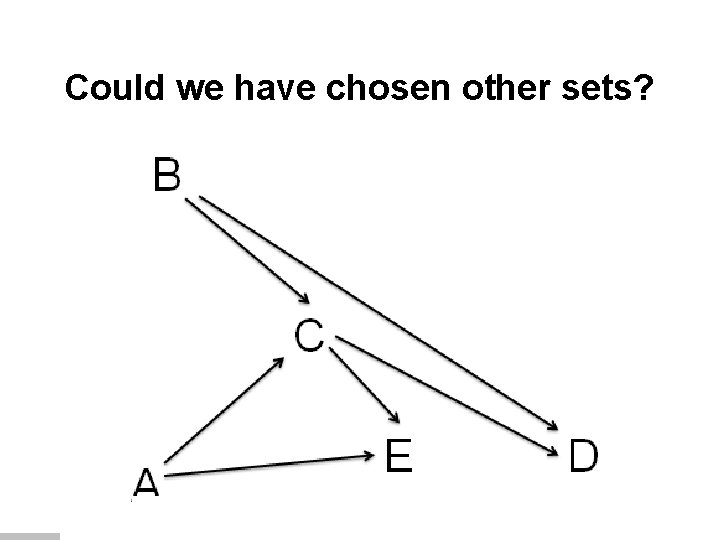
Find a set sufficient for statistical control
A and C are sufficient
Could we have chosen other sets?
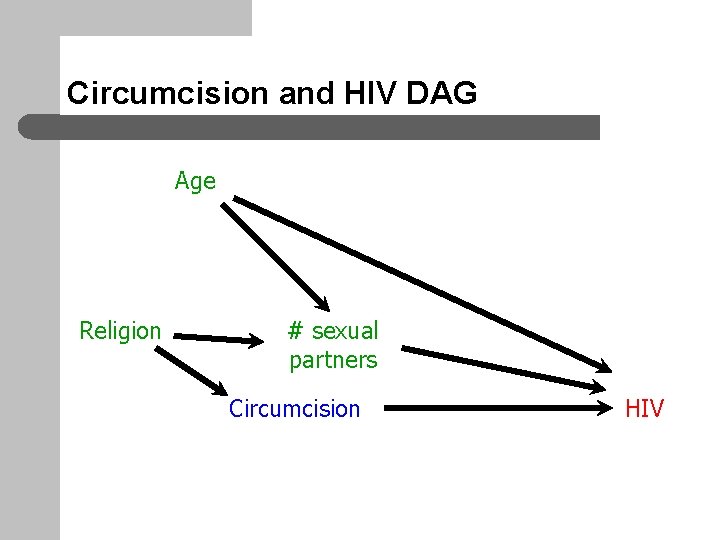
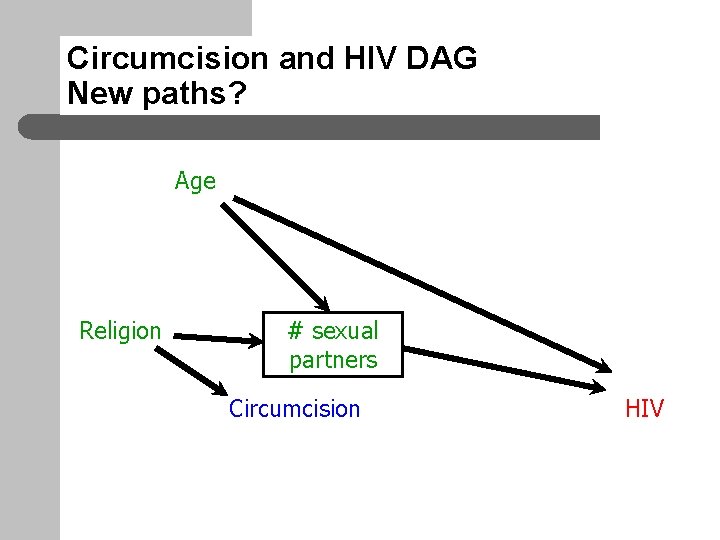
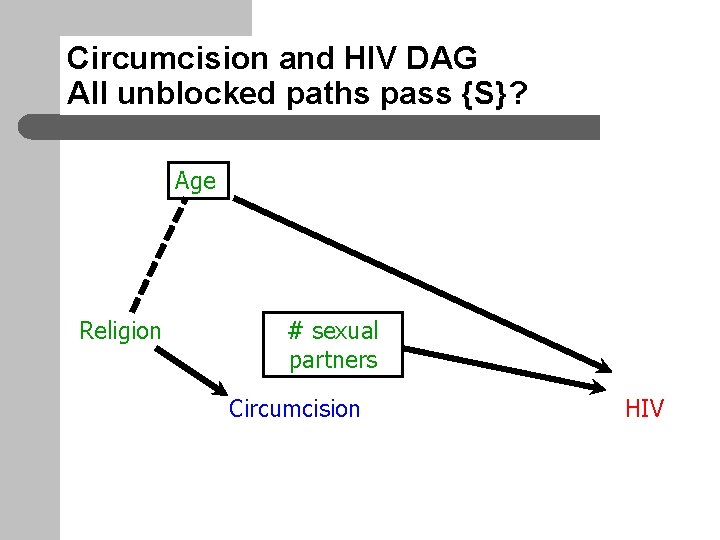
Circumcision and HIV DAG Age Religion # sexual partners Circumcision HIV
Circumcision and HIV DAG: Remove arrows from exposure Age Religion # sexual partners Circumcision HIV
Circumcision and HIV DAG: Any unblocked backdoor paths? Age Religion # sexual partners Circumcision HIV
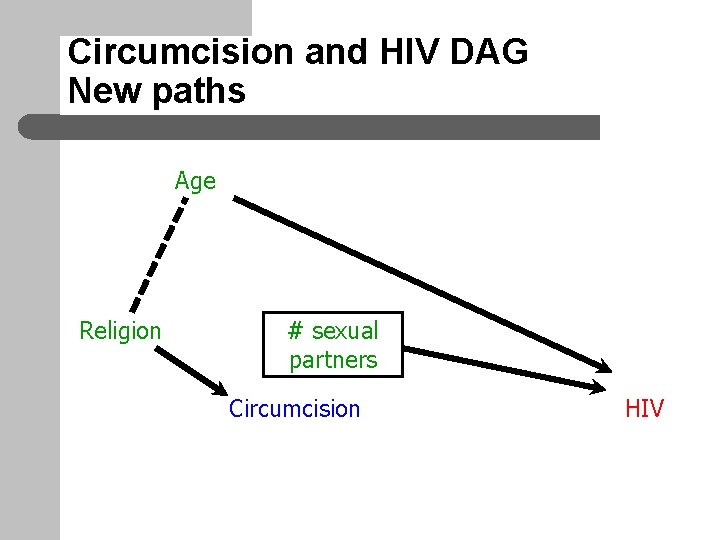
Circumcision and HIV DAG New paths? Age Religion # sexual partners Circumcision HIV
Circumcision and HIV DAG New paths Age Religion # sexual partners Circumcision HIV
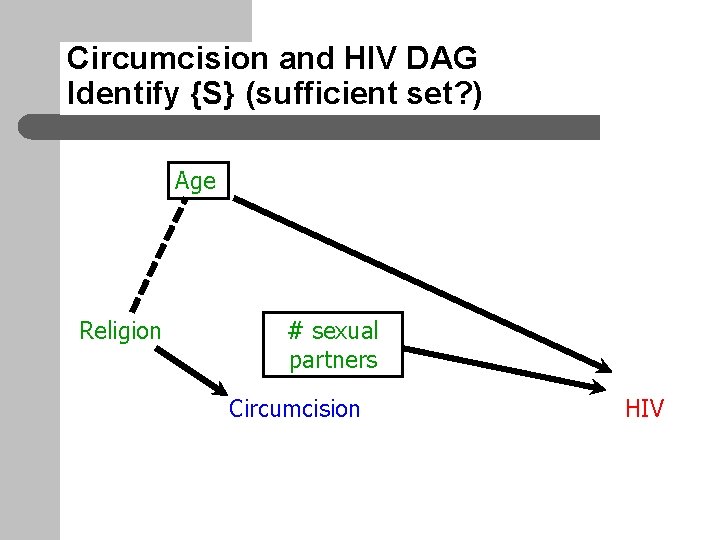
Circumcision and HIV DAG Identify {S} (sufficient set? ) Age Religion # sexual partners Circumcision HIV
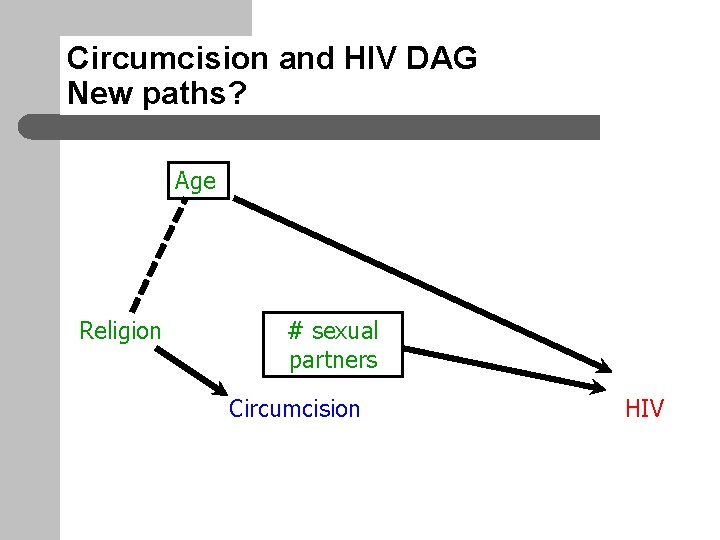
Circumcision and HIV DAG New paths? Age Religion # sexual partners Circumcision HIV
Circumcision and HIV DAG All unblocked paths pass {S}? Age Religion # sexual partners Circumcision HIV
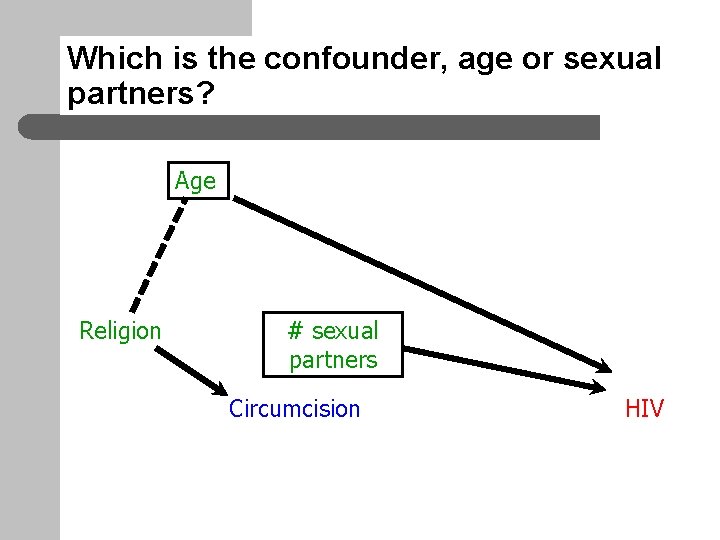
Which is the confounder, age or sexual partners? Age Religion # sexual partners Circumcision HIV
This is why we separate confounders from confounding
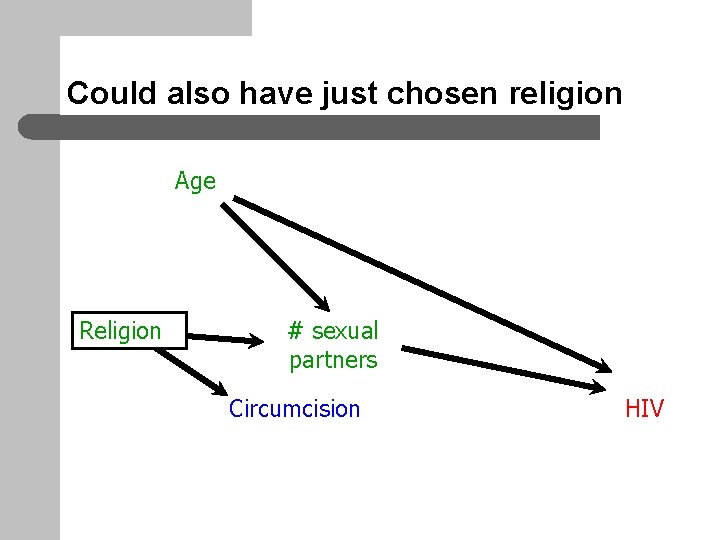
Could also have just chosen religion Age Religion # sexual partners Circumcision HIV
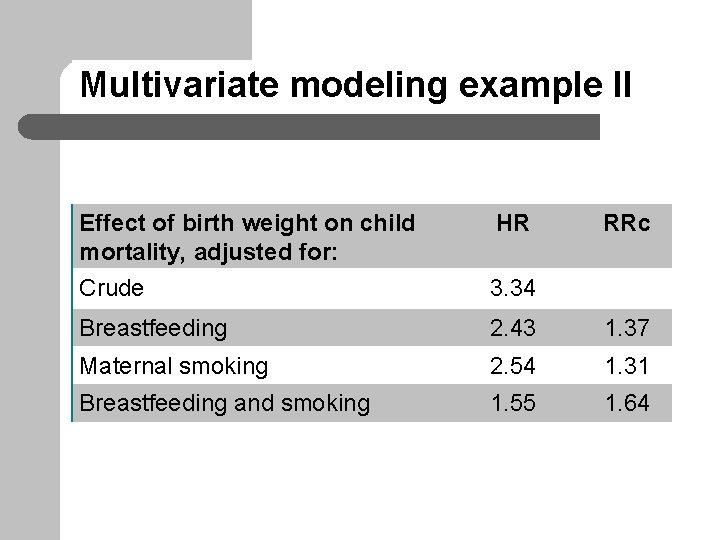
Multivariate modeling example II Effect of birth weight on child mortality, adjusted for: Crude HR RRc 3. 34 Breastfeeding 2. 43 1. 37 Maternal smoking 2. 54 1. 31 Breastfeeding and smoking 1. 55 1. 64
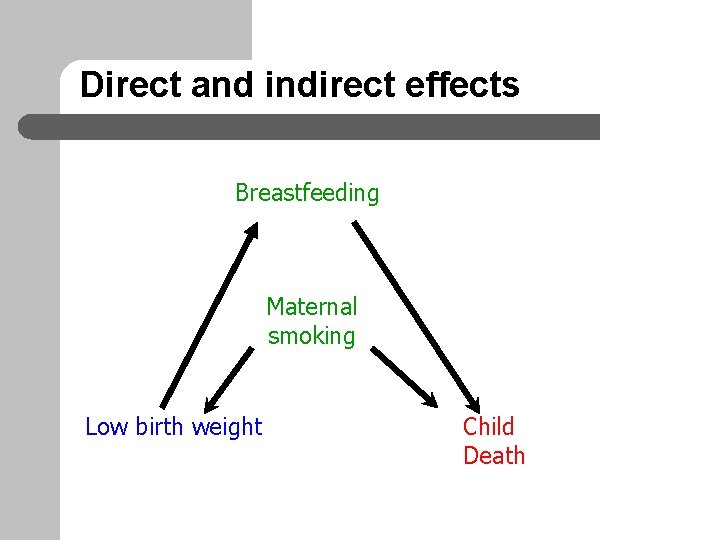
Direct and indirect effects Breastfeeding Maternal smoking Low birth weight Child Death
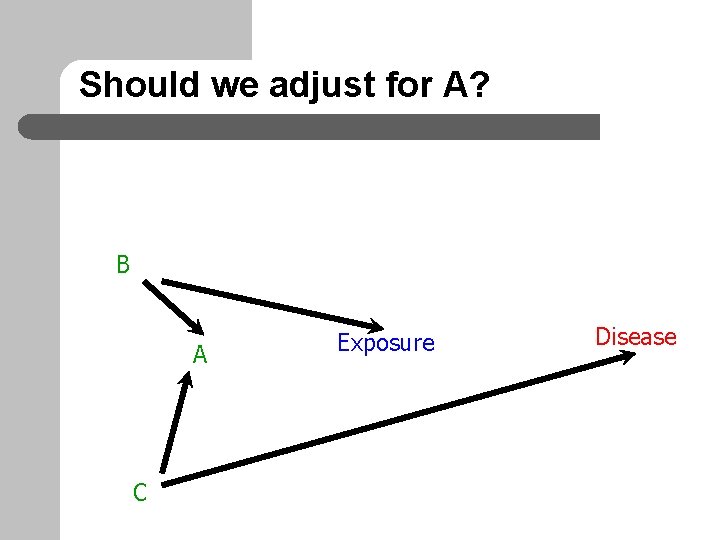
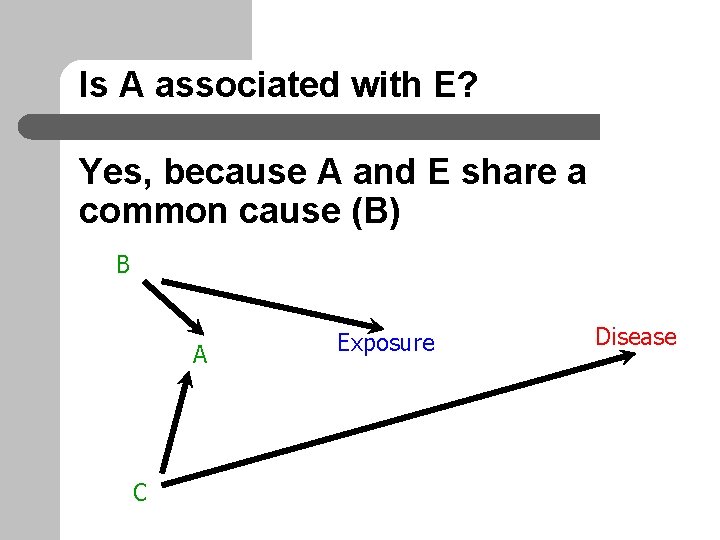
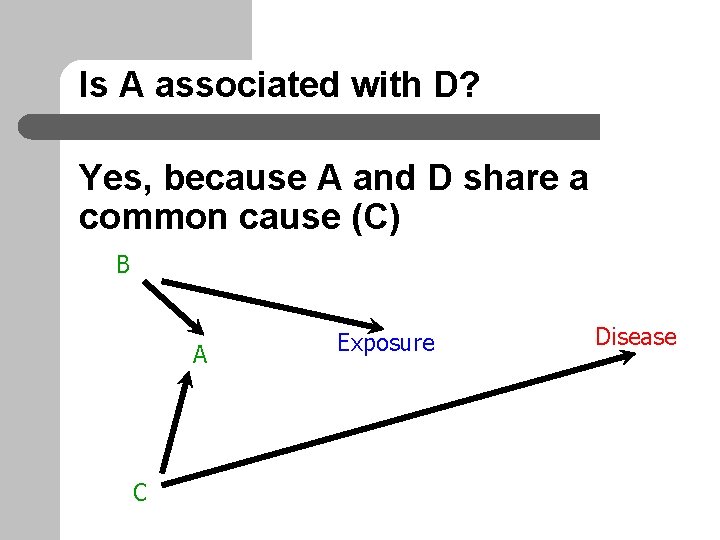
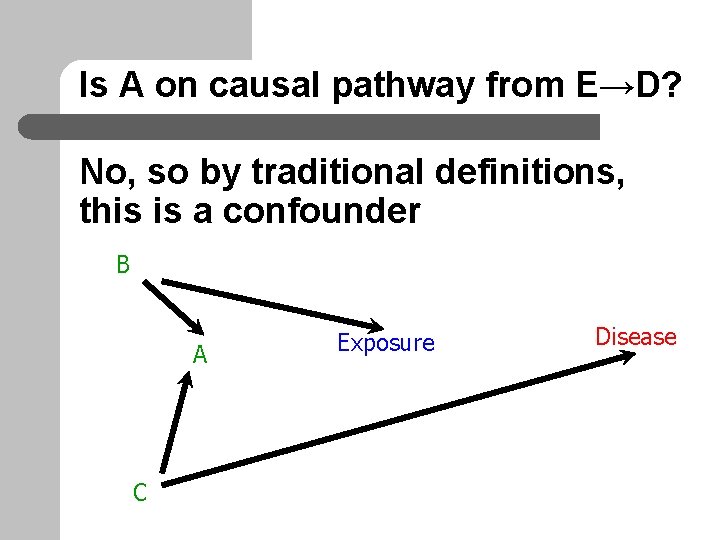
Should we adjust for A? B A C Exposure Disease
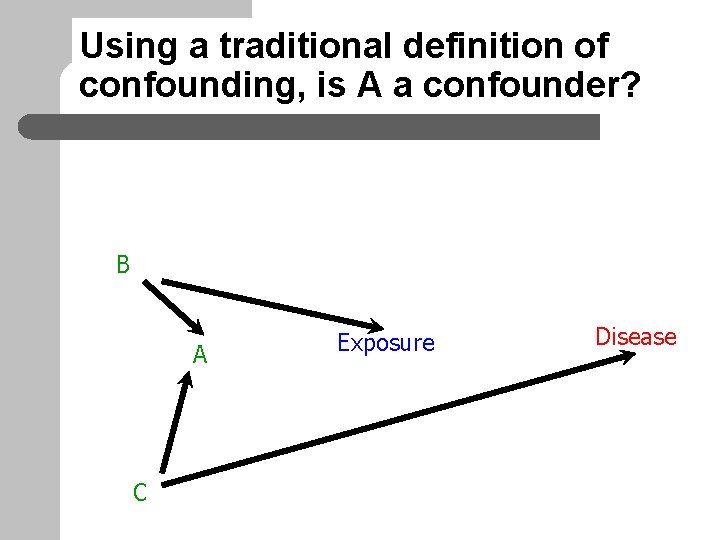
Using a traditional definition of confounding, is A a confounder? B A C Exposure Disease
Is A associated with E? Yes, because A and E share a common cause (B) B A C Exposure Disease
Is A associated with D? Yes, because A and D share a common cause (C) B A C Exposure Disease
Is A on causal pathway from E→D? No, so by traditional definitions, this is a confounder B A C Exposure Disease
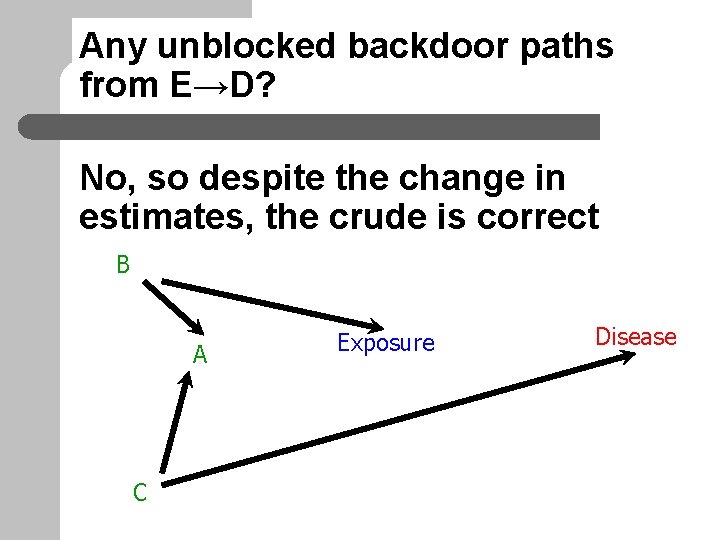
Any unblocked backdoor paths from E→D? No, so despite the change in estimates, the crude is correct B A C Exposure Disease
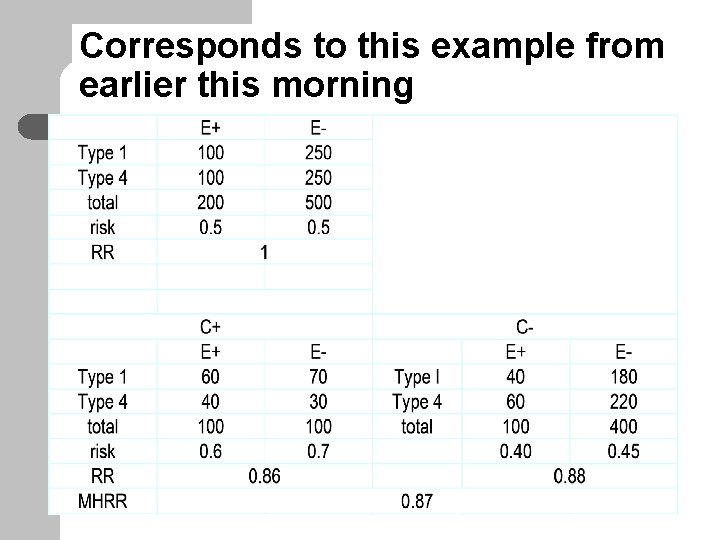
Corresponds to this example from earlier this morning
Multivariate modeling example III Effect of E on D, adjusted for: crude HR 95% CI 1. 0 (0. 8 -1. 3) A 2. 1 (1. 3 -3. 7) B 1. 0 (0. 6 -1. 6) C 1. 0 (0. 6 -1. 6) A and B 1. 0 (0. 6 -1. 8) A and C 1. 0 (0. 6 -1. 7) B and C 1. 0 (0. 6 -1. 8) A, B and C 1. 0 (0. 5 -2. 1)
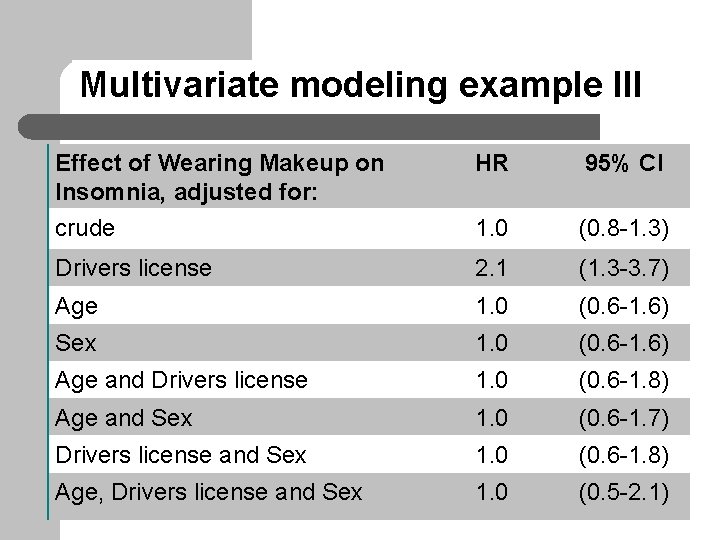
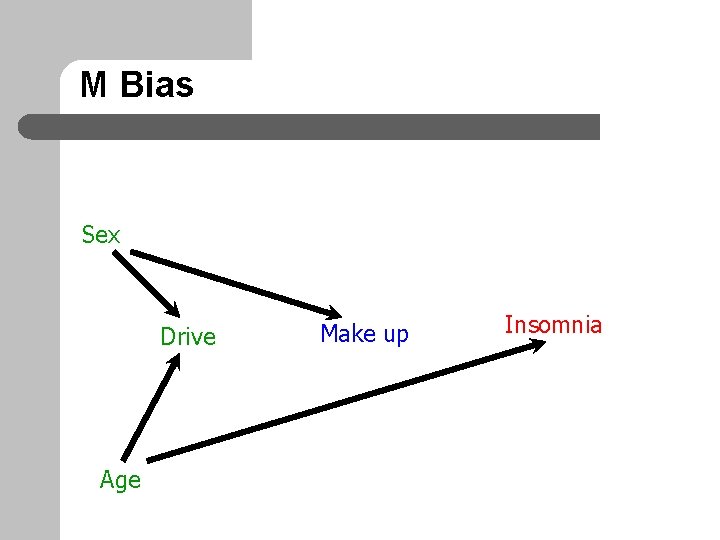
Multivariate modeling example III Effect of Wearing Makeup on Insomnia, adjusted for: crude HR 95% CI 1. 0 (0. 8 -1. 3) Drivers license 2. 1 (1. 3 -3. 7) Age 1. 0 (0. 6 -1. 6) Sex 1. 0 (0. 6 -1. 6) Age and Drivers license 1. 0 (0. 6 -1. 8) Age and Sex 1. 0 (0. 6 -1. 7) Drivers license and Sex 1. 0 (0. 6 -1. 8) Age, Drivers license and Sex 1. 0 (0. 5 -2. 1)
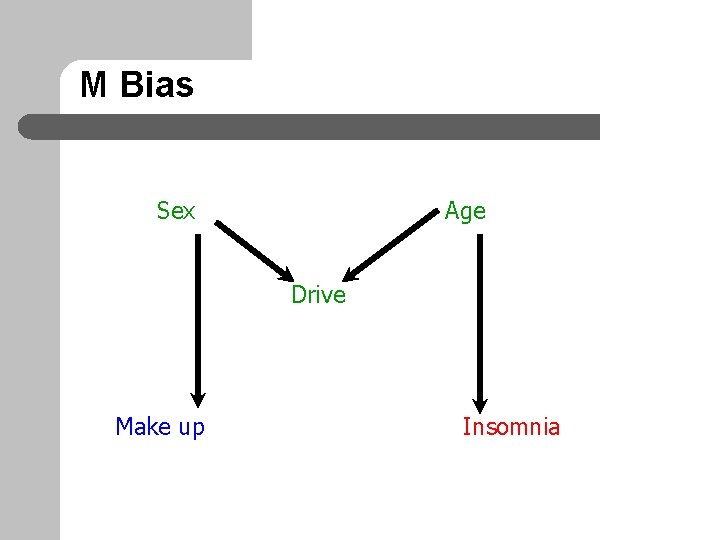
M Bias Sex Age Drive Make up Insomnia
M Bias Sex Drive Age Make up Insomnia
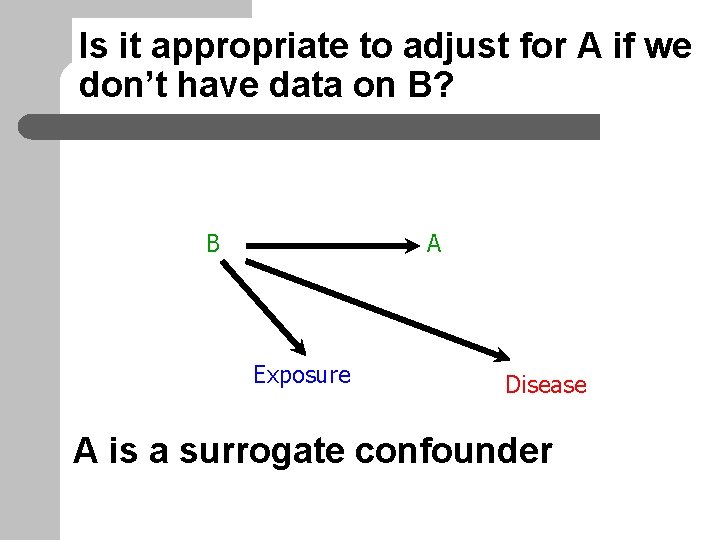
Is it appropriate to adjust for A if we don’t have data on B? B A Exposure Disease A is a surrogate confounder
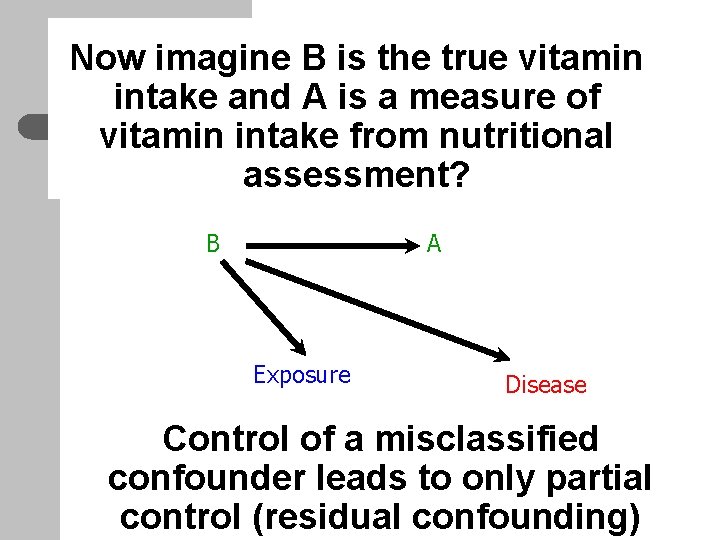
Now imagine B is the true vitamin intake and A is a measure of vitamin intake from nutritional assessment? B A Exposure Disease Control of a misclassified confounder leads to only partial control (residual confounding)
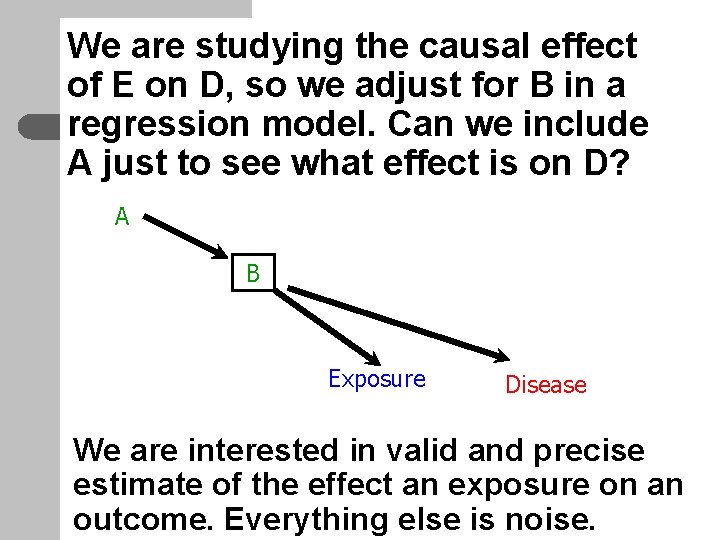
We are studying the causal effect of E on D, so we adjust for B in a regression model. Can we include A just to see what effect is on D? A B Exposure Disease We are interested in valid and precise estimate of the effect an exposure on an outcome. Everything else is noise.
Pros and Cons of DAGs l Advantages: – Flexible l – Illustrates dependencies between variables l l Represents states of individuals in populations Implications for validity of measures of effect Disadvantages: – No inherent technique to quantify associations based on info in the graphs l No way to estimate effects based only on information in the graphs