3 3 Energy Flow in Ecosystems The arrows


- Slides: 35
3. 3 Energy Flow in Ecosystems The arrows show energy moves from the “eaten” to the “eater” – not who eats who. Energy flows through an ecosystem in a one-way stream, from primary producers to various consumers.
food chain: series of steps in which organisms transfer energy by eating and being eaten. Food chains can vary in length. In the Everglades the primary producers are a mixture of floating algae called phytoplankton and attached algae. These producers are eaten by small fishes, such as flagfish
Food Chains There are four steps in this food chain. The top carnivore is four steps removed from the primary producer.
Food Webs In most ecosystems, feeding relationships are much more complicated than the relationships described in a single, simple chain because many animals eat more than one kind of food web a network of feeding interactions. Each path in a food web is a food chain. An example of a food web in the Everglades:
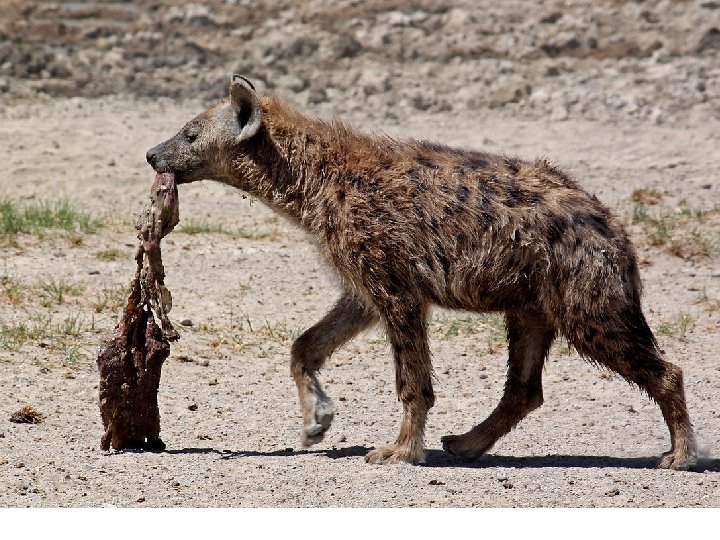
Decomposers and Detritivores in Food Webs Most producers die without being eaten. In the detritus pathway, decomposers convert that dead material to detritus, which is eaten by detritivores, such as crayfish, grass shrimp, and worms. Pig frogs, killifish, and other fishes eat the detritivores.
Decomposition of dead and decaying matter in food chains/webs releases/recycles nutrients that can be used by primary producers. Without decomposers, nutrients would remain locked in dead organisms.
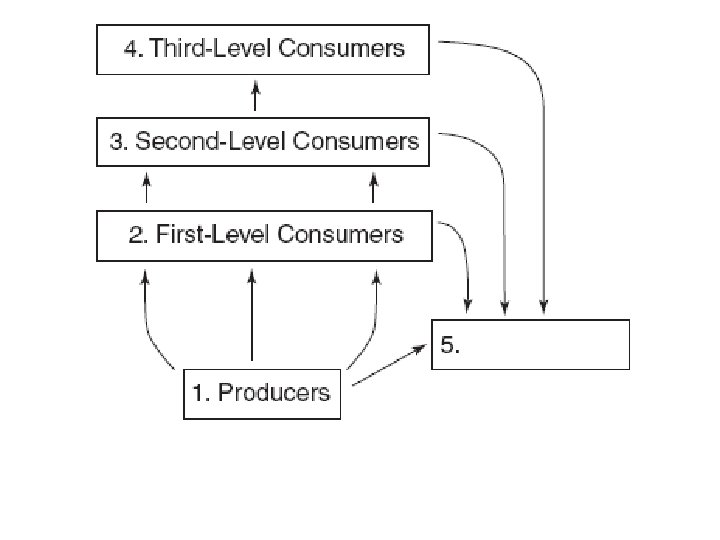
Trophic Levels and Ecological Pyramids Trophic level: each step in a food chain or food web. Primary producers always make up the first trophic level. Various consumers occupy every other level. http: //sciencebitz. com/? page_id=1202
https: //www. youtube. com/watch? v=Scizkx. Ml. EOM 90% lost at each level
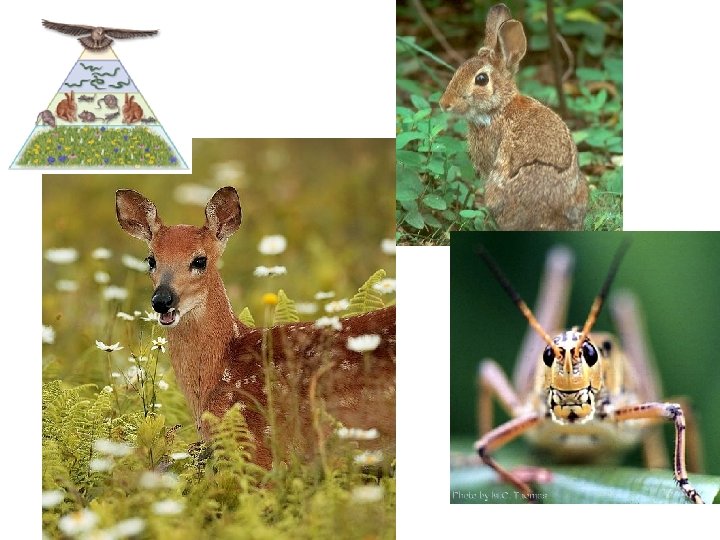
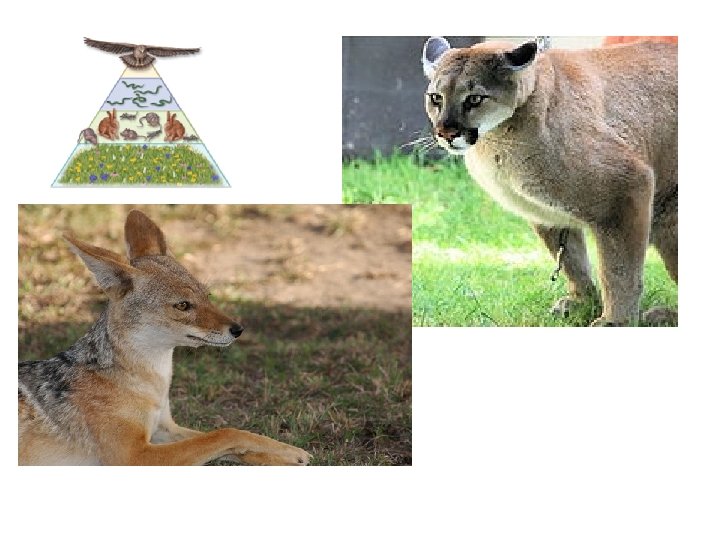
Tertiary consumers: 4 th trophic level Secondary consumers: 3 rd trophic level Primary consumers: 2 nd trophic level Producers 1 st trophic level https: //www. youtube. com/watch? v=m. CHdh. XMFhc. U
Write these down on the back of your paper 1. Grasslands - __________ 2. Plant eaters (gazelles) are _____________ 3. The meat eating cheetah (eats the gazelle) is a ______________ 4. The food chain always starts at _________ and ends in _______ https: //www. youtube. com/watch? v=T_JCw 4 Sq-ts
https: //www. youtube. com/watch? v=K-Tfq 6 d. ARGk
http: //www. youtube. com/watch? v=37 p. LUDHz. OZQ
Compare a food “web” to a food “chain”
Ecological Energy Pyramids Notes: Ecological Energy Pyramids
Pyramids of Energy Theoretically the number of trophic levels in a food web or the number of organisms that live on each level of limitless… but… Only a small portion of the energy that passes through an trophic level is “stored” in the bodies of organisms at the next level. Remember what the measure of heat is? …the calorie or Kcal
Pyramids of energy show the relative amount of energy available at each trophic level.
Pyramids of Energy 10 % of energy available within one trophic level is transferred to the next trophic level. 90% of the energy at a level is used by the organisms for life processes and activities
Biomass: the total amount of living tissue within a given trophic level. The amount of biomass a trophic level can support is determined by amount of energy available.
A biomass pyramid shows relative amounts of living organic matter at each trophic level. Greatest biomass is at the base of the pyramid.
Numbers Pyramid shows relative numbers of individual organisms at each trophic level in an ecosystem.
Go to recycling in the Biosphere powerpoint
Stop
Bellwork: Thurs. May 5, 2016 1. What do the arrows “show”? 2. Name the primary producers: 3. Name the first level consumers: 4. Name the second level consumers:
old bellworks…. <skip>
Bellwork 1. Compete the statement: Species _______________ ________. 2. The most numerous organisms in an ecosystem must be the ________ (hint: look at the bottom of your pyramid) 3. _________ and _________recycle nutrients back into the ecosystem. 4. Glue your “video” pyramid onto your bellwork
Pyramids of Biomass and Numbers In some cases, however, consumers are much smaller than organisms they feed upon. Thousands of insects may graze on a single tree, for example. The tree has a lot of biomass, but represents only one organism. In such cases, the pyramid of numbers may be turned upside down, but the pyramid of biomass usually still has the normal orientation.
Bellwork
Draw a simple version of the ecological Bellwork: pyramid 1. The ______level has the most energy. 2. The ______level has the most organisms. 3. The ______level has the least organisms. 4. The _______level has the least energy.
Bellwork: Mon. April 28, 2014 1. Name some Biotic parts of this ecosystem: 2. Name some Abiotic parts of this ecosystem:
Bellwork: 1. Abiotic factors are the _________ things in an ecosystem. 2. Biotic factors are all _________ things in an ecosystem.