
3 3 COLLECT ORGANIZE DATA Its important to



- Slides: 12
3. 3 COLLECT & ORGANIZE DATA
� It’s important to gather accurate data and to ensure the data is as complete as possible �If you gather the data yourself, it is Primary Data �If you use data collected by others, it is Secondary Data Might be errors in the published secondary data Results might not state how data was gathered, or limitations of the use of the data
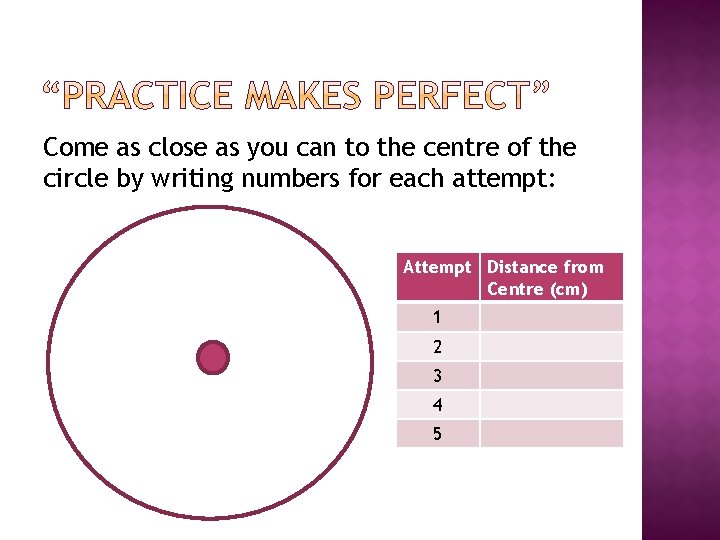
Come as close as you can to the centre of the circle by writing numbers for each attempt: Attempt Distance from Centre (cm) 1 2 3 4 5
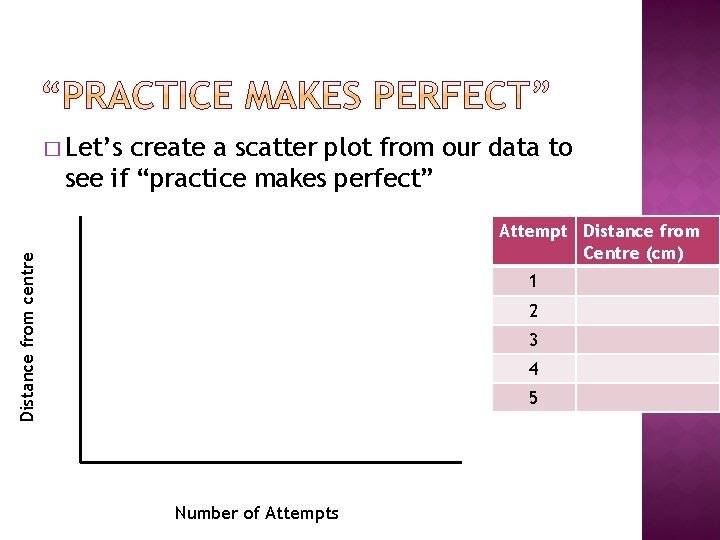
� Let’s create a scatter plot from our data to see if “practice makes perfect” Distance from centre Attempt Distance from Centre (cm) 1 2 3 4 5 Number of Attempts
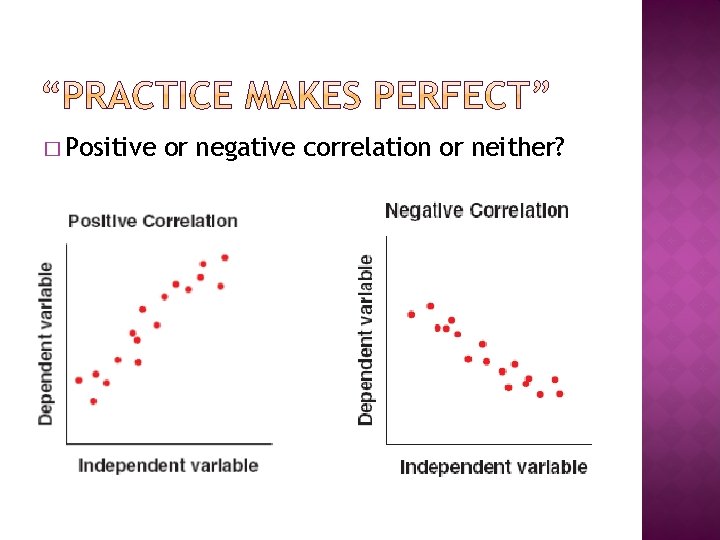
� Positive or negative correlation or neither?
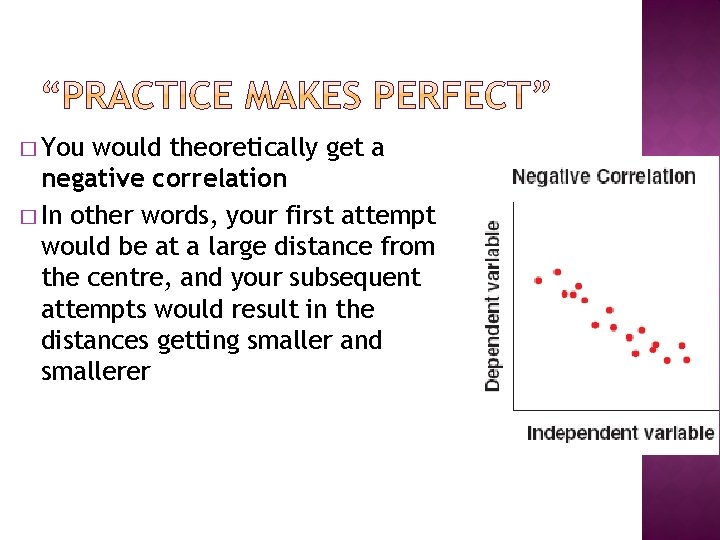
� You would theoretically get a negative correlation � In other words, your first attempt would be at a large distance from the centre, and your subsequent attempts would result in the distances getting smaller and smallerer
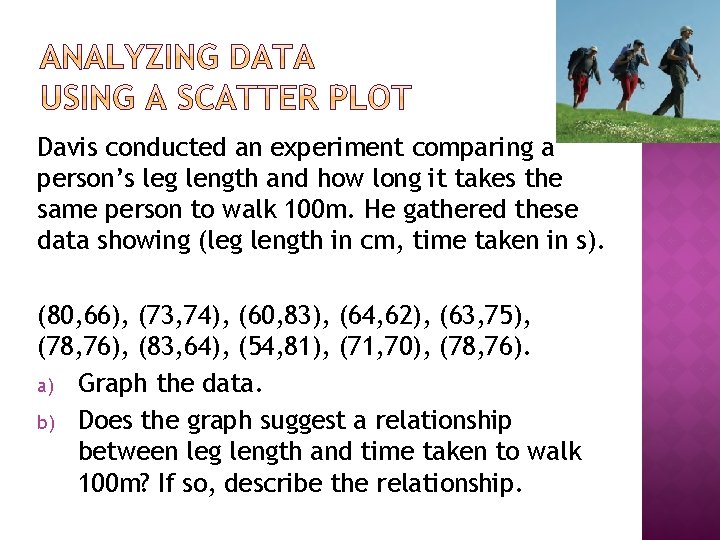
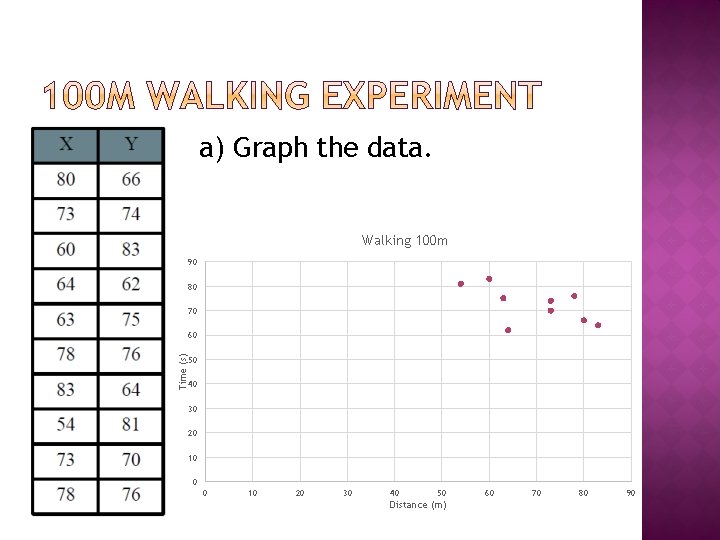
Davis conducted an experiment comparing a person’s leg length and how long it takes the same person to walk 100 m. He gathered these data showing (leg length in cm, time taken in s). (80, 66), (73, 74), (60, 83), (64, 62), (63, 75), (78, 76), (83, 64), (54, 81), (71, 70), (78, 76). a) Graph the data. b) Does the graph suggest a relationship between leg length and time taken to walk 100 m? If so, describe the relationship.
a) Graph the data. Walking 100 m 90 80 70 Time (s) 60 50 40 30 20 10 0 0 10 20 30 40 50 Distance (m) 60 70 80 90
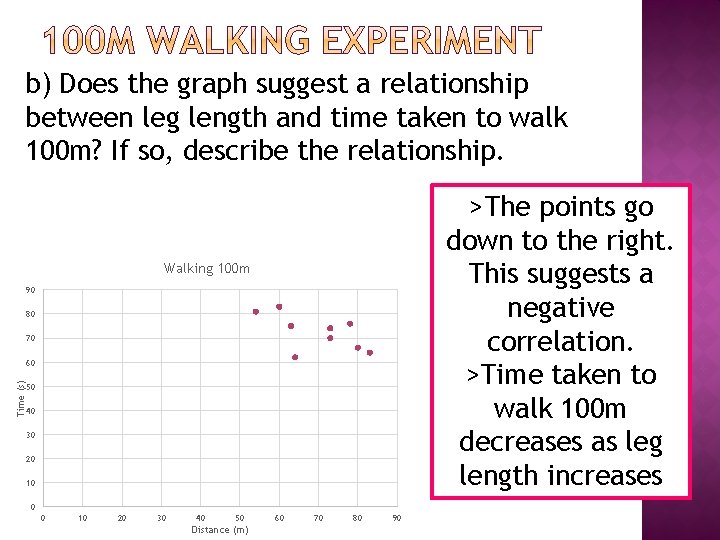
b) Does the graph suggest a relationship between leg length and time taken to walk 100 m? If so, describe the relationship. >The points go down to the right. This suggests a negative correlation. >Time taken to walk 100 m decreases as leg length increases Walking 100 m 90 80 70 Time (s) 60 50 40 30 20 10 0 0 10 20 30 40 50 Distance (m) 60 70 80 90
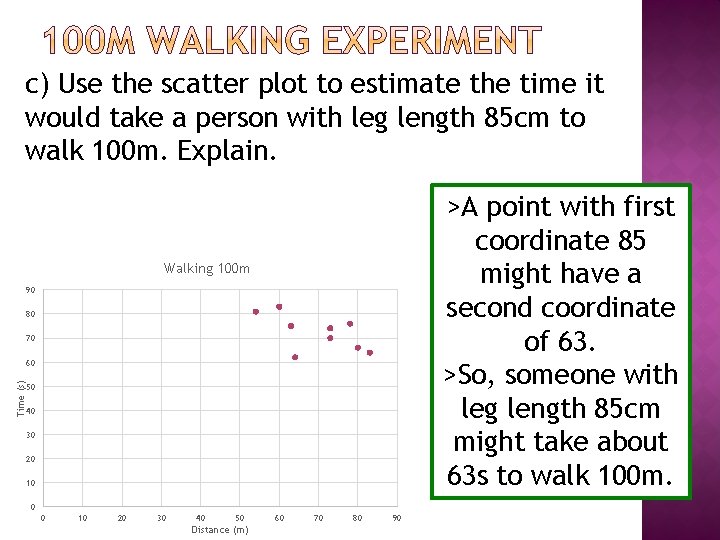
c) Use the scatter plot to estimate the time it would take a person with leg length 85 cm to walk 100 m. Explain. >A point with first coordinate 85 might have a second coordinate of 63. >So, someone with leg length 85 cm might take about 63 s to walk 100 m. Walking 100 m 90 80 70 Time (s) 60 50 40 30 20 10 0 0 10 20 30 40 50 Distance (m) 60 70 80 90
d) How might Davis make the results of his experiment more reliable? More data would make Davis’ results more reliable. He could recruit people with a wider range of leg lengths while keeping other factors, such as age, gender, and body type, very similar.
� p. 165 #1, 2, 3, 4