3 2 Introduction to Functions Vocabulary A set

3. 2 Introduction to Functions

Vocabulary • A set of ordered pairs is also called a relation. • The domain is the set of x-coordinates (first components) of the ordered pairs. • The range is the set of y-coordinates (second components) of the ordered pairs.
, (– 4, 9),")
Example Determine the domain and range of the relation {(4, 9), (– 4, 9), (2, 3), (10, – 5)} • Domain is the set of all the first coordinates of the ordered pairs: {4, – 4, 2, 10} • Range is the set of all the second coordinates of the ordered pairs: {9, 3, – 5}
 • Polar")
Example Find the domain and range of the following relation. Input (Animal) • Polar Bear • Cow • Chimpanzee • Giraffe • Gorilla • Kangaroo • Red Fox Output (Life Span) 20 15 10 7
 Domain is {Polar Bear, Cow, Chimpanzee, Giraffe, Gorilla, Kangaroo, Red Fox} Range")
Example (cont) Domain is {Polar Bear, Cow, Chimpanzee, Giraffe, Gorilla, Kangaroo, Red Fox} Range is {20, 15, 10, 7}

Functions Some relations are also functions. A function is a relation in which each first component in the ordered pairs corresponds to exactly one second component.
, (– 4, 9), (2, 3), (10, – 5)}, also")
Example Is the relation{(4, 9), (– 4, 9), (2, 3), (10, – 5)}, also a function? Since each element of the domain is paired with only one element of the range, it is a function. Note: It’s okay for a y-value to be assigned to more than one x-value, but an x-value cannot be assigned to more than one y-value (has to be assigned to ONLY one y-value).

Example Is the relation y = x 2 – 2 x a function? Since each element of the domain (the x-values) would produce only one element of the range (the y-values), it is a function.

Example Is the relation x 2 – y 2 = 9 a function? Since each element of the domain (the x-values) would correspond with 2 different values of the range (both a positive and negative y-value), the relation is NOT a function.

Vertical Line Test Graphs can be used to determine if a relation is a function. Vertical Line Test If no vertical line can be drawn so that it intersects a graph more than once, the graph is not the graph of a function.

Example Use the vertical line test to determine whether the graph to the right is the graph of a function. Since no vertical line will intersect this graph more than once, it is the graph of a function. y x

Example Use the vertical line test to determine whether the graph to the right is the graph of a function. Since no vertical line will intersect this graph more than once, it is the graph of a function. y x

Example Use the vertical line test to determine whether the graph to the right is the graph of a function. Since vertical lines can be drawn that intersect the graph in two points, it is NOT the graph of a function. y x

Vertical Line Test Since the graph of a linear equation is a line, all linear equations are functions, except those whose graph is a vertical line Note: An equation of the form y = c is a horizontal line and IS a function. An equation of the form x = c is a vertical line and IS NOT a function.

Example y Find the domain and range of the function graphed to the right. Use interval notation. Domain is [– 3, 4] Range is [– 4, 2] Domain x Range

Example Find the domain and range of the function graphed to the right. Use interval notation. y Range x Domain is (– , ) Range is [– 2, ) Domain
 is a special symbol in mathematics used to denote")
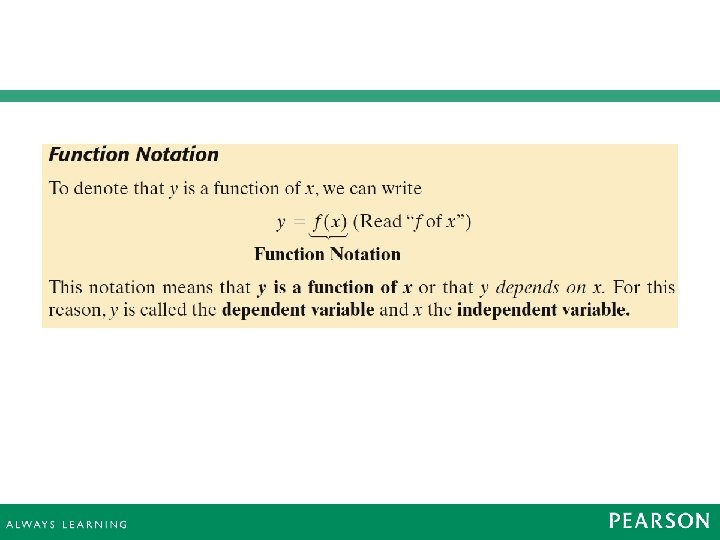
Helpful Hint Note that f(x) is a special symbol in mathematics used to denote a function. The symbol f(x) is read “f of x. ” It does not mean f • x (f times x).
 = 4 x – 1, find")
Example Find each function value. a. If f(x) = 4 x – 1, find f(2) = 4(2) – 1 = 7 b. If g(x) = x 2 – 2 x, find g(– 3) = (– 3)2 – 2(– 3) = 9 – (– 6) = 15

Example Given the graph of the following function, find each function value by inspecting the graph. f(5) = 8 f(4) = 3 f( 5) = 1 f( 6) = 7 y f(x) x
- Slides: 20