26134 Business Statistics Autumn 2017 Tutorial 1 Introduction
 Mahrita. Harahap@uts.")
26134 Business Statistics Autumn 2017 Tutorial 1: Introduction to Business Statistics (BStats) Mahrita. Harahap@uts. edu. au B Math. Fin (Hons) M Stat (UNSW) Ph. D (UTS) mahritaharahap. wordpress. com/ teaching-areas UTS CRICOS PROVIDER CODE: 00099 F business. uts. edu. au

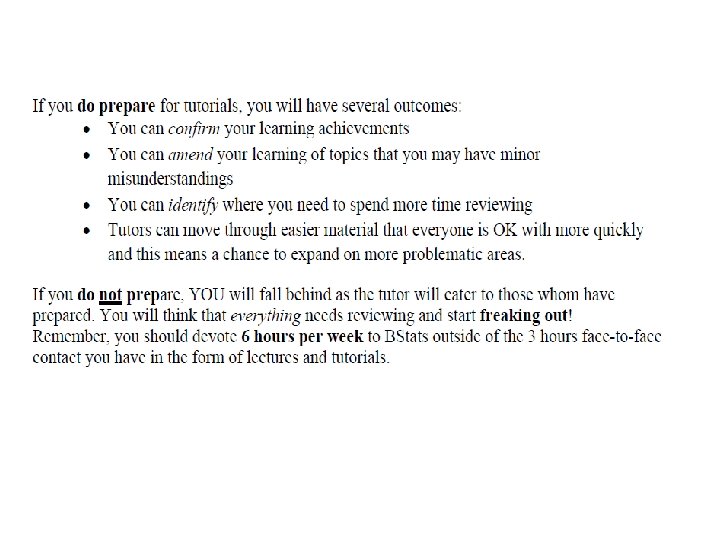
Student Resources • UPASS - is a voluntary “study session” where you will be studying the subject with other students in a group. It is led by a student who has previously achieved a distinction or high distinction in that subject, and who has a good WAM. You can sign up for U: PASS sessions in My Student Admin https: //onestopadmin. uts. edu. au/. Note that sign up is not open until week 1, as it’s voluntary and only students who want to go should sign up To Sign Up to these groups go to this website: helps-booking. uts. edu. au • Maths Study Center @ CB 04. 03. 331 Free drop-in one on one consultation tutoring on math/stats related questions 11 am to 5 pm on weekdays • Online resources such as youtube or www. khanacademy. org • Discussion Board on UTS Online 2
 – Held in your allocated tutorial in Week")
Assessments • • • Mid-semester (30%) – Held in your allocated tutorial in Week 7 (wb. 1 st May) – Covering Lectures 1 to 5 – Chapters 1 to 6 (inclusive) and Chapter 12 – Multiple Choice Questions – One hour – Composite mid-semester grade applies (i. e. , reweighting) but only applied if approved special consideration procedures followed Group Report (20%) – Handed in at your allocated tutorial in Week 11 (wb. 29 th May) – Demonstrate ability to locate, select and analyse data using Excel – Develops team work and communication skills – Groups of 3, 4 or 5 made up of any student enrolled in the subject (that is, not allocated by us nor tutorial specific) – More details will be provided on UTSOnline Final Exam (50%) – Centrally conducted examination – Held in your exam period (Sat 17 Jun – 30 Jun) – Covering all lectures – Chapters 1 to 15 – Written questions – Two hours 4
 Upon successful completion of this subject students should be able")
Subject learning objectives (SLOs) Upon successful completion of this subject students should be able to: 1. apply standard statistical tools in various business decision contexts within a professionally responsible framework 2. apply appropriate quantitative analytical techniques to qualify, support, select and evaluate data as information for business decision-making 3. effectively interpret and communicate results of quantitative analyses for business decision-making 4. effectively use a computer-based data analysis package (i. e. Excel) to critically analyse data.

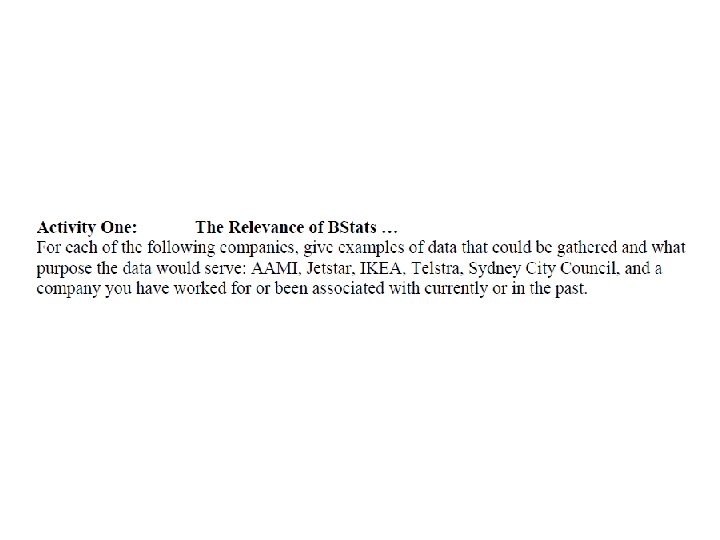
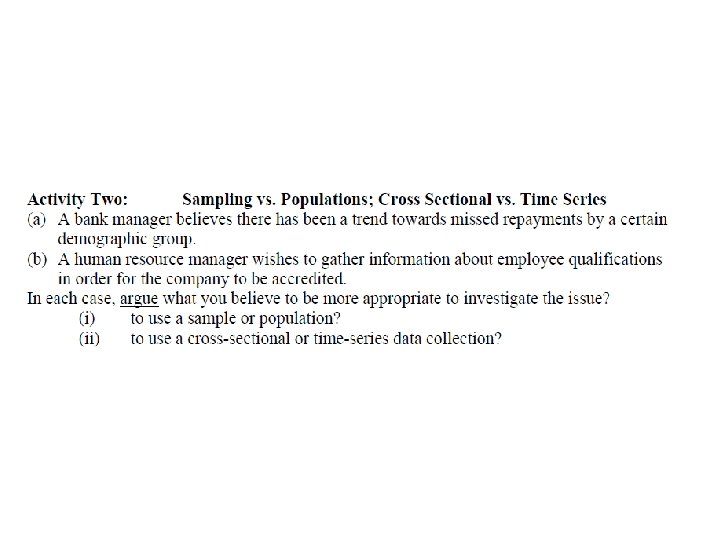
In statistics we usually want to statistically analyse a population but collecting data for the whole population is usually impractical, expensive and unavailable. That is why we collect samples from the population (sampling) and make conclusions about the population parameters using the statistics of the sample (inference) with some level of accuracy (confidence level). A population is a collection of all possible individuals, objects, or measurements of interest. A sample is a subset of the population of interest.

Business Statistics Data Classification Summary Data Timing Time-Series Cross-Sectional Data Type Qualitative / Categorical Quantitative / Numerical Data Measurement Scales 9 Nominal Ordinal Interval Ratio

Cross-Section vs Time-series Cross-Section data is collected at one point in time Business Statistics Time-series data is collected overtime 10 Example: Analysis of stock price on 14 th April 2000 Example: Collecting and analyzing stock price on 14 th April for year 2000, 2001… 2008!

Maths Study Center @ CB 04. 03. 331 Free drop-in one on one consultation tutoring on math/stats related questions 11 am to 5 pm on weekdays
, when there")
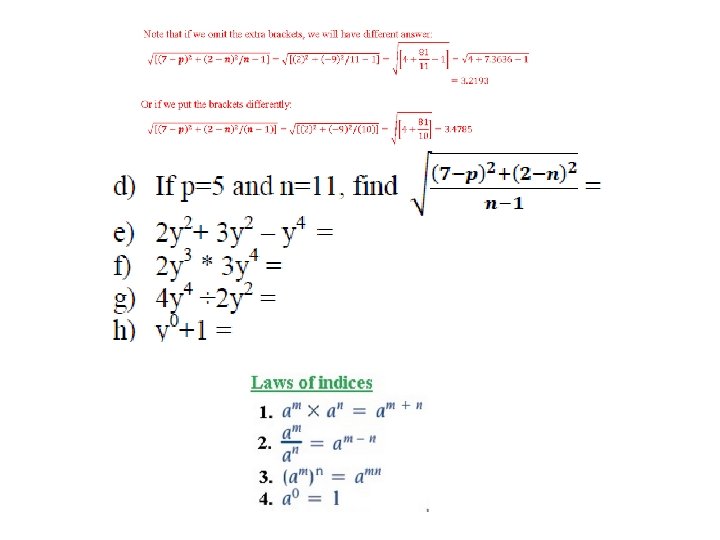
BIDMAS: Brackets, Indices, Division and Multiplication, Addition and Subtraction NOTE: in b), when there is a divisor line, it instructs you to treat the quantity above the numerator as if it were enclosed in a parenthesis, and to treat the quantity below the numerator as if it were enclosed in yet another parenthesis.

NOTE: this is a very fundamental concept and often very handy to simplify and solve problems. From decimals to percentage, multiply by 100. From decimals to fractions, divide the decimal form by 1 then multiply top and bottom of this fraction by the value that will give us an integer in the numerator. (For example, if there are two numbers after the decimal point, then use 100, if there are three then use 1000, etc. ). Then simplify the fraction.

NOTE: this is a very fundamental concept and often very handy to simplify and solve problems. From decimals to percentage, multiply by 100. From decimals to fractions, divide the decimal form by 1 then multiply top and bottom of this fraction by the value that will give us an integer in the numerator. (For example, if there are two numbers after the decimal point, then use 100, if there are three then use 1000, etc. ). Then simplify the fraction.

Because superscripted exponents like 107 cannot always be conveniently displayed, the letter E is often used to represent "times ten raised to the power of" (which would be written as "× 10 n") and is followed by the value of the exponent; in other words, for any two real numbers m and n, the usage of "m. En" would indicate a value of m × 10 n.

NOTE: To find out why 0!=1 go to http: //mathforum. org/library/drmath/view/57128. html

On the calculator:

SEE YOU ALL NEXT WEEK! PLEASE COME BACK Mahrita. Harahap@uts. edu. au UTS CRICOS PROVIDER CODE: 00099 F
- Slides: 20