26 th ECRS 35 th RCRC 06 July


, which produced")


")


")

")


, pfu")
, pfu R 2 = 0, 9725 E, Me. V")


- Slides: 41
26 th E+CRS / 35 th RCRC 06 July 2018 - 10 July 2018 Altai State University Solar activity and cosmic ray variations in September, 2017 Makhmutov V. , Kalinin E. , Bazilevskaya G. , Philippov M. , Stozhkov Y. Lebedev Physical Institute RAS, Moscow
We present results of data analysis of solar activity and cosmic ray variations in September, 2017. This period characterized by the burst of the Solar flare activity on the background of the late decreasing phase of 24 th solar activity cycle. Solar protons were observed by the satellite based instruments, in the atmosphere and by the ground-based neutron monitor network. Also the significant Forbush-decrease was recorded with a number of instruments, for example - neutron monitors. Evaluation of energy spectra of solar protons
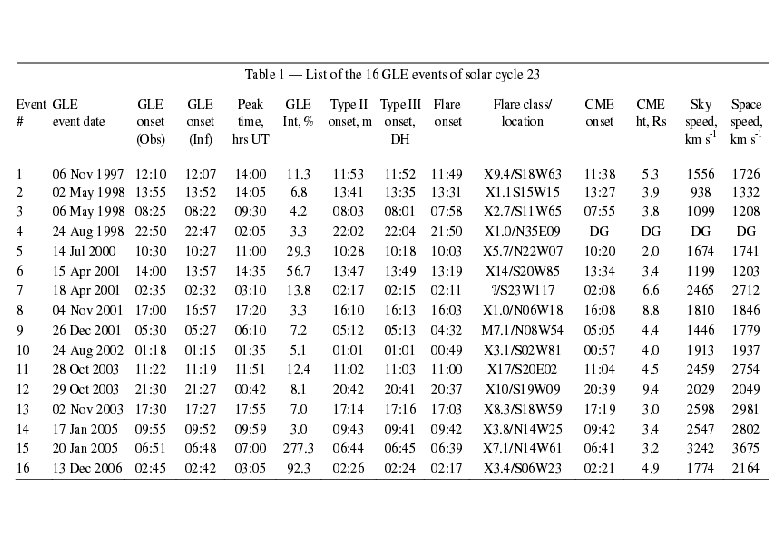
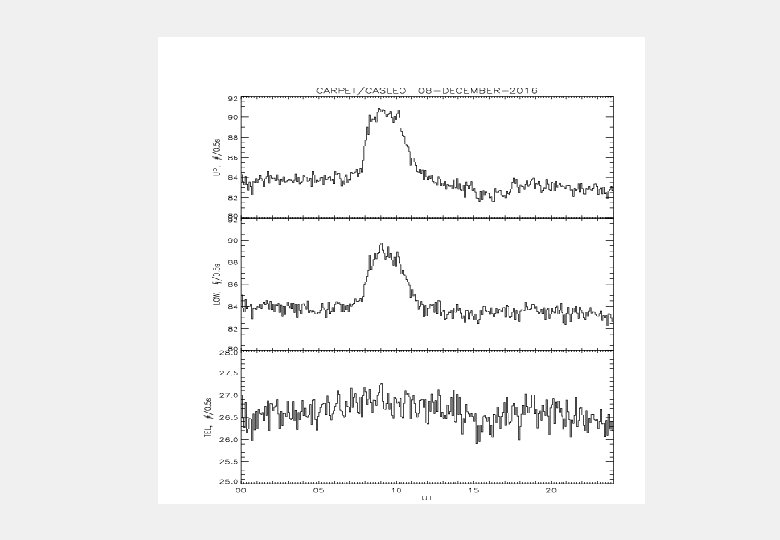
10 GLE 3 GLE Cycle 22: 1996 -07 -29 (X 2. 2), which produced the first- observed sunquake. Cycle 23: 2006 -12 -13 (X 3. 4), Cycle 24: 2017 -09 -06 (X 9. 3) 2017 -09 -10 (X 8. 2), both of which produced long-duration gammaray events (Fermi). “Spacings between the pairs of these three events of 10. 37 and 10. 74 years” (Hugh Hudson, RHESSI Science Nuggets, 306)
http: //cosrays. izmiran. ru/
6 -10 September 2017 5
The two longduration gammaray events observed towards the end of Cycle 24, courtesy the RHESSI Browser and [Fermi].
28 -OCT-2003 10 -SEP-2017 8
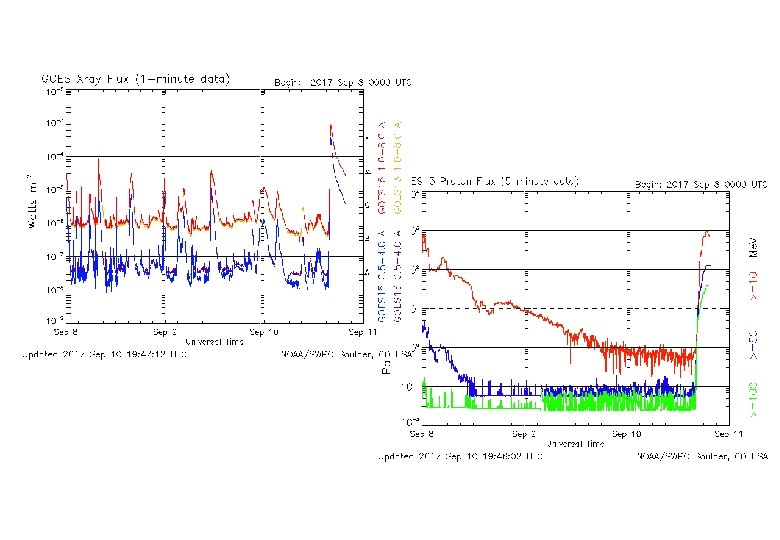
Integral p-fluxes GOES 13 1, 00 E+04 - Mirny - Apatity - NM 1, 00 E+03 1, 00 E+02 >10 Me. V 1, 00 E+01 > 30 1, 00 E+00 > 50 1, 00 E-01 > 60 September 2017 1, 00 E-02 10 11 12 13 14 15 16 > 100 Me. V
Cosmic rays in the atmosphere (Lebedev Physical Institute balloon measurements)
Apatity, Rc = 0, 65 Gv Preflight background belongs to GCR. X – atmospheric depth. Ep ≈ 100 Me. V
Mirny, Rc = 0, 03 Gv Counting rate of the fluxes of charged particles in the atmosphere. Flying height up to 25 -30 km.
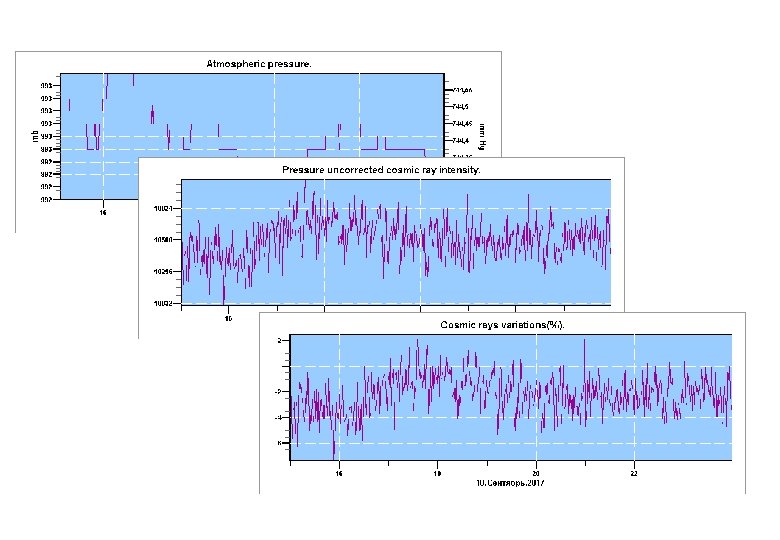
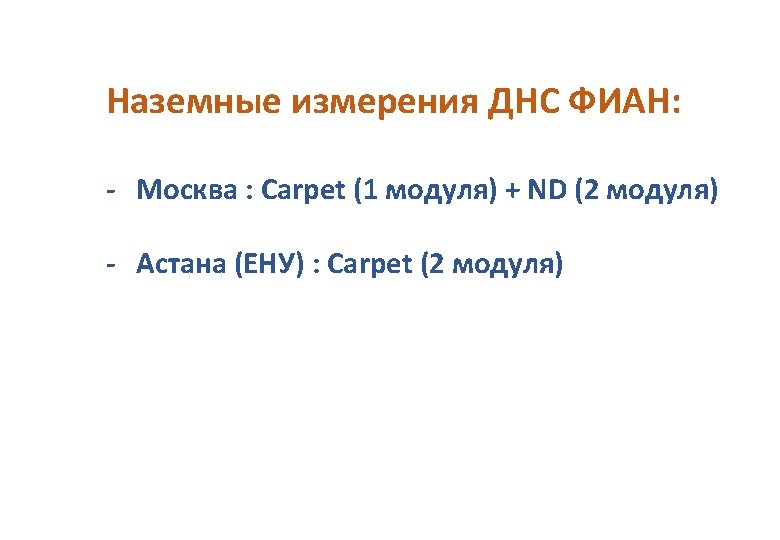
NM - observations (nmdb. eu)
Short observation of ground based neutron monitors. 0. 10 0. 30 0. 65 3. 64 3. 84 6. 69
NM MOSCOW (IZMIRAN)
Thule R = 0. 30, Terre Adelie R = 0. 01 7 % Thule NM 6 5 Terre Adelie 4 3 2 1 0 -1 -2 -3 10, 5 10, 7 10, 9 11, 1 11, 3 September 2017 11, 5 11, 7 11, 9
Evaluation solar proton spectra
LPI balloon experiment, result of simultaneous measurements Mirny: 1 - 11 Sept. , 08: 31 -09: 22 UT 2 - 13 Sept. , 08: 52 -09: 15 UT 1 a 1 2 2 a Apatity: 1 a - 11 Sept. , 12: 34 -13: 07 UT 2 b - 13 Sept. , 12: 46 -13: 06 UT
E, Me. V J(>E), pfu
J(>E), pfu R 2 = 0, 9725 E, Me. V
TOM spectrum of Solar protons, 10 September 2017 1 E+04 1 E+03 1 E+02 G 13 1 E+01 NM PFU 1 E+00 1 E-01 1 E-02 1 E-03 1 E-04 1 E-05 1 E-06 10 100 E, Me. V 10000
SUMMARY We present results of data analysis of solar activity and cosmic ray variations in September, 2017. This period characterized by the burst of the SEP activity on the background of the late decreasing phase of 24 th solar activity cycle. Solar protons were observed by the satellite based instruments, in the atmosphere and by the ground-based neutron monitor network. Also the significant Forbush-decrease was recorded with a number of instruments, e. g. neutron monitors. Spectra of Solar protons were obtained: 10 -100 Me. V - y = 1248. 8 e-0. 04 E 100 -500 Me. V - y = 3 E+09 E-4. 0 > 500 Me. V - y = 1 E+19 E-7. 7
Thank you!
GOES + Stratosphere + NM data
NMDB network
10 September 2017, NMs
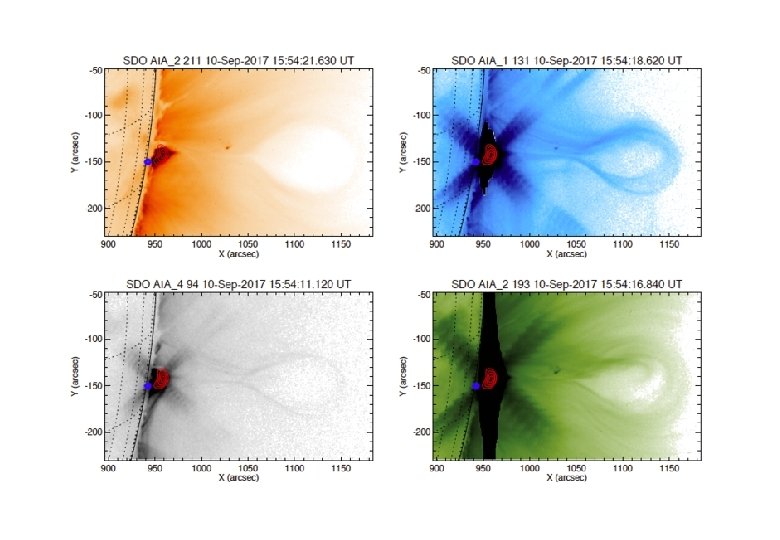
Solar flare activity in September, 2017 Säm Krucker , Hugh Hudson , RHESSI Nugget, 306, 11 September 2017: 2 major X-class flares in the waning phase of Solar Cycle 24. This happened in previous cycles: - Cycle 22: SOL 1996 -07 -29 (X 2. 2), which produced the first-observed sunquake. - Cycle 23: SOL 2006 -12 -13 (X 3. 4), with its white-light continuum remarkably well documented by [Hinode] (Ref. [2]). - Cycle 24: ended Cycle 24's major flare activity with SOL 2017 -09 -06 (X 9. 3) SOL 2017 -09 -10 (X 8. 2), both of which produced long-duration ɣ-ray events observed by Fermi.
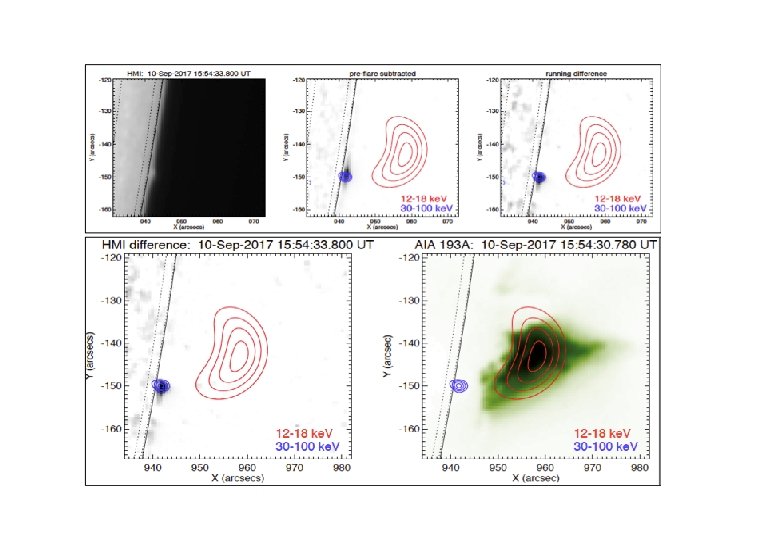
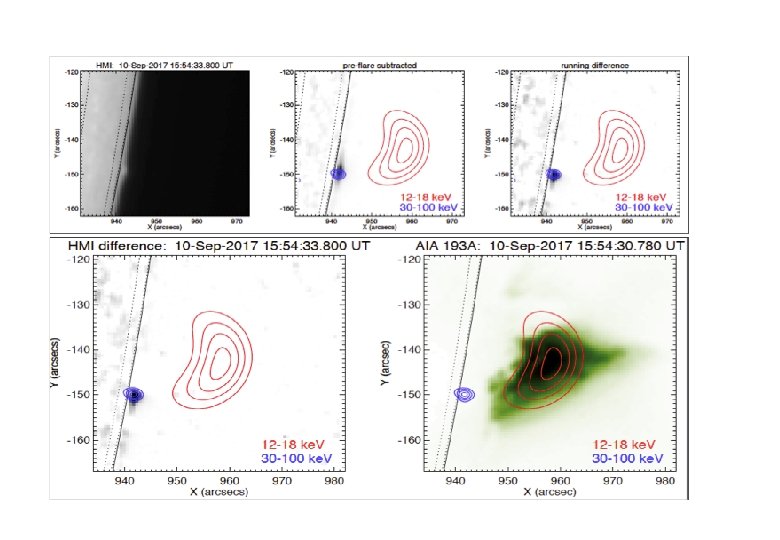
Remarkably, the spacings between the pairs of these three events were similar to the recent mean solar-cycle duration of 11. 1 years (at separations of (10. 37 and 10. 74 years, respectively, shorter by only a few percent). While not very significant, these spacings are eerie - in each of the last three cycles, a "last best" event has happened, and at almost exact intervals. RHESSI Observation: RHESSI got excellent observations of SOL 2017 -09 -10, as illustrated in Figure 1. The flare was almost exactly at the limb, apparently such that one ribbon was entirely occulted and the other partially so, but still nicely showing both white-light flare continuum and hard X-rays with the same precise coincidence seen in events on the disk, confirming the 3 D nature of this identification. Figure 1: Imaging observations of SOL 2017 -09 -10 at high resolution. Upper panel, comparisons of RHESSI hard X-rays with the HMI white-light flare observation (footpoint); bottom panel, same RHESSI images compared with AIA 193 Å (looptop). This flare also produced a textbook example of CME ejection and the generation of a global wave. Figure 2 illustrates the canonical plasmoid/current-sheet pattern most clearly, with the very linear current-sheet EUV enhancement pointing straight at the loops seen by RHESSI and AIA. Figure 2: SOL 2017 -09 -10 produced a massive, fast CME, and in its wake this textbook-clear example of plasmoid and current sheet trailing it. Note the beautiful diffraction spikes produced by AIA's grids. This can be exploited in principle to increase the image dynamic range and also to provide spectral information.
10. 09. 2017 http: //nasa. com
Outline - peculiarities of solar flare activity in September, 2017 - cosmic ray variations observed onboard satellite, in the atmosphere and by NM network - evaluation of energy spectra of solar protons
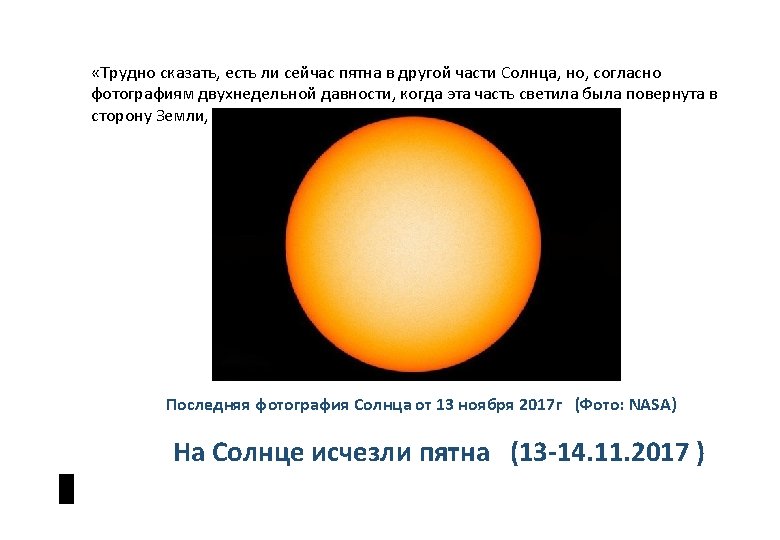
No sunspots during 13 -14 November 2017