250 000 200 000 150 000 100 000


 90 000 하절기, 동절기")

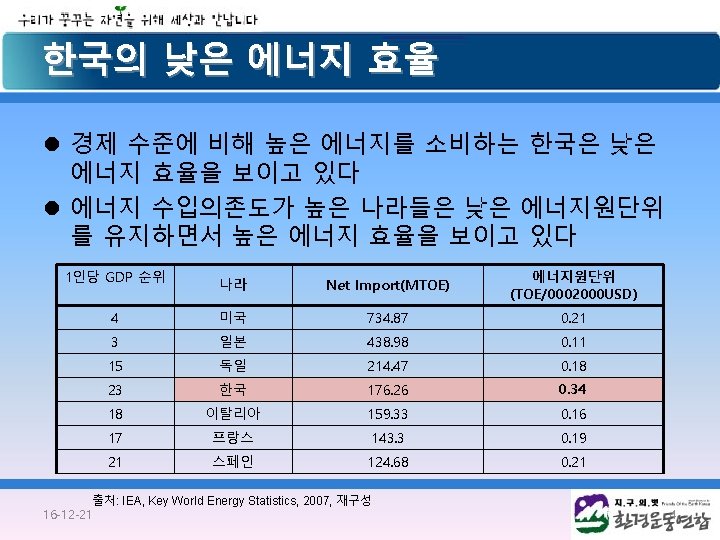
 powersoldsa")
 Units ARMENIA")
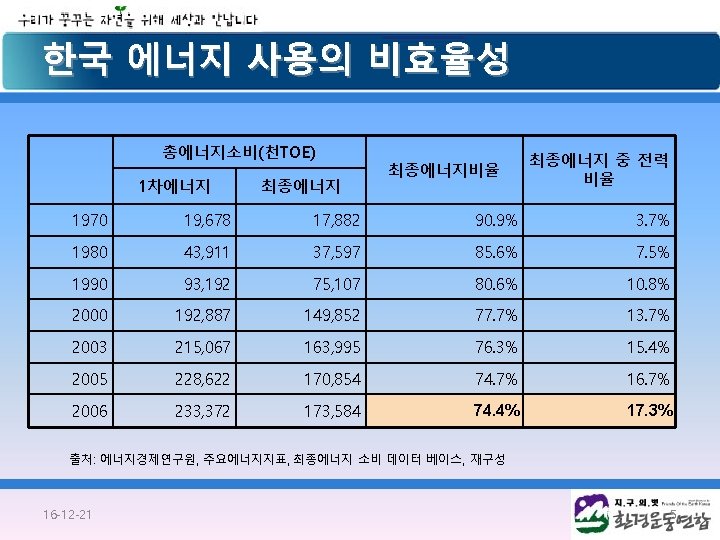
 Nuclear assumed to see 4 -fold increase, from today’s")
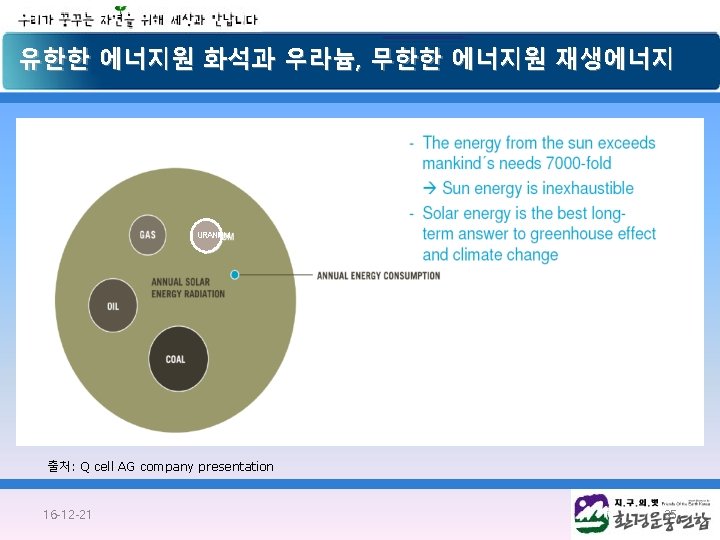


 출처: The Nuclear Illusion, Amory")


- Slides: 74
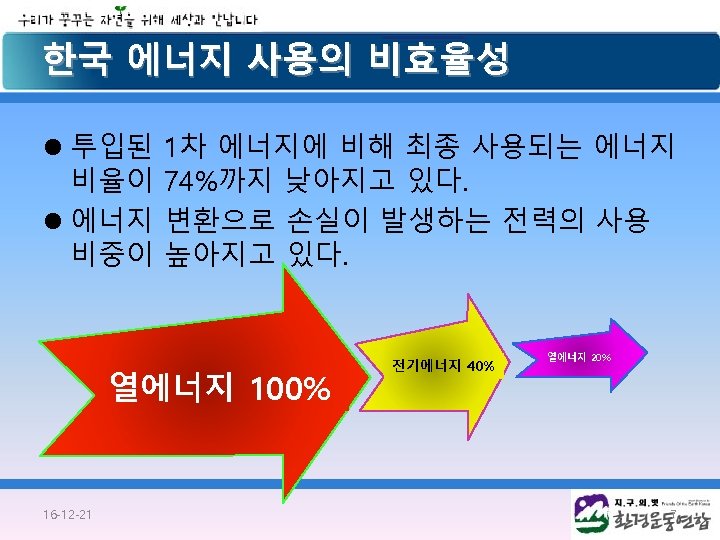
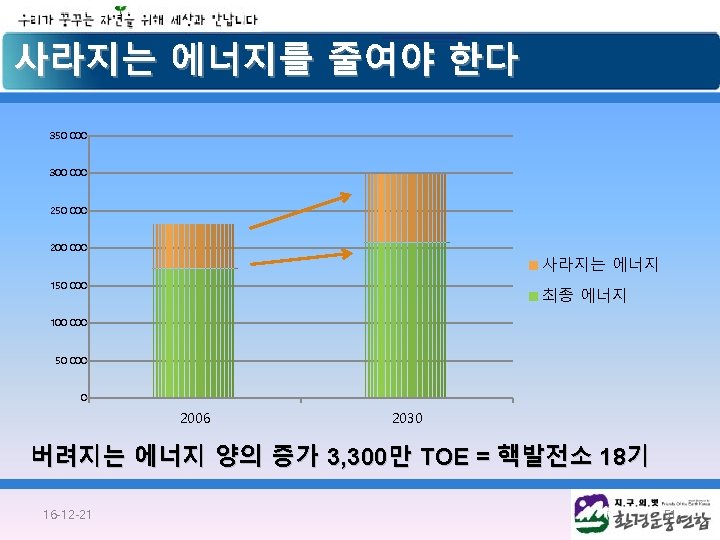
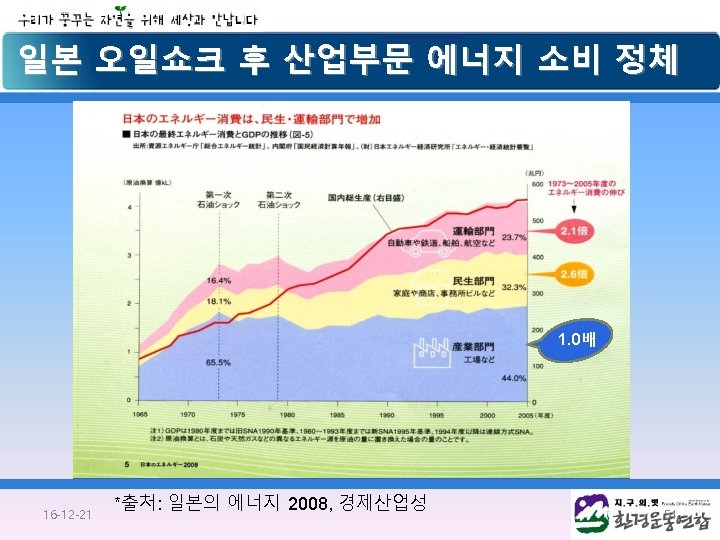
사라지는 에너지가 늘어난다 250 000 200 000 150 000 사라지는 에너지 최종 에너지 100 000 50 000 0 1970 16 -12 -21 1980 1990 2003 2005 2006 6
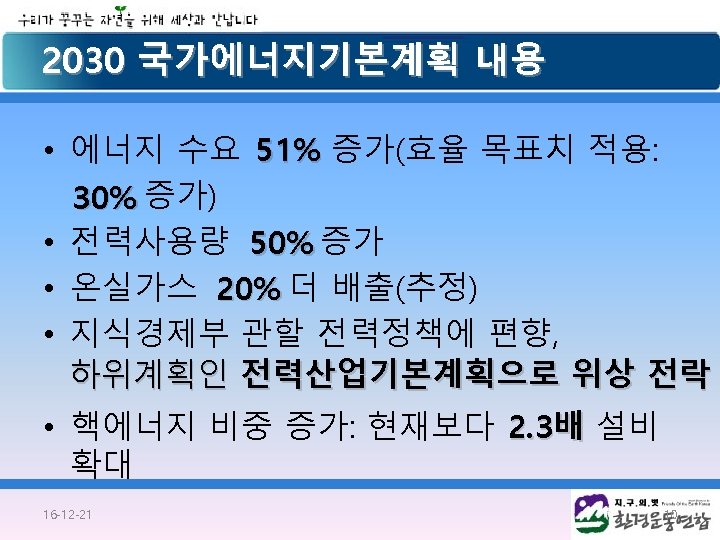
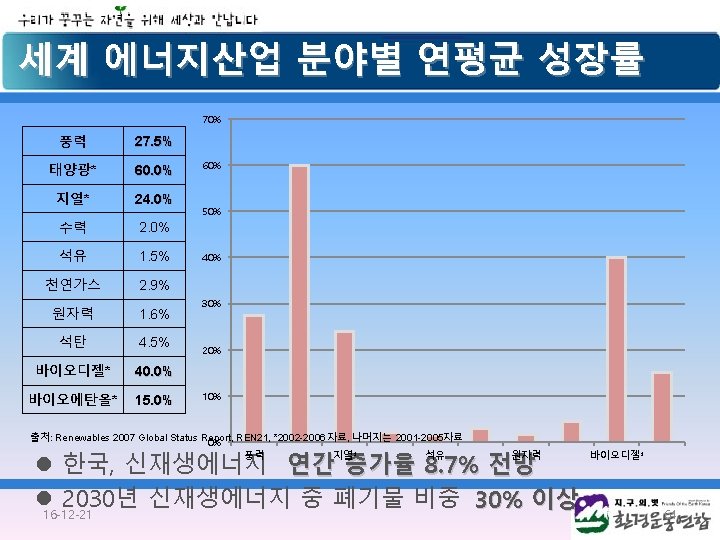
과도한 수요전망예측: 언제까지나 에너지 수요 증가 400 000 350 000 51% 300 000 30% 250 000 200 000 150 000 100 000 50 000 1차 에너지 소비 에너지 수요 기준안('06~'30) 에너지 수요 목표안('06~'30) 19 68 19 70 19 72 19 74 19 76 19 78 19 80 19 82 19 84 19 86 19 88 19 90 19 92 19 94 19 96 19 98 20 00 20 02 20 04 20 06 20 08 20 10 20 12 20 14 20 16 20 18 20 20 20 22 20 24 20 26 20 28 20 30 0 16 -12 -21 11
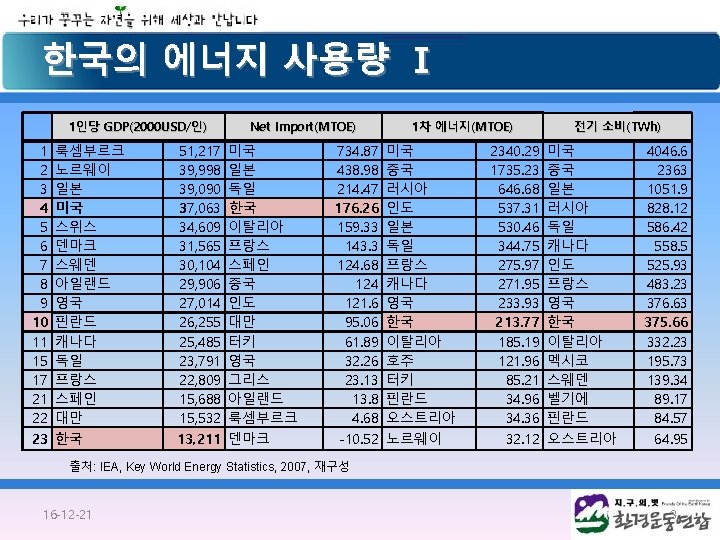
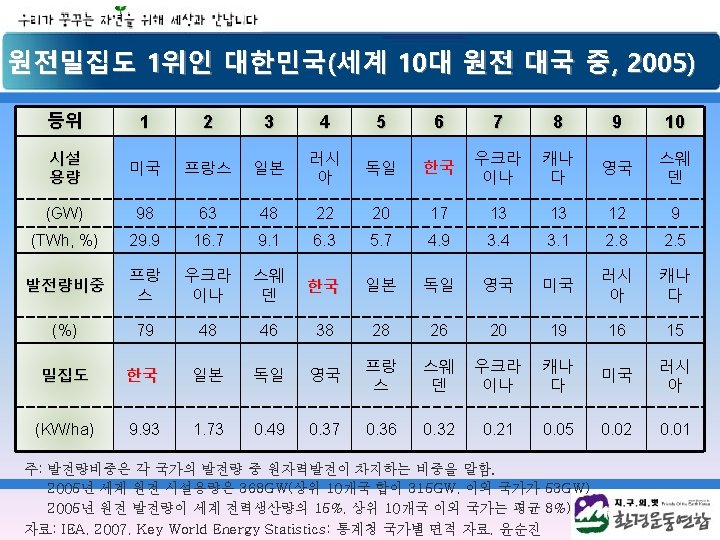
여전히 에너지 다소비 국가를 고집하는 한국 한국 독일 일본 2005 2030 1인당 GDP (2000 USD/인) 13, 211 31, 682 23, 791 연간 2. 9% 증가 39, 090 - 1인당 에너지 소비 (TOE/인) 4. 43 6. 18 4. 18 3. 65 4. 15 35% 효율증가 에너지원단위 (TOE/000200 USD) 0. 347 0. 185 0. 18 0. 11 0. 0715 주요 경제 지표와 에너지 지표 전망 출처: <Ew. I/ Prognos-Study The Trend of Energy Markets Up to the year 2030, Reference Forecast for the Energy Sector Energy Report Ⅳ-Summary>, Documentation No 545, May 2005, Federal Ministry of Economics and Labour , IEA, Key World Energy Statistics, 2007, 일본의 에너지 2008, 경제산업성, 재구성 16 -12 -21 12
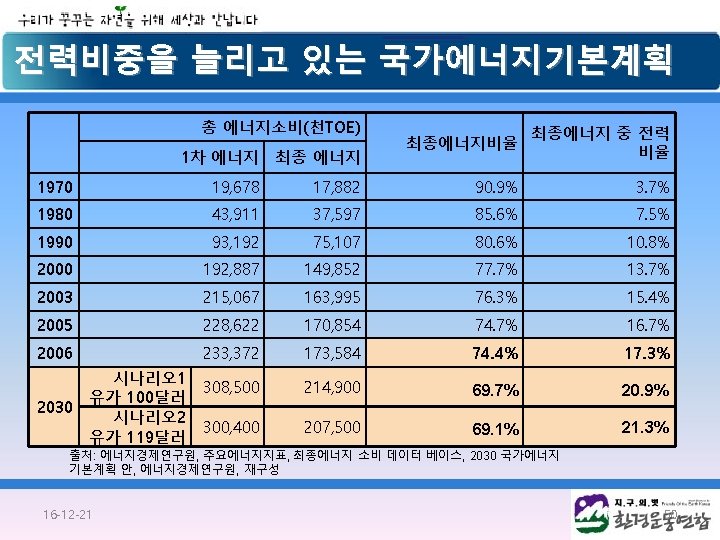
전력비중을 늘리고 있는 국가에너지기본계획 350 000 45 000 300 000 40 000 250 000 35 000 30 000 200 000 25 000 150 000 1차에너지 전망 100 000 전력 전력수요 전망 20 000 15 000 10 000 5 000 0 1968 1970 1972 1974 1976 1978 1980 1982 1984 1986 1988 1990 1992 1994 1996 1998 2000 2002 2004 2006 2008 2010 2012 2014 2016 2018 2020 2022 2024 2026 2028 2030 0 16 -12 -21 2030년 1차에너지 수요전망과 전력수요전망 비교 (단위: 천TOE) 출처: 2030 국가에너지 기본계획 안, 에너지경제연구원, 2008 재구성 14
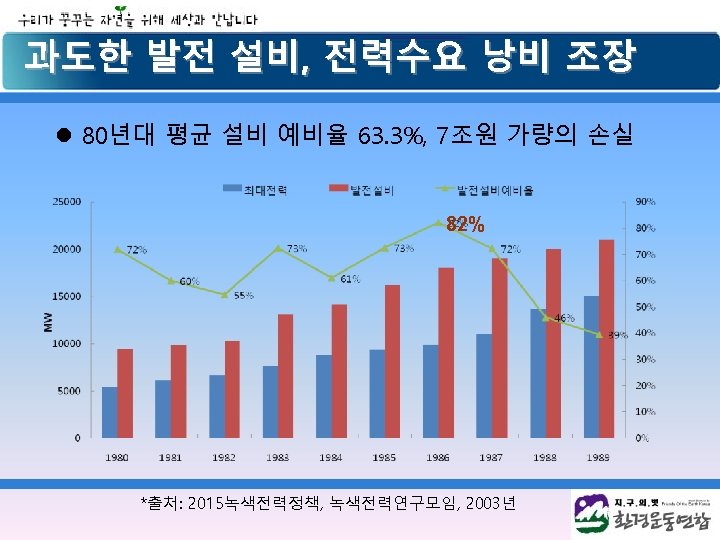
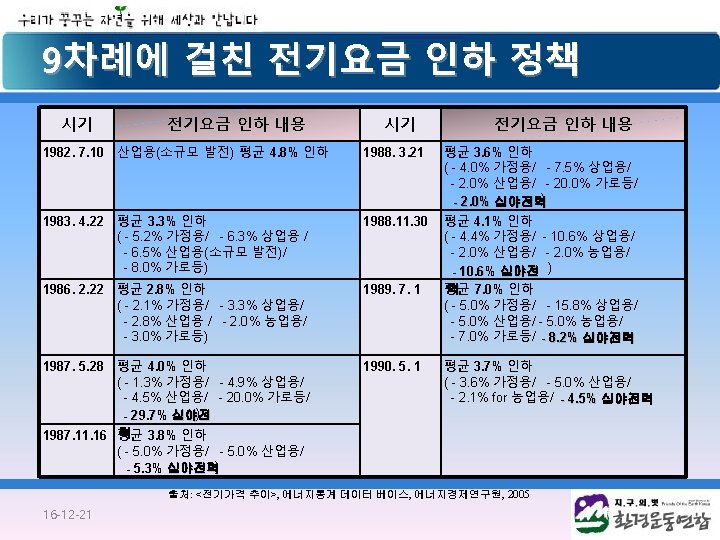
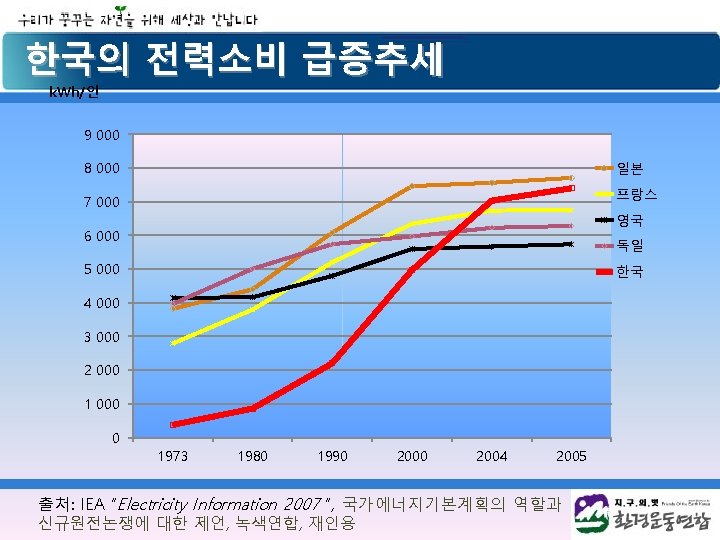
잘못된 전력정책이 전력소비를 부추긴다 GWh 100 000 Power Sold (sa) 90 000 하절기, 동절기 피크 발생 시작 80 000 70 000 심야전력정책 시작 60 000 50 000 9차례의 전력가격 인하 40 000 30 000 20 000 16 -12 -21 /1 04 20 /1 02 20 /1 00 98 19 분기별 전력판매량과 정부의 정책 개입 출처: Empirical Study: Correlation between Electricity Demand Economic Development, Won-Young Yang. Yi, 2005 20 /1 /1 96 19 /1 94 19 /1 92 19 /1 90 19 /1 88 19 /1 86 19 /1 84 19 /1 82 19 /1 80 19 /1 78 19 /1 76 19 /1 74 19 72 19 19 70 /1 /1 0
겨울철 전력수요 급증으로 동계피크 발생 16 -12 -21 계절별 전력판매량 연간 변화 추이 출처: Empirical Study: Correlation between Electricity Demand Economic Development, Won-young Yang. Yi, 2005 20
정책 개입 전후의 전력 소비 변화 GWh 100 000 powersoldsa 21 hat(~1982: Ⅱ) powersoldsa 22 hat(1982: Ⅲ~1990: Ⅱ) powersoldasa 23 hat(1990: Ⅲ~) 80 000 60 000 증가율 2배 상승 40 000 1982: Ⅲ 1982: Ⅱ ~1990: Ⅱ 20 000 1990: Ⅲ /1 04 20 /1 02 /1 20 00 20 /1 98 19 /1 96 19 /1 94 19 /1 92 19 /1 90 19 /1 88 /1 19 19 86 /1 84 19 /1 82 19 /1 80 19 /1 78 19 /1 76 19 /1 74 19 /1 72 19 19 70 /1 0 -20 000 -40 000 정책 개입 전후의 관련 방정식 (4 -6), (4 -7), (4 -8)의 그래프 출처: Empirical Study: Correlation between Electricity Demand Economic Development, Wonyoung Yang. Yi, 2005 21
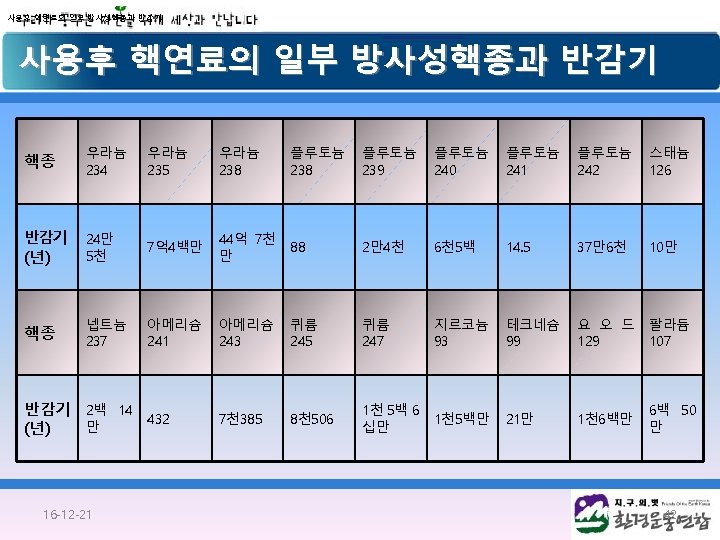
폐쇄된 핵발전소 119기, 곧 폐쇄될 핵발전소 300여기 Country No. of Total MW(e) Units ARMENIA 1 376 BELGIUM 1 11 BULGARIA 4 1632 CANADA 3 478 FRANCE 11 3951 GERMANY 19 5944 ITALY 4 1423 JAPAN 3 320 KAZAKHSTAN 1 52 LITHUANIA, REPUBLIC OF 1 1185 NETHERLANDS 1 55 RUSSIAN FEDERATION 5 786 SLOVAK REPUBLIC 2 518 SPAIN 2 621 SWEDEN 3 1225 UKRAINE 4 3500 UNITED KINGDOM 26 3324 UNITED STATES OF AMERICA 28 9764 119 35165 Total: 출처: PRIS database. Last updated on 2008/07/01 원자로 평균 수명 23년 33
신규 핵발전소 건설 전망(GP International) Nuclear assumed to see 4 -fold increase, from today’s 2, 700 TWh/year to 9, 860 TWh/year in 2050. This means building 1, 400 new large reactors between 2010 and 2050 - 32 every on average for 40 years Average on past ten years is 3 large reactors. Theoretical capacity is about 6 blocks a year worldwide. Even in its “best” decade 1980 s the nuclear industry had a rate 16 large reactors. Ref: International Energy Agency, Energy Techologies Perspectives 2008, June 2008
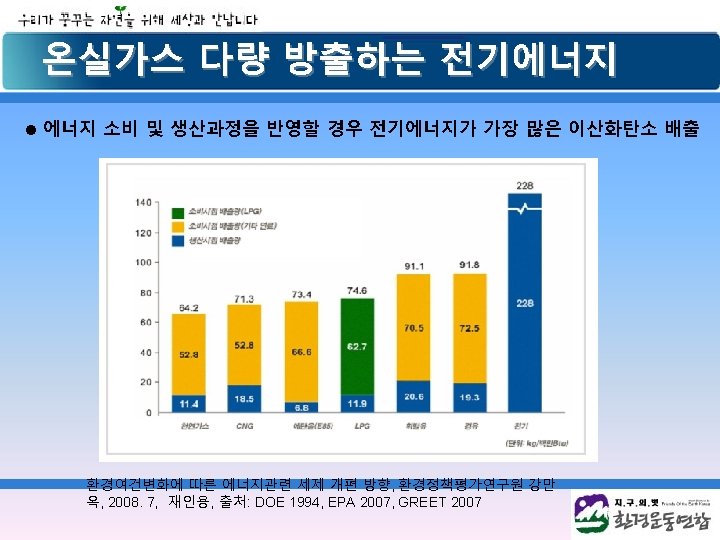
전 과정 평가를 통한 발전원별 이산화탄소 발생량 비교 66 출처: Valuing the greenhouse gas emissions from nuclear power: A critical survey. Benjamin K. Sovacool. 2008. Energy Policy. pp 2950 -2963
핵발전이 아닌 효율과 재생에너지가 기후변화를 막는다 Scenario that looks for ways to keep warming below 2° C: (6%) 출처: International Energy Agency, Energy Techologies Perspectives 2008, June 2008, Greenpeace International, 재인용
온실가스 줄이는 화력발전 대체 발전원 비교 출처: The Nuclear Illusion, Amory B. Lovins and Imran Sheikh, 2008. May 16 -12 -21 39
신규 건설 시 발전원별 단가 비교(MIT, keystone 연구소 연구) 출처: The Nuclear Illusion, Amory B. Lovins and Imran Sheikh, 2008. May 16 -12 -21 43
경제 발전이 에너지 수요를 줄일 수 있다 경제성, 안정성, 친환경 독일의 실질 GDP와 1차 에너지 소비증가 출처: <Ew. I/ Prognos-Study The Trend of Energy Markets Up to the year 2030, Reference Forecast for the Energy Sector Energy Report Ⅳ-Summary>, Documentation No 545, May 2005, Federal Ministry of Economics and Labour 16 -12 -21 47
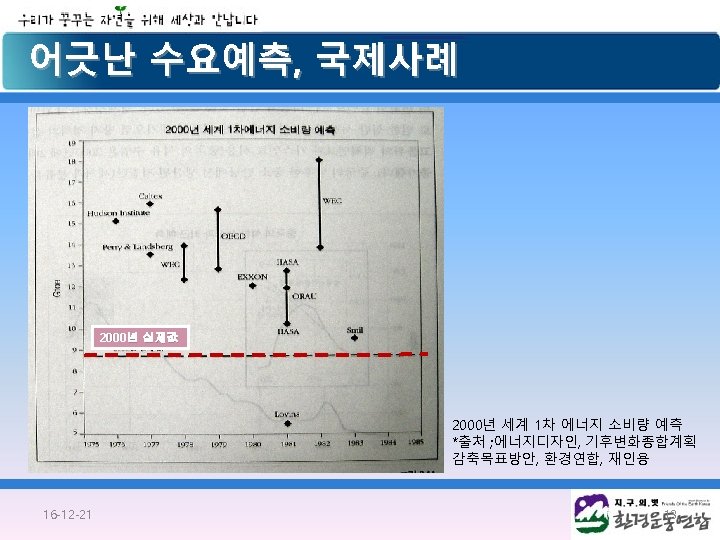
수요예측 정점: 고효율 사회를 준비해야 한다 400 000 350 000 300 000 250 000 1차 에너지 소비 200 000 에너지 수요 기준안('06~'30) 에너지 수요 목표안('06~'30) 150 000 2015년 정점 전망 100 000 50 000 16 -12 -21 에너지경제연구원 수요전망과 에너지소비 포화전망안 비교 출처: 국가에너지 기본계획 안, 에너지경제연구원, 2008, 에너지수요예측및 실수요 비교와 202020안, 환경연합 재구성 2030 2028 2026 2024 2022 2020 2018 2016 2014 2012 2010 2008 2006 2004 2002 2000 1998 1996 1994 1992 1990 1988 1986 1984 1982 1980 1978 1976 1974 1972 1970 1968 0 48
산업부문의 에너지 효율 점검 16 -12 -21 시멘트 산업에서의 에너지 효율 국제 비교 *출처 Tracking Industrial Energy Efficiency and CO 2 Emission, IEA, 2007 57
중국도 2030년에 재생가능에너지 비중 20% EU 영국 독일 일본 중국 2010 12% - 8. 4% (2006년 12% 달성) - - 2020 20% 15. 7% (2007년 14% 달성) - 16% 2030 - - 25. 1% 10% 2050 50%(2040) - 48. 5% - - *출처: 제 4기 지속가능발전위원회, 에너지산업전무위원회 회의자료 2007. 6. 27, 신·재생에너지 보급목표 수립 전략, 에너지관리공단 신재생에너지센터, <Ew. I/ Prognos-Study The Trend of Energy Markets Up to the year 2030, Reference Forecast for the Energy Sector Energy Report Ⅳ-Summary>, Documentation No 545, May 2005, Federal Ministry of Economics and Labour , 재구성 l 한국, 2012년 신재생에너지 5% 목표인데 2030년 11%? l 성공한 정책(FIT) 대신 실패한 재생에너지 정책(RPS) 도입 예정 16 -12 -21 65
세계의 발전원별 신규 발전소 착수 추이 출처: The Nuclear Illusion, Amory B. Lovins and Imran Sheikh, 2008. May 16 -12 -21 67
16 -12 -21 68 70 19 72 19 74 19 76 19 78 19 80 19 82 19 84 19 86 19 88 19 90 19 92 19 94 19 96 19 98 20 00 20 02 20 04 20 06 20 08 20 10 20 12 20 14 20 16 20 18 20 20 20 22 20 24 20 26 20 28 20 30 19 19 에너지 수요는 정점 후 감소될 수 있다 300 000 250 000 200 000 150 000 1차 에너지 소비 100 000 2015년 정점 전망 50 000 0 69