21 Pressure always increases as altitude decreases Pressure


- Slides: 40
21
Pressure always increases as altitude decreases Pressure increases with decreasing temperature Pressure increases with increasing temperature
22
There’s no data given in the introduction or the graph to indicate that the different strata would behave differently.
23
Range of carbohydrate % is similar The vertically migrating shrimp have a greater % of protein than lipid in all cases
24
Greater depths Non-migrating shrimp have similar water % and a higher lipid % There is less oxygen at depth and nonmigrating shrimp are found at greater depths
25
The implication of “captured at a minimum depth of 200 m” is these shrimp are found at deeper depths, but not at more shallow depths.
26
It’s either vm 1 or vm 3. vm 1 is not an option, so you don’t need to worry about calculating the absolute value
27
Oxygen pressure is below 25 mm Hg below 400 m
28
29
30
31
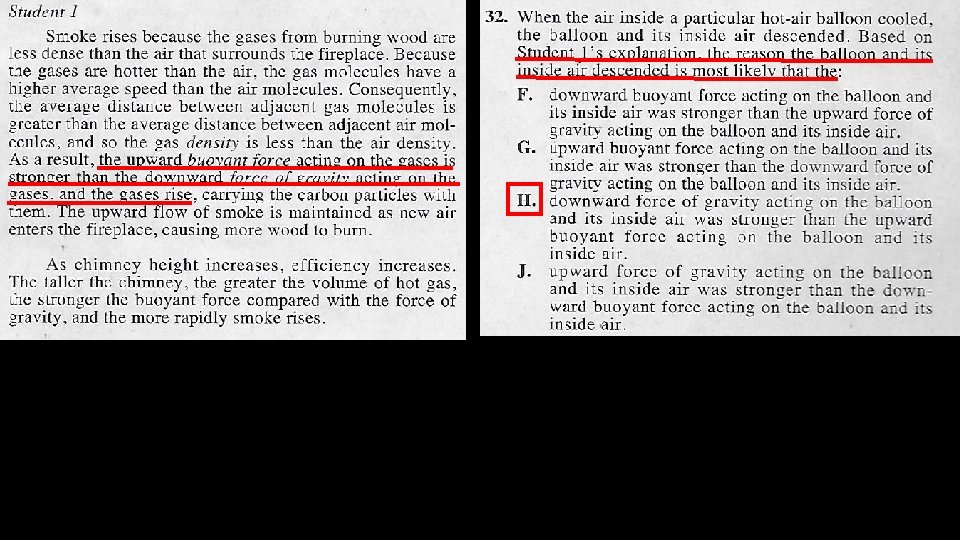
32
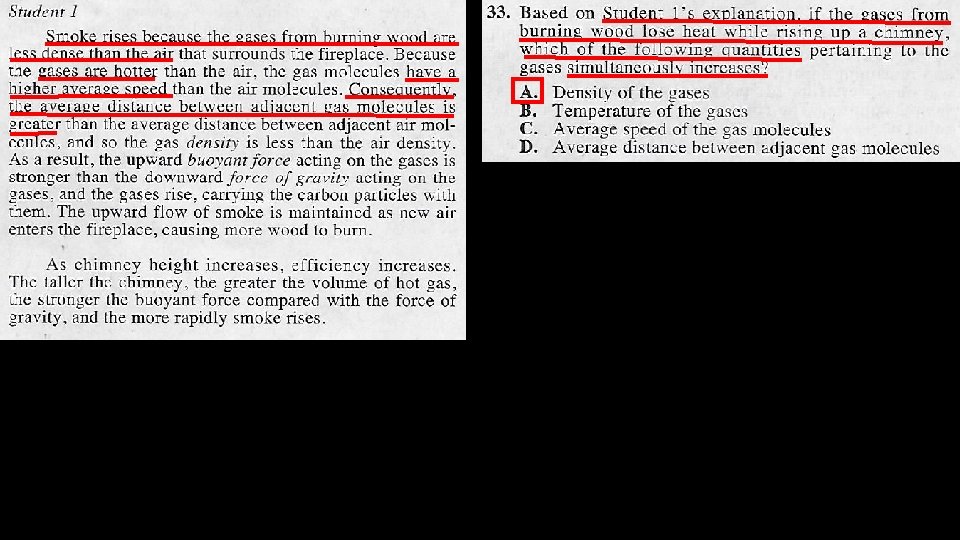
33
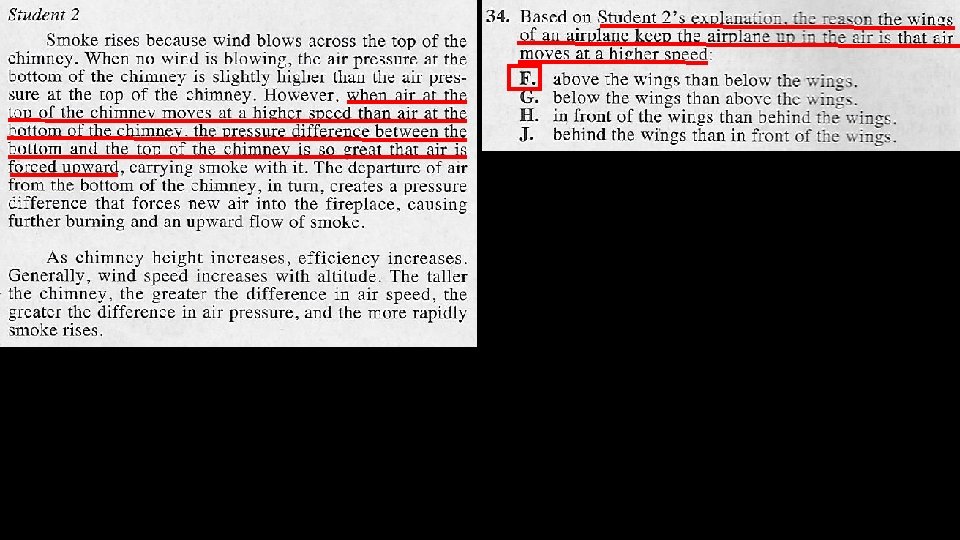
34
35
You don’t need to read the introduction or the experiment The answer can be found using the table or the graph
36
You don’t need to read experiment 2. You just need to recognize that the information you need is in Table 2 Pastrami 0. 603 The greater the NO 2 - concentration, the greater the corrected absorbance (we learned that from question #35)
37
The table or the graph will give the answer 0. 23 is the only option between 0. 153 and 0. 302 0. 23
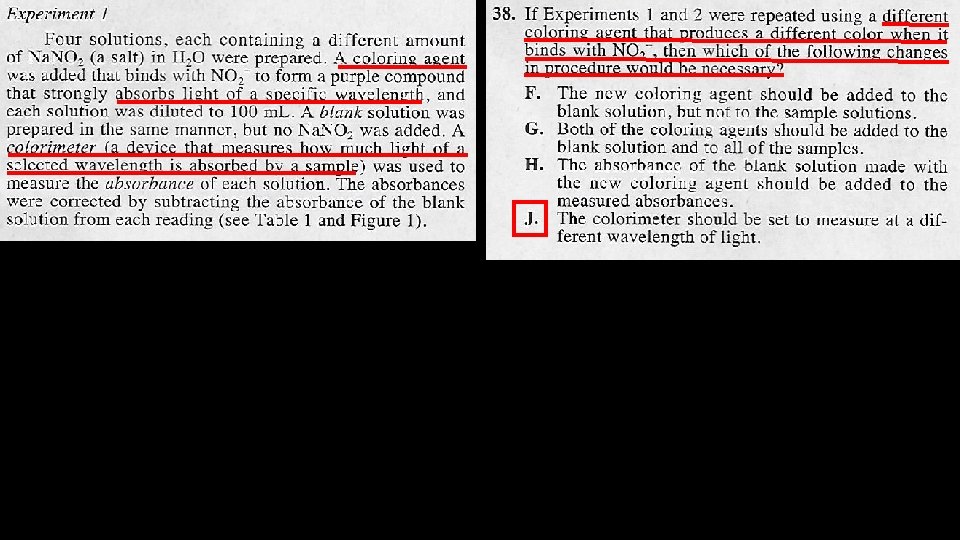
38
39
The introduction tells us that NO 2 - is added to meats Table 1 tells us that there is some level of absorbance that is unrelated to NO 2 - and absorbance increases as concentration of NO 2 increases
40
As far as we can tell by the experimental design, there was no control in place for compounds in the various meats that might absorb light at the same wavelength as the compound that forms from NO 2 and the coloring agent