2020 SPLUNK INC The Whats and Whys of
- Slides: 39

© 2020 SPLUNK INC. The Whats and Whys of Tracing Open. Telemetry FTW Dave Mc. Allister

© 2020 SPLUNK INC. Dave Mc. Allister Day 115 Senior Technical Evangelist

© 2020 SPLUNK INC. “ Data is the driving factor for Observability

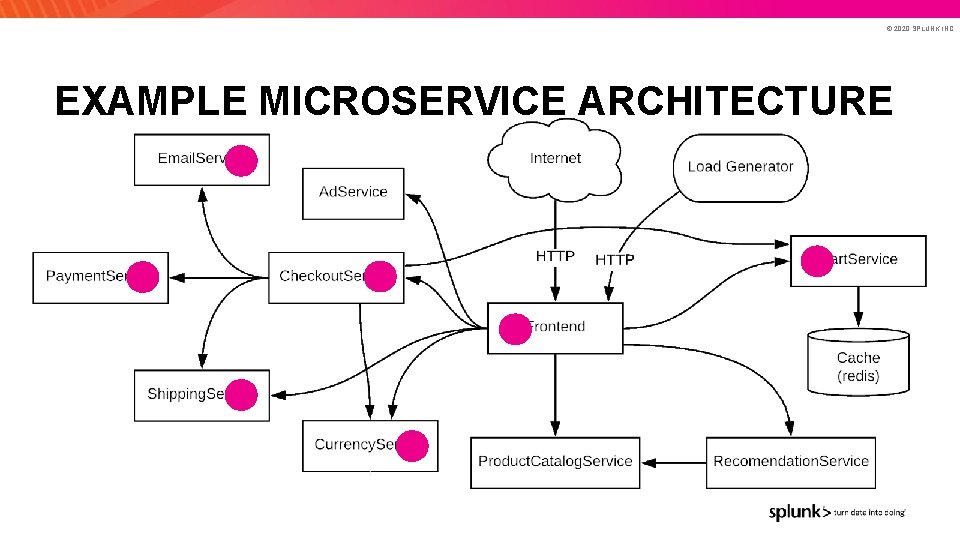
© 2020 SPLUNK INC. EXAMPLE MICROSERVICE ARCHITECTURE

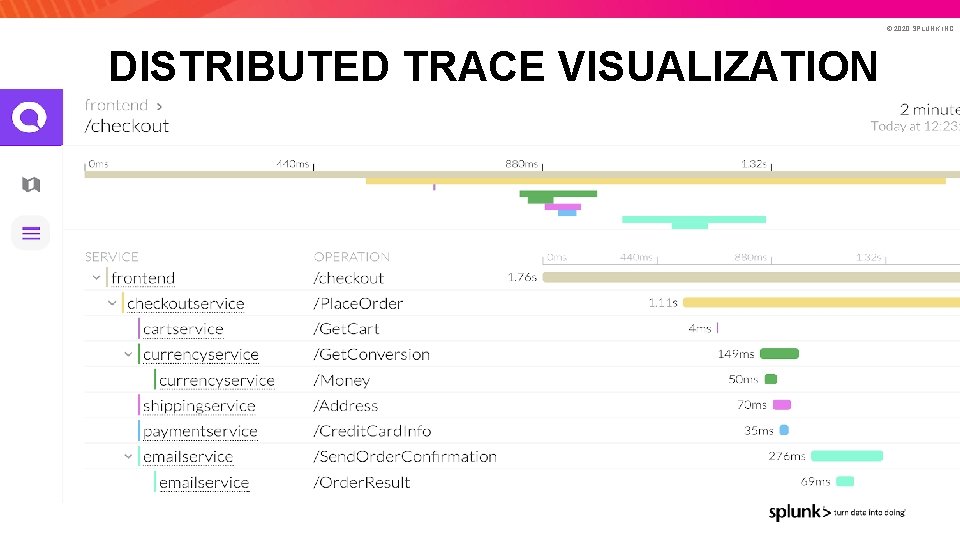
© 2020 SPLUNK INC. DISTRIBUTED TRACE VISUALIZATION

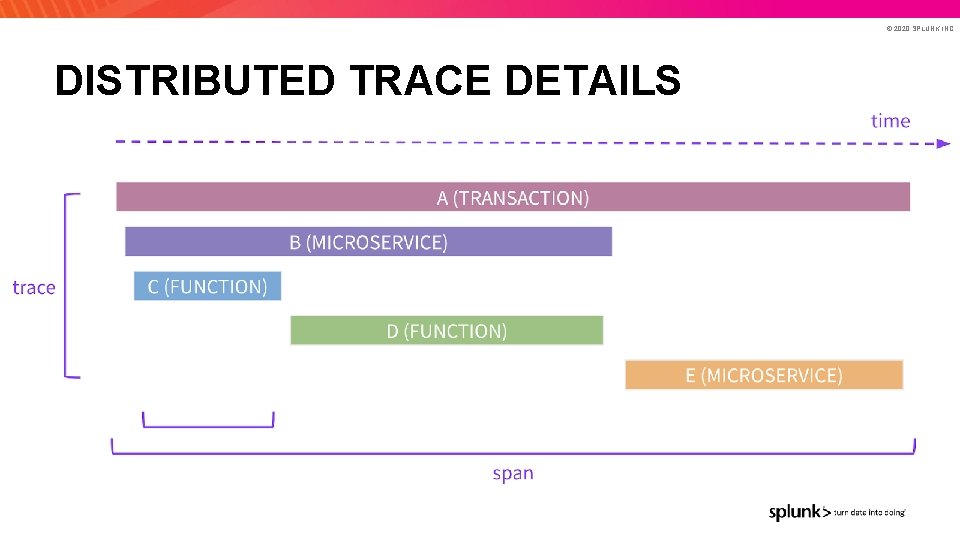
© 2020 SPLUNK INC. DISTRIBUTED TRACE DETAILS

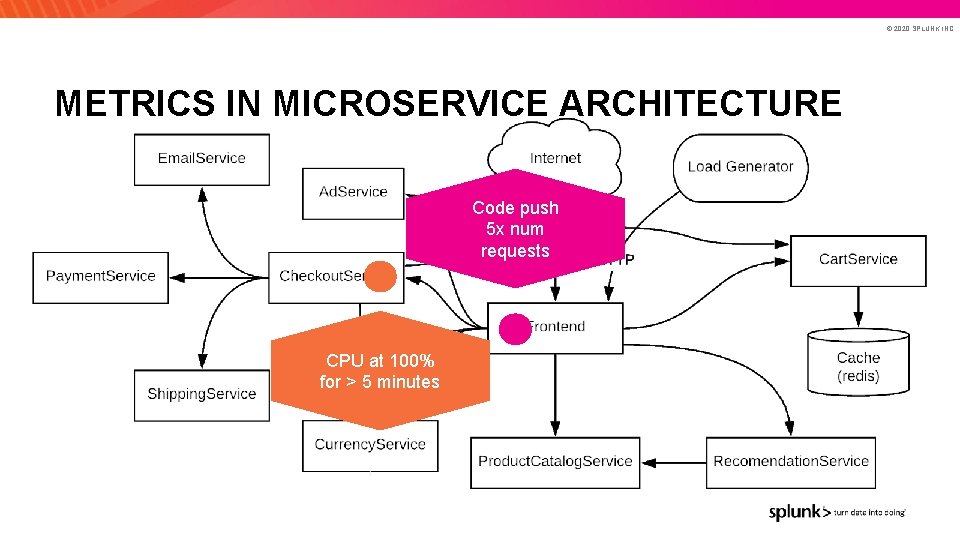
© 2020 SPLUNK INC. METRICS IN MICROSERVICE ARCHITECTURE Code push 5 x num requests CPU at 100% for > 5 minutes

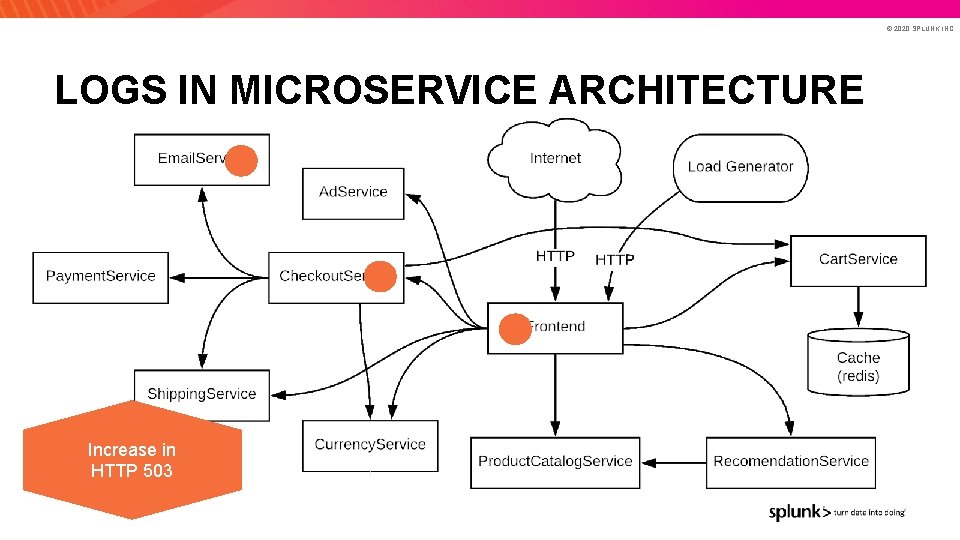
© 2020 SPLUNK INC. LOGS IN MICROSERVICE ARCHITECTURE Increase in HTTP 503

© 2020 SPLUNK INC. “ “Observability is not the microscope. It’s the clarity of the slide under the microscope. ” “ Baron Schwartz

© 2020 SPLUNK INC. Data Collection Standards-based agents, cloud-integration Automated code instrumentation Support for developer frameworks Any code, any time No cardinality limits

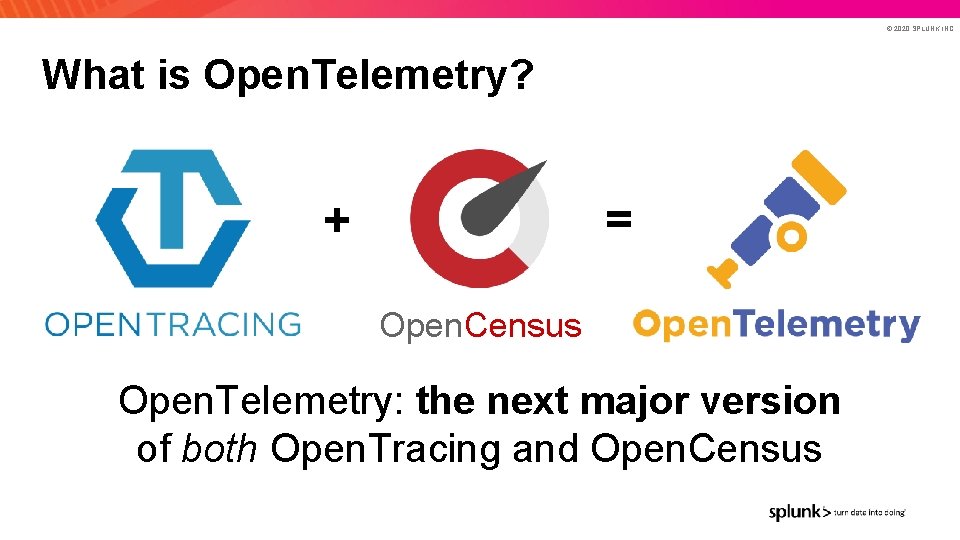
© 2020 SPLUNK INC. What is Open. Telemetry? + = Open. Census Open. Telemetry: the next major version of both Open. Tracing and Open. Census

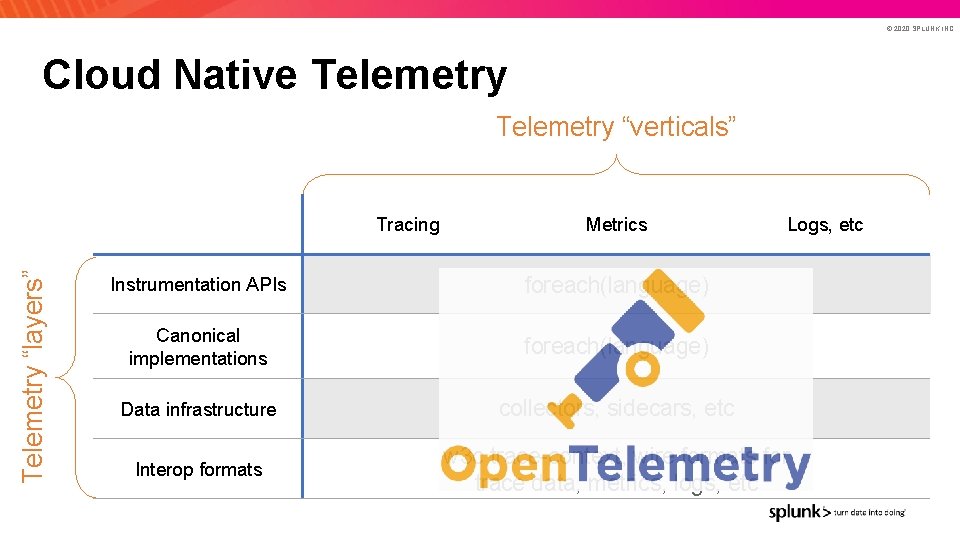
© 2020 SPLUNK INC. Cloud Native Telemetry “verticals” Telemetry “layers” Tracing Metrics Logs, etc Instrumentation APIs foreach(language) Canonical implementations foreach(language) Data infrastructure collectors, sidecars, etc Interop formats w 3 c trace-context, wire formats for trace data, metrics, logs, etc

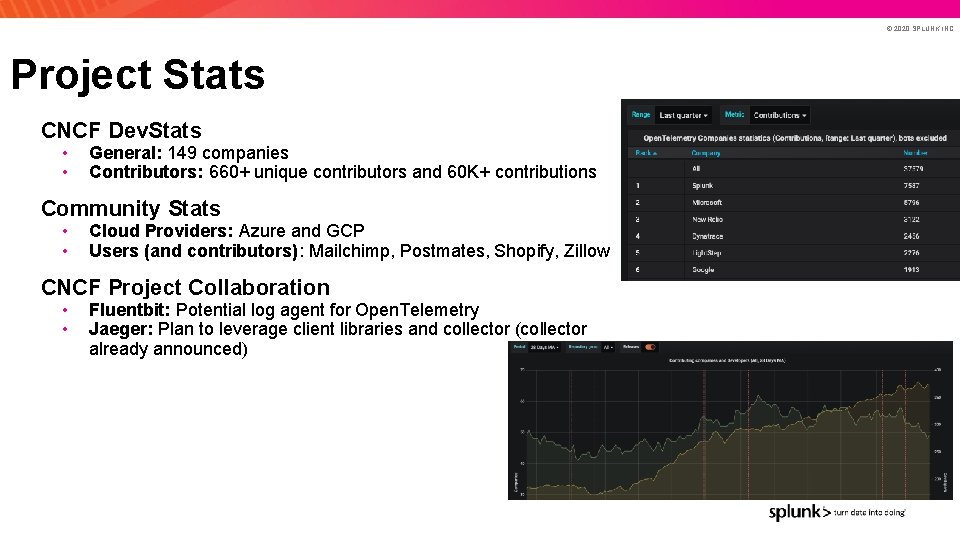
© 2020 SPLUNK INC. Project Stats CNCF Dev. Stats • • General: 149 companies Contributors: 660+ unique contributors and 60 K+ contributions Community Stats • • Cloud Providers: Azure and GCP Users (and contributors): Mailchimp, Postmates, Shopify, Zillow CNCF Project Collaboration • • Fluentbit: Potential log agent for Open. Telemetry Jaeger: Plan to leverage client libraries and collector (collector already announced)

© 2020 SPLUNK INC. is the second most active project in CNCF today! (per CNCF Dev. Stats)

© 2020 SPLUNK INC. Why do you want to trace?

© 2020 SPLUNK INC. What problems are you trying to solve? A tiny subset of answers* - Performance issues - Mean time to resolution and detection is too high - Metrics and logs are missing valuable context. - More data types can provide better answers

© 2020 SPLUNK INC. Gaps in current observability method A tiny subset of answers* Difficult to correlate observed behavior with what is operating. Difficult to collect data in different formats No (observable) gaps and want to try something new

© 2020 SPLUNK INC. Goals of tracing Questions to ask yourself and of your organization Which teams/components would benefit the most? How much resources are available to this effort? What is the short term goal and long term goal? If already in use, how is adoption? What are possible roadblocks to higher adoption? Why tracing now?

© 2020 SPLUNK INC. Architecture

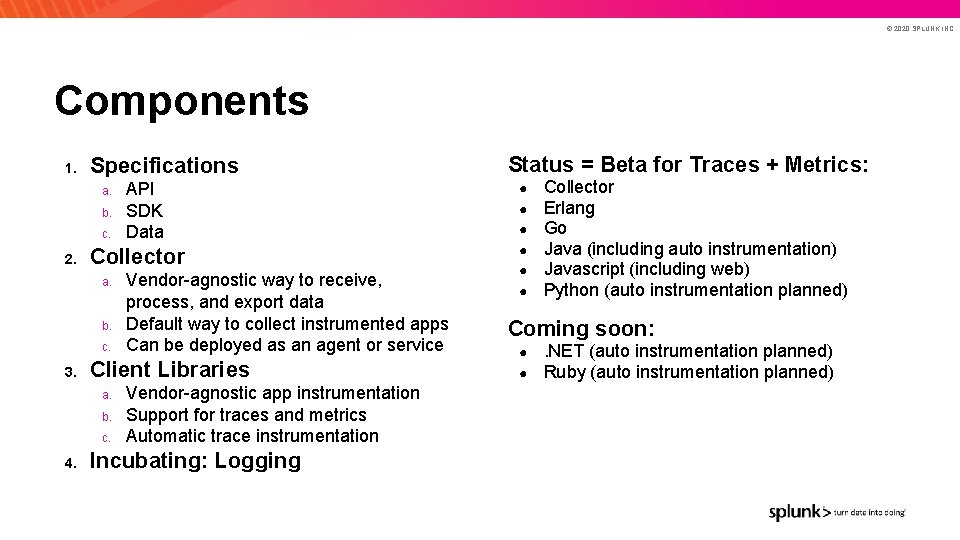
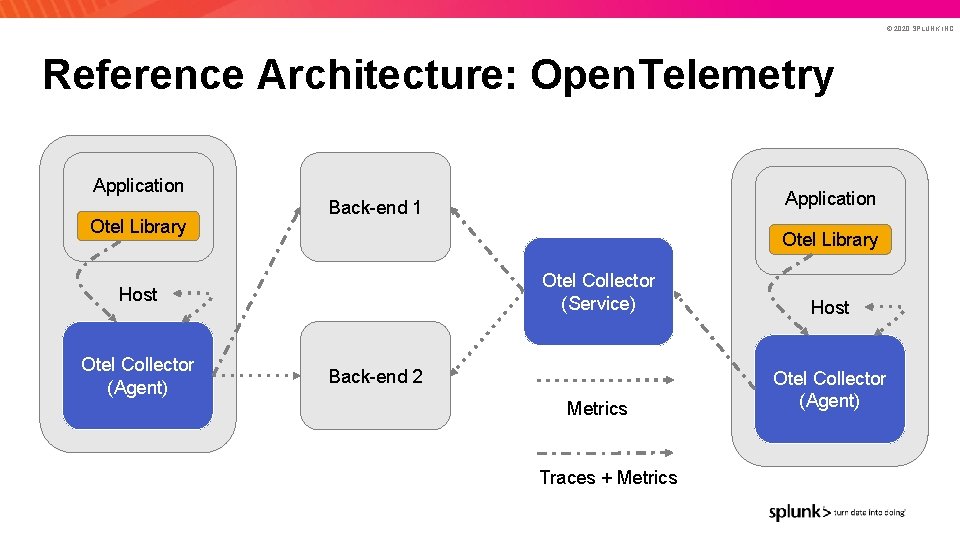
© 2020 SPLUNK INC. Components 1. Specifications a. b. c. 2. Collector a. b. c. 3. Vendor-agnostic way to receive, process, and export data Default way to collect instrumented apps Can be deployed as an agent or service Client Libraries a. b. c. 4. API SDK Data Vendor-agnostic app instrumentation Support for traces and metrics Automatic trace instrumentation Incubating: Logging Status = Beta for Traces + Metrics: ● ● ● Collector Erlang Go Java (including auto instrumentation) Javascript (including web) Python (auto instrumentation planned) Coming soon: ● ● . NET (auto instrumentation planned) Ruby (auto instrumentation planned)

© 2020 SPLUNK INC. Reference Architecture: Open. Telemetry Application Otel Library Host Otel Collector (Agent) Application Back-end 1 Otel Collector (Service) Host Metrics Otel Collector (Agent) Back-end 2 Traces + Metrics

© 2020 SPLUNK INC. Specifications

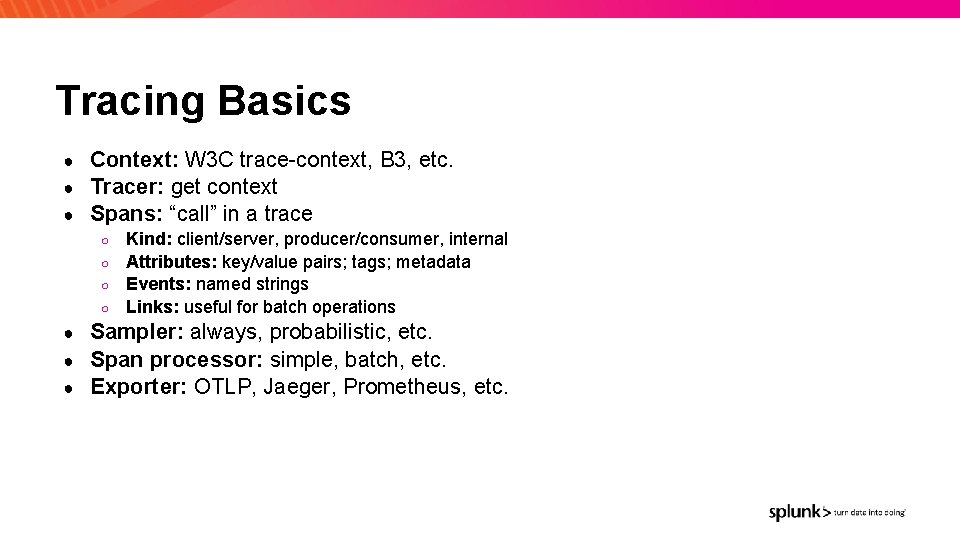
© 2020 SPLUNK INC. Tracing Basics Context: W 3 C trace-context, B 3, etc. ● Tracer: get context ● Spans: “call” in a trace ● ○ ○ Kind: client/server, producer/consumer, internal Attributes: key/value pairs; tags; metadata Events: named strings Links: useful for batch operations Sampler: always, probabilistic, etc. ● Span processor: simple, batch, etc. ● Exporter: OTLP, Jaeger, Prometheus, etc. ●

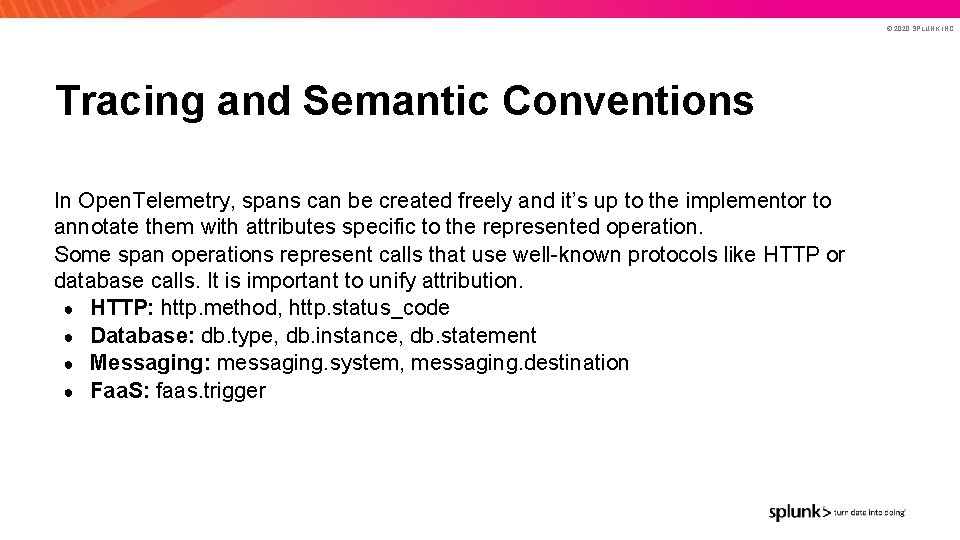
© 2020 SPLUNK INC. Tracing and Semantic Conventions In Open. Telemetry, spans can be created freely and it’s up to the implementor to annotate them with attributes specific to the represented operation. Some span operations represent calls that use well-known protocols like HTTP or database calls. It is important to unify attribution. ● HTTP: http. method, http. status_code ● Database: db. type, db. instance, db. statement ● Messaging: messaging. system, messaging. destination ● Faa. S: faas. trigger

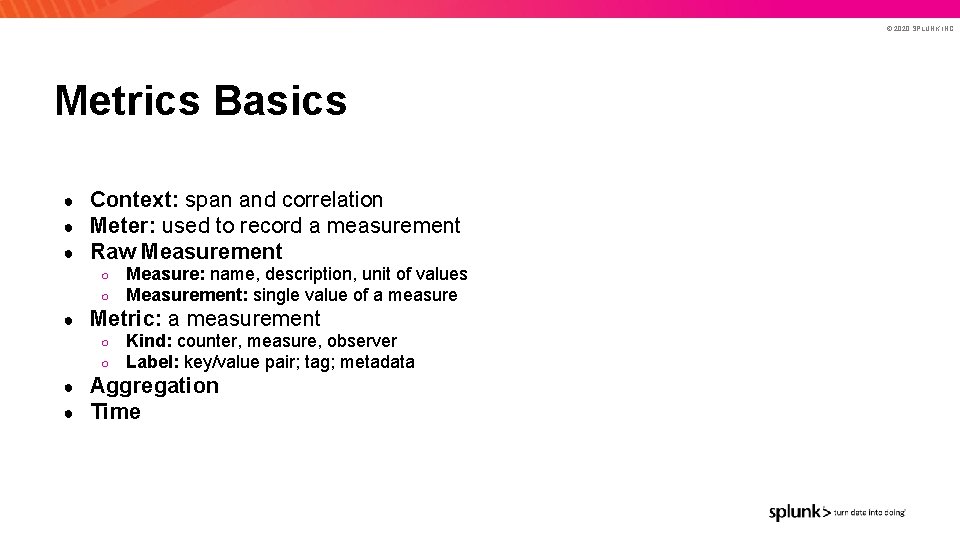
© 2020 SPLUNK INC. Metrics Basics ● ● ● Context: span and correlation Meter: used to record a measurement Raw Measurement ○ ○ ● Metric: a measurement ○ ○ ● ● Measure: name, description, unit of values Measurement: single value of a measure Kind: counter, measure, observer Label: key/value pair; tag; metadata Aggregation Time

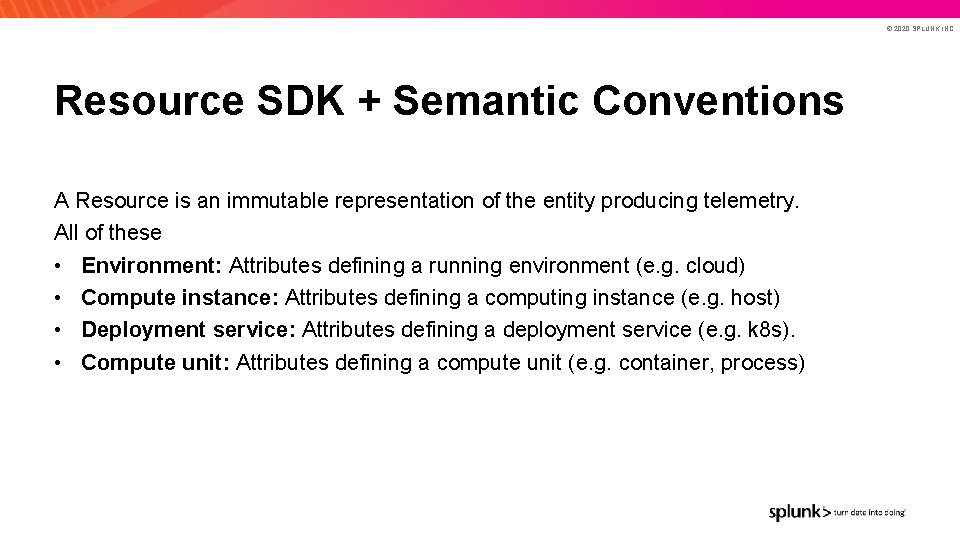
© 2020 SPLUNK INC. Resource SDK + Semantic Conventions A Resource is an immutable representation of the entity producing telemetry. All of these • Environment: Attributes defining a running environment (e. g. cloud) • Compute instance: Attributes defining a computing instance (e. g. host) • Deployment service: Attributes defining a deployment service (e. g. k 8 s). • Compute unit: Attributes defining a compute unit (e. g. container, process)

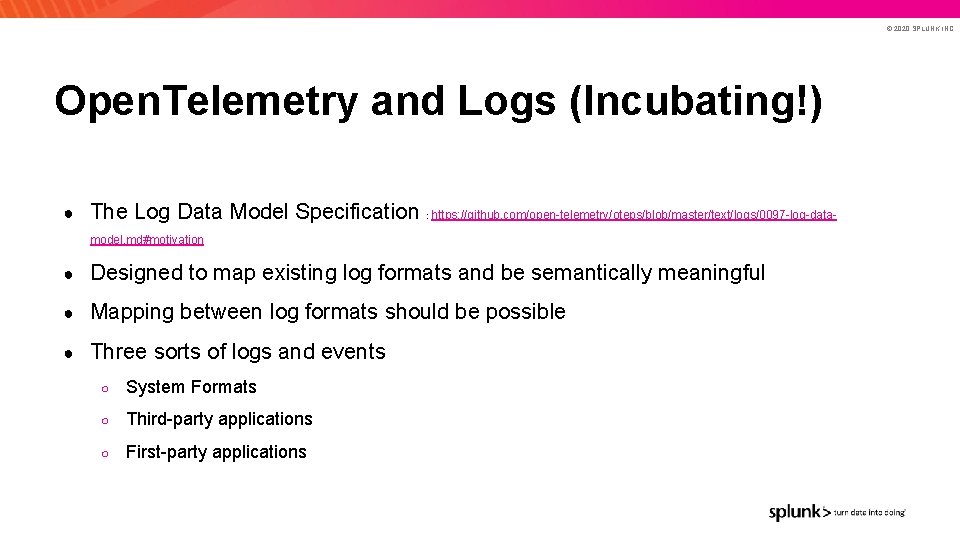
© 2020 SPLUNK INC. Open. Telemetry and Logs (Incubating!) ● The Log Data Model Specification : https: //github. com/open-telemetry/oteps/blob/master/text/logs/0097 -log-datamodel. md#motivation ● Designed to map existing log formats and be semantically meaningful ● Mapping between log formats should be possible ● Three sorts of logs and events ○ System Formats ○ Third-party applications ○ First-party applications

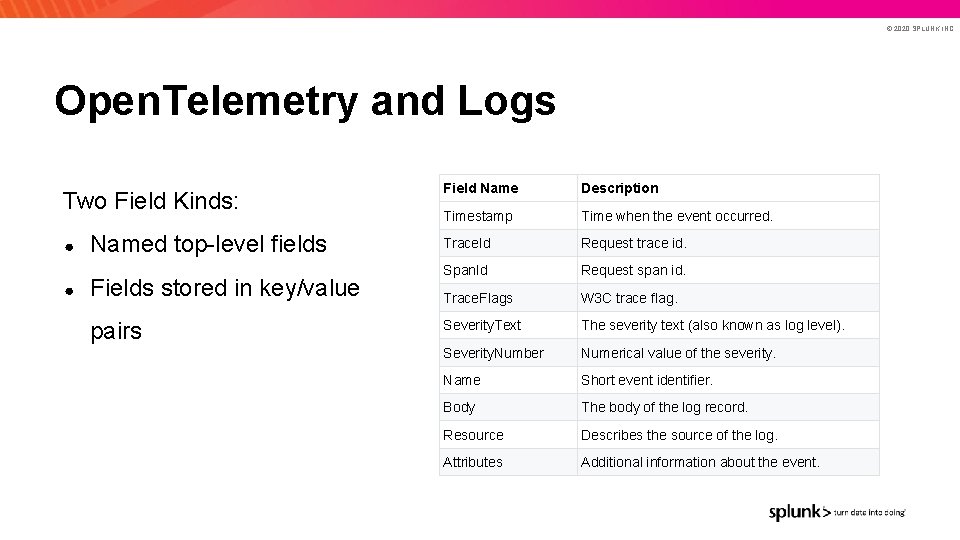
© 2020 SPLUNK INC. Open. Telemetry and Logs Two Field Kinds: ● ● Named top-level fields Fields stored in key/value pairs Field Name Description Timestamp Time when the event occurred. Trace. Id Request trace id. Span. Id Request span id. Trace. Flags W 3 C trace flag. Severity. Text The severity text (also known as log level). Severity. Number Numerical value of the severity. Name Short event identifier. Body The body of the log record. Resource Describes the source of the log. Attributes Additional information about the event.

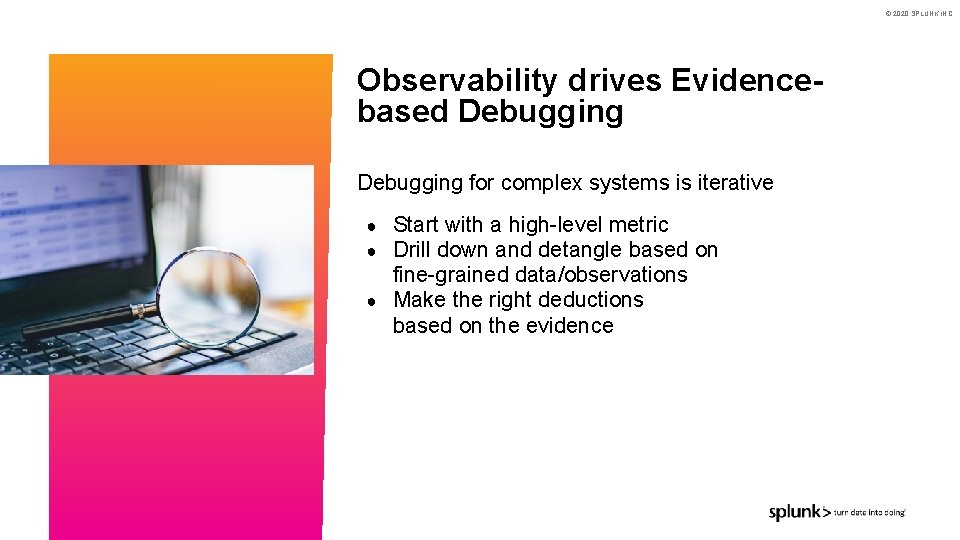
© 2020 SPLUNK INC. Observability drives Evidencebased Debugging for complex systems is iterative Start with a high-level metric Drill down and detangle based on fine-grained data/observations ● Make the right deductions based on the evidence ● ●

© 2020 SPLUNK INC. Collector

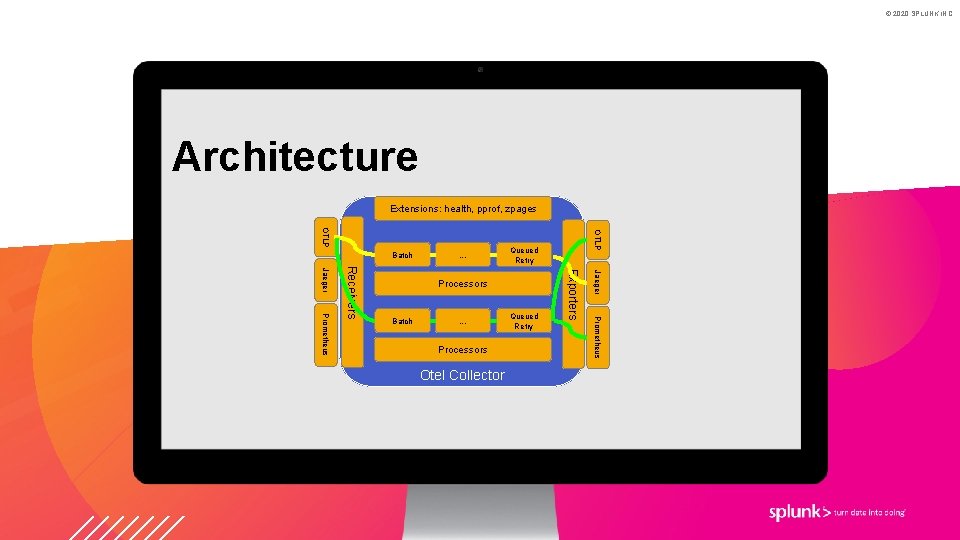
© 2020 SPLUNK INC. Objectives The Open. Telemetry Collector offers a vendor-agnostic implementation on how to receive, process, and export telemetry data in a seamless way. ● ● ● Usable: Reasonable default configuration, supports popular protocols, runs and collects out of the box. Performant: Highly performant under varying loads and configurations. Observable: An exemplar of an observable service. Extensible: Customizable without touching the core code. Unified: Single codebase, deployable as an agent or collector with support for traces, metrics, and logs (future).

© 2020 SPLUNK INC. But Why? ● Offload responsibility from the application ○ ○ ○ ● Compression Encryption Retry Tagging / Redaction Vendor-specific exporting Time-to-value ○ ○ ○ Language-agnostic; makes changes easier Set it and forget it; instrumentation that is ready for the Collector Vendor-agnostic and easily extensible

© 2020 SPLUNK INC. Architecture Extensions: health, pprof, zpages . . . Queued Retry Otel Collector Prometheus Processors Queued Retry Jaeger . . . Exporters Prometheus Receivers Jaeger Processors Batch OTLP Batch

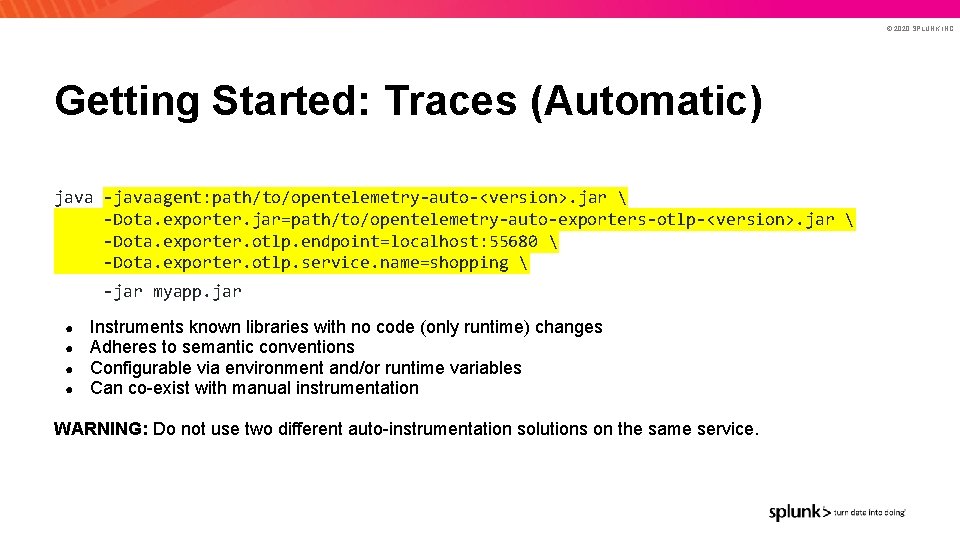
© 2020 SPLUNK INC. Getting Started: Traces (Automatic) java -javaagent: path/to/opentelemetry-auto-<version>. jar -Dota. exporter. jar=path/to/opentelemetry-auto-exporters-otlp-<version>. jar -Dota. exporter. otlp. endpoint=localhost: 55680 -Dota. exporter. otlp. service. name=shopping -jar myapp. jar ● ● Instruments known libraries with no code (only runtime) changes Adheres to semantic conventions Configurable via environment and/or runtime variables Can co-exist with manual instrumentation WARNING: Do not use two different auto-instrumentation solutions on the same service.

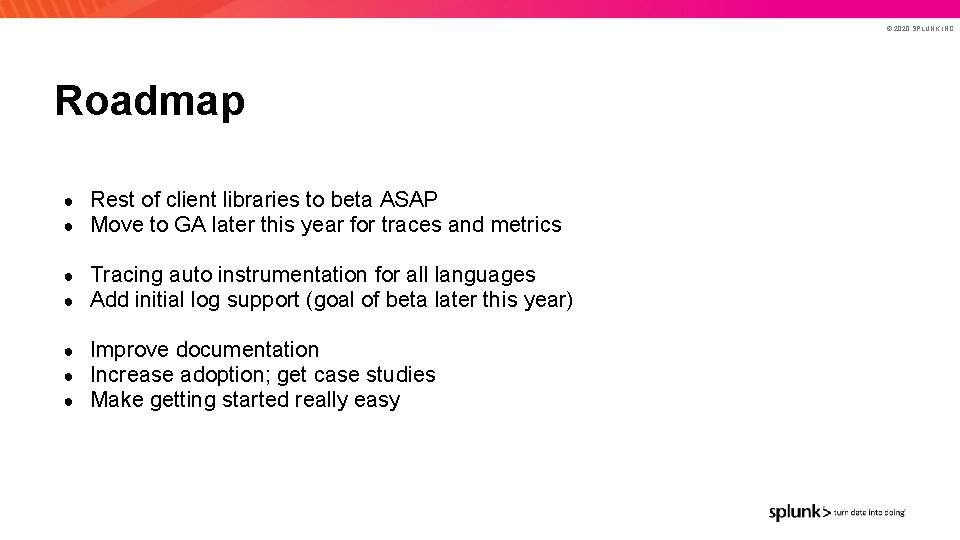
© 2020 SPLUNK INC. Roadmap ● ● Rest of client libraries to beta ASAP Move to GA later this year for traces and metrics ● ● Tracing auto instrumentation for all languages Add initial log support (goal of beta later this year) ● ● ● Improve documentation Increase adoption; get case studies Make getting started really easy

© 2020 SPLUNK INC. Problem solving Imagine being paged What questions do you ask yourself when you are being paged? How do you filter out noise? How do you determine what isn’t causing an issue? How do you determine impact?

© 2020 SPLUNK INC. A span for everything or bare minimum It depends Remember why you want to trace Rule of thumb: Start with service boundaries and 3 rd party calls Iterative process There is information overload Make it easy for teams to get tracing (for free or almost free)

© 2020 SPLUNK INC. Next Steps ● Join the conversation: https: //gitter. im/open-telemetry/community ● Join a SIG: https: //github. com/open-telemetry/community#special-interest-groups ● Submit a PR (consider good-first-issue and help-wanted labels)

© 2020 SPLUNK INC. Thank You