2019 WATER QUALITY BC KAREN LANCOUR National Bio
 KAREN LANCOUR National Bio Rules Committee Chairman ROBYN FISCHER National")
2019 WATER QUALITY (B&C) KAREN LANCOUR National Bio Rules Committee Chairman ROBYN FISCHER National Event Supervisor

Event Rules – 2019 DISCLAIMER This presentation was prepared using draft rules. There may be some changes in the final copy of the rules. The rules which will be in your Coaches Manual and Student Manuals will be the official rules.

Event Rules – 2019 • BE SURE TO CHECK THE 2019 EVENT RULES FOR EVENT PARAMETERS AND TOPICS FOR EACH COMPETITION LEVEL

EVENT COMPONENTS • Ecology Content – 2019 – Part 1 – Freshwater Ecology – Part 2 – Identify Macro-flora and Fauna – Part 3 – Water Monitoring and Analysis • Process skills in data, graph and diagram analysis Process skills • Event parameters – check the event parameters in the rules for resources allowed.

TRAINING MATERIALS • Training Power Point – content overview • 4 Training Handouts – General + 3 parts- content information • 3 Practice Activities – for 3 parts of competition • 2 Sample Tournament – sample problems with key • Event Supervisor Guide – prep tips, setup needs, and scoring tips • Internet Resources & Training Materials – on the Science Olympiad website at www. soinc. org under Event Information • A Biology-Earth Science CD and a Water Quality CD are available from SO store at www. soinc. org

Part 1: Freshwater and Estuary Ecology Areas such as: – – – Freshwater Ecology Aquatic Food Chains and Webs Population Dynamics Community Interactions Nutrient Recycling Water Cycle Aquatic Chemistry and its implications for life Potable Water Treatment Waste Water Treatment Watershed Resource Management Issues Sedimentation Pollution Exotic/invasive/harmful species

General Principles of Freshwater Ecology ECOLOGY – how organisms interact with one another ECOLOGY and with their environment ENVIRONMENT – living and non-living components ENVIRONMENT • ABIOTIC – non-living component or physical factors as soil, rainfall, sunlight, temperatures • BIOTIC – living component are other organisms.

ECOLOGICAL ORGANIZATION • INDIVIDUAL – individual organisms INDIVIDUAL • POPULATION – organisms of same species in POPULATION same area (biotic factors) • COMMUNITY – several populations in same COMMUNITY area (biotic factors) • ECOSYSTEM – community plus abiotic factors ECOSYSTEM • BIOSPHERE – all ecosystems on earth BIOSPHERE

Aquatic Ecosystems Lotic ecosystems – flowing water Streams Rivers Lentic ecosystems – still water Ponds Lakes Wetlands Estuary ecosystems

Watershed A watershed or drainage basin is an area of land where water from rain and melting snow or ice drains downhill into a body of water, such as a river, lake, reservoir, estuary, wetland, sea or ocean.

Lake Zones

Lake Turnover

Stream Order

Stream Analysis

ECOLOGY OF INDIVIDUALS • Homeostasis – delicate balance • Components – Physiological Ecology – Temperature and Water Balance – Light and Biological Cycles – Physiological Ecology and Conservation

ECOLOGY OF POPULATIONS • • Properties of populations Patterns of distribution and density Intra-specific competition Population dynamics Growth and regulation Altering population growth Human impact

ECOLOGY OF COMMUNITIES • Closed vs. Open communities – Closed – sharp boundaries – Open – Lack boundaries • Species abundance and diversity • Trophic Structure of Communities – Food chains – Food web – Trophic pyramid

Food Chains algae mayflies stoneflies trout humans • • • Producer 1 st order Consumer or Herbivore 2 nd order Consumer or 1 st order Carnivore 3 rd order Consumer or 2 nd order Carnivore 4 th order Consumer or 3 rd order Carnivore Decomposers – consume dead and decaying matter as bacteria

Food Web

Food Web

INTERACTIONS AMONG SPECIES • Interactions • Inter-specific competition • Predation • Exploitation • Symbiosis

Types of Species Interactions Neutral – two species do not interact Mutualism – both benefit Commensalism – one benefits, other neutral Parasitism – one benefits, one harmed but not killed • Predation – one benefits, other killed • •

ECOLOGY OF ECOSYSTEMS • Energy Flow – Energy Flow Pyramids – Biomass Pyramids • Community Succession and Stability (C Division) • Nutrient Recycling – nutrient cycles
 • Energy flow – one")
Energy vs Nutrient • Nutrients – cyclic (Biogeochemical Cycles) • Energy flow – one way

Ecologic Pyramids Ecological pyramid - a graph representing trophic level numbers within an ecosystem. The primary producer level is at the base of the pyramid with the consumer levels above. Numbers pyramid - compares the number of individuals in each trophic level. May be inverted due to size of individuals Biomass pyramid - compares the total dry weight of the organisms in each trophic level. Energy pyramid - compares the total amount of energy available in each trophic level. This energy is usually measured in kilocalories.

Ecological Pyramids

Biogeochemical Cycles recycles nutrients • Hydrologic Cycle • Phosphorus Cycle • Nitrogen Cycle • Carbon Cycle • Water Cycle

Nitrogen Cycle

Phosphorus Cycle

Carbon Cycle
 Cycle")
Hydrologic (Water) Cycle

Potable Water Treatment

Sewage Treatment

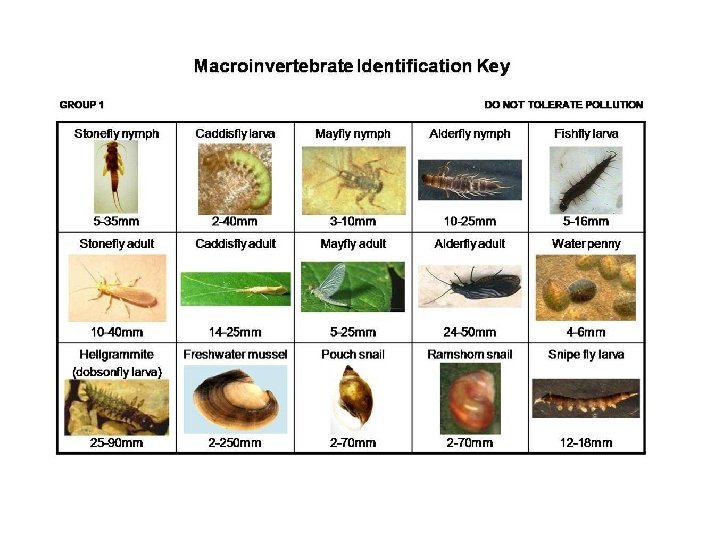
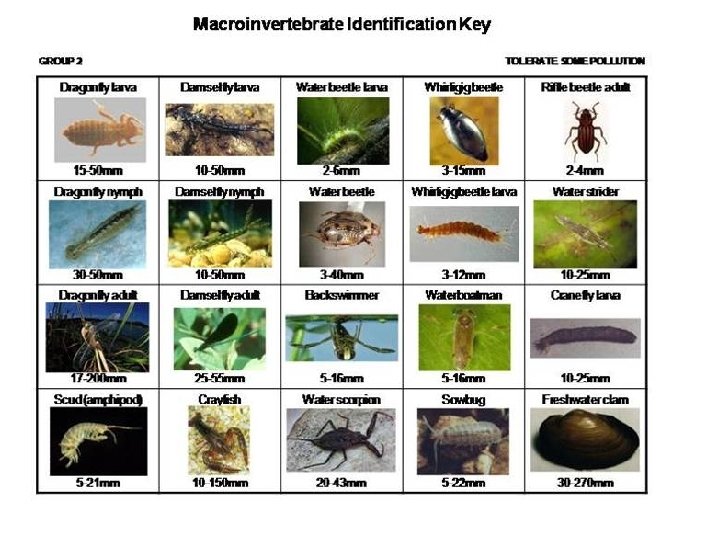
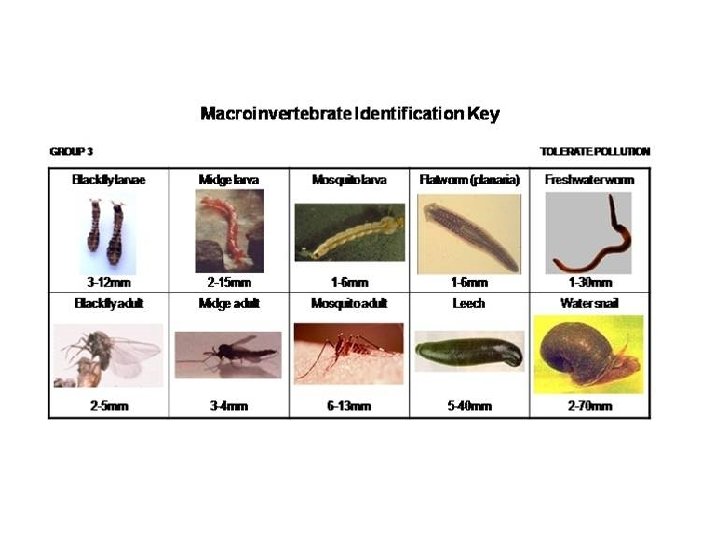
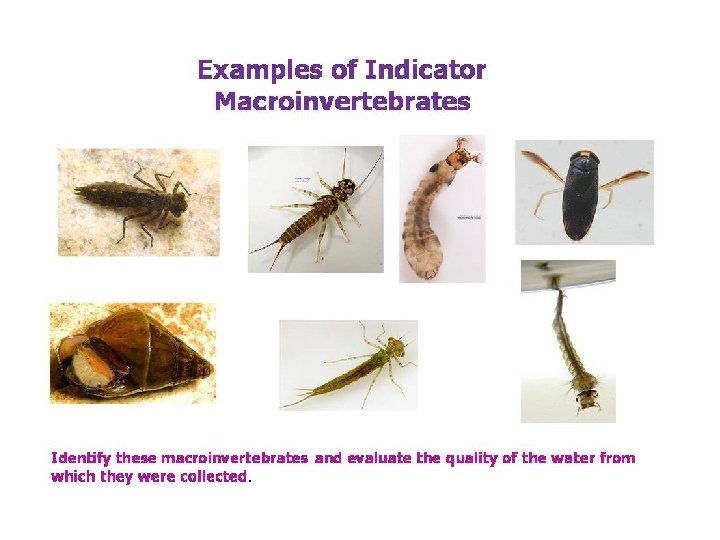
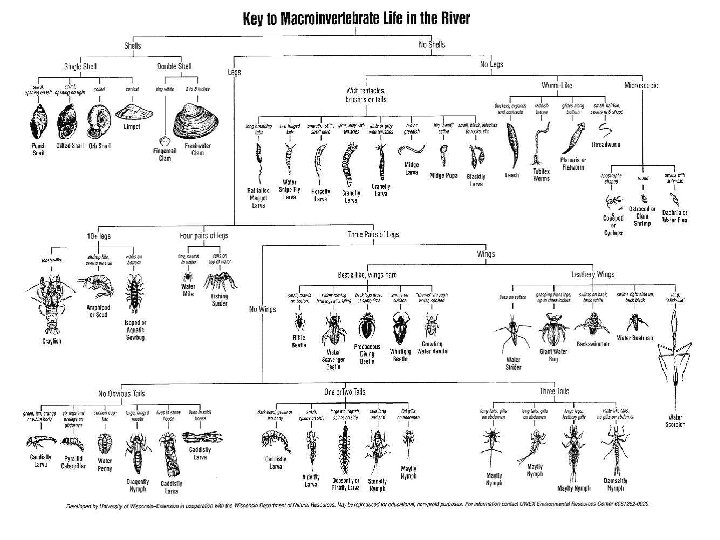
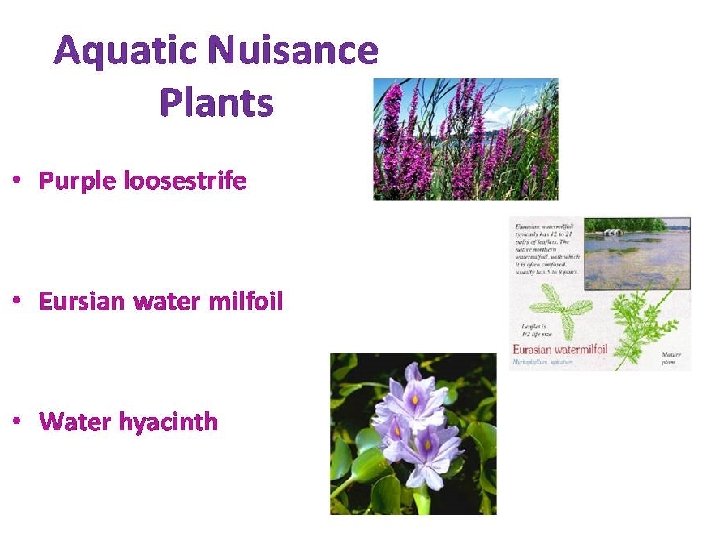
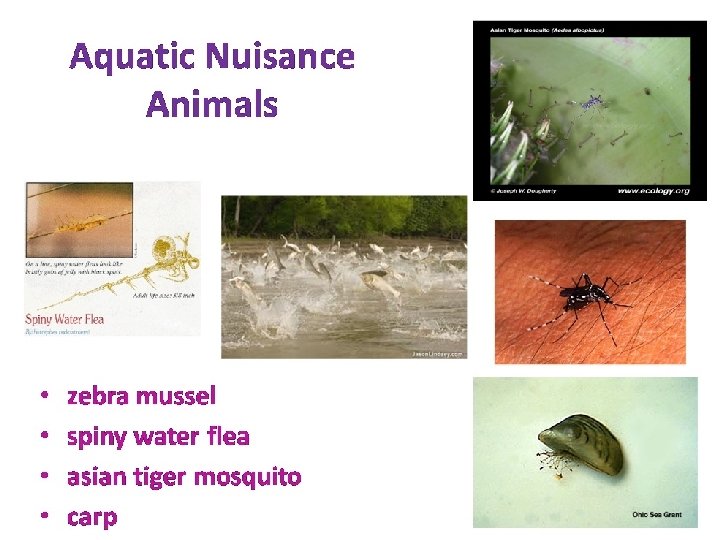
Part 2: Macro-flora and Fauna • Identify macroinvertebrates • Identify aquatic nuisance plants by their common name • Relate organisms to water and wetland quality

Indicator Species FOR Division C ONLY students will also be expected to know the general ecology, life cycles, and feeding habitats of all listed organisms Class 1 -pollution sensitive Class 2 -moderately sen. Class 3 -moderately tolerant Aquatic Sowbug Blackfly Class 5 Air Br. Caddisfly Air Breathing Snail Dobsonfly Blood Midge Gilled Snails Deer/House Fly Mayfly Tubifex Riffle Beetle Back Swimmer Crane Fly Giant Water Bug Damselfly Mosquito Dragonfly Predacious Diving Beetle Scuds Water Boatman Stonefly Flatworm Leeches Midge Water Mite Water Strider Water Penny Whirligig Beetle Water Scorpion Aquatic Nuisance Plants: Purple Loosestrife, Eurasian Water Milfoil and Water Hyacinth. Aquatic Nuisance Animals: Zebra Mussel; Spiny Water Flea , Asian Tiger Mosquito, and Carp Class 4 -pollution tol.

Freshwater habitats Freshwater Habitats and Their Organisms Macroinvertebrates that may be living there Riparian vegetation above the water (stream, river, pond, etc. ) Water surface (in quiet back pools) Edgewater includes overhanging vegetation from banks On or among vegetation in the water Under grasses and undercut stream banks Aquatic plants - plants under the surface as well as those growing through the water and floating Riffles or water tumbling over rocks Bottom under and among rocks-out of the swift current and tumbling debris Macroinvertebrates as insects fall into water from foliage whirligig beetles, water striders, springtails Fast-moving bugs and beetles, freshwater shrimp Haliplid beetles, dragonfly larvae Gripping insects, caddis flies, beetle larvae that have burrowed into logs and under rocks, mayflies and stoneflies high in oxygen and especially rich in insect diversity - caddis flies, stoneflies, mayflies, damselflies Bottom - mud, sand, silt, gravel, rocks Worms, fly larvae, bivalve mussels Flowing water - riffles, pools and runs Gripping insects, caddis flies, damselflies, shrimp, snails Pools – slow moving water at edges or Holding spot for organic material - behind rocks and logs shredders amphipods, isopods, freshwater crayfish and some caddis fly larvae

Factors indicating water quality as indicated by macroinvertebrate populations • Abundance: The number of macroinvertebrates present - large numbers of macro-invertebrates tend to be found in water enriched with nutrients while small numbers may indicate erosion, toxic pollution or scouring by floodwaters. • Functional Group: The presence and absence of certain feeding group of macroinvertebrates such as grazers and predators also indicates the water quality. • Taxa Richness: Diversity of macroinvertebrates found in water. The more diversity in water, the better quality it is. • Composition: the proportion of different types living together – healthy communities contain a good number of mayflies, stoneflies and caddis flies while community contains a lot of worms and midge larvae usually indicates a degraded environment. • Pollution tolerance: Different Macroinvertebrates have different level of sensitivity to pollution. The more number of pollution sensitive organisms, the better quality it is.

Feeding Groups Group Description Food Habitat Collectors Physically gather food or construct net like structure to catch it Dissolved organic, algae, feces and plants Stream bottom Shredders Shred, cut, bite or bore food Leaves and vegetation fallen into Areas with tree cover water Scrapers Use organs to scrape the food Scrape algae and diatoms off the Areas with enough light for algae rock growth Predators Hunt other organisms for food Other organisms – other invertebrates & small fish All types of habitat

Tips for Learning Indicator Species • Power Point Slides - make power point slides for trees and use them so you can use them to study • Flash Cards – make a set of flashcards with pictures on the front and information on the back • Actual Specimens – collect and preserve actual specimens of leaves – put data on the back so you can use them for study. See the section following on collecting and preserving leaves • Study Binder - have a section for each part of water quality competition – see handouts for each section • Timer – prepare practice stations and use the timer to improve efficiency of your teamwork skills

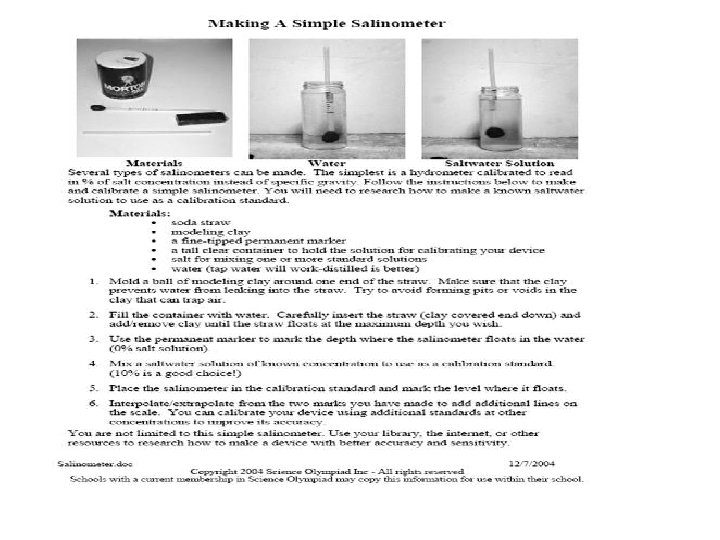
Part 3: Water Monitoring • Understand interpret data related to testing procedures and purposes for water testing (No actual testing) • Build and demonstrate a salinometer capable of testing saltwater (1 -10%)

Chemical Analysis • • • Temperature p. H Turbidity Dissolved oxygen BOD-Biochemical Oxygen Demand Phosphates Nitrates Total solids Fecal Coliform Salinity - only actual testing with salinometer Their relationship to one another

Temperature • Measured with a thermometer or temperature probe • Affects the amount of gases such as oxygen that can be dissolved in the water – cold water holds more oxygen than warm water • Increases the metabolic rates of aquatic organisms • Affects the rate of photosynthesis by aquatic plants and algae • Increases the sensitivity of organisms to disease, parasites and pollution

p. H Measured with p. H paper or p. H probe

Turbidity • Clear water has low turbidity and cloudy or murky water has high turbidity • Cloudiness occurs from suspended sediment, algal blooms, or dead organic matter in the water • Turbidity id measured in nephelometric turbidity units (NTU’s) – a comparison of the amount of light scattered by the suspended particles in the water • The turbidity affects the amount of light penetrating to the plants for photosynthesis

DO-Dissolved Oxygen Air is about 21% oxygen which is 210, 000 ppm (parts per million) Most surface waters contain between 5 and 15 ppm of dissolved oxygen An appropriately high level of dissolved oxygen is essential for aquatic life Below 5 ppm puts aquatic life under stress, below 12 ppm for a few hours can kill large fish Absence of dissolved oxygen is a key sign of severe pollution

BOD – Biochemical Oxygen Demand Aerobic microbes use oxygen to oxidize the organic matter in the water BOD is tested using the maters for testing dissolved oxygen but the test is done over a period of time to determine the rate of oxygen being used Natural sources of organic matter may include plant decay or leaf fall Human waste as leaves, lawn clippings, paper waste, pet waste entering into the water can accelerate plant growth and decay because nutrients and sunlight are overly abundant These human wastes can increase oxygen demand

Phosphates • The phosphorus cycle recycles phosphorus in the form of phosphates for most life forms • Phosphorus is necessary for plant and animal growth • The total phosphorus test measures all the forms of phosphorus in the sample (orthophosphate, condensed phosphate, and organic phosphate). • Phosphates enter waterway in a variety of natural ways such as phosphate containing rock and normal animal and plant waste in the water • Phosphates will enter waterways from runoff • Phosphates enter waterway in a variety of human sources such as fertilizers, pesticides, industrial and cleaning compounds, human and animal waste, power plant boilers (used to prevent corrosion), septic tanks and wastewater from sewage treatment plants • Too much phosphate can cause excess algae and aquatic weeds using up large amounts of oxygen and causing aquatic organisms and fish to die

Nitrates Nitrogen is required for building proteins by all living plants and animals Forms of inorganic nitrogen include ammonia (NH 3), nitrates (NO 3), and nitrites (NO 2) Usable forms of nitrogen for aquatic plant growth are ammonia (NH 3) and nitrates (NO 3) Nitrates stimulate the growth of plants and algae in the water allowing for more animal food Excess amounts of nitrates can cause algae to bloom wildly reducing oxygen levels for fish and sometimes causing their death (accelerated eutrophication)

Total Solids Suspended solids can be retained on a water filter and will settle to the bottom of a water column and include silt, clay, plankton, organic wastes, and inorganic precipitates Dissolved solids pass through a water filter and include calcium, bicarbonate, nitrogen, phosphorus, iron, and sulfur and other ions in the water Concentration of dissolved solids in stream water is important because it determines the flow of water in and out of the cells of aquatic organisms Many of the dissolved solids as nitrogen, phosphorus, and sulfur are essential nutrients for life Low concentrations of total solids can limit growth of aquatic organisms Elevated levels can lead to accelerated eutrophication of the water system and increase the turbidity both of which decrease water quality

Fecal Coliform bacteria live in the intestines of warmblooded animals Fecal Coliform bacteria are also found in the feces excreted from humans and other warm-blooded animals Fecal Coliform bacteria are living organism entering the waterway High numbers of Fecal Coliform in water means that the water has received fecal matter from some source Diseases as dysentery, typhoid fever, gastroenteritis, hepatitis, and ear infections are associated with waters having high Coliform counts

Salinomter – Hydrometer • Salinometers / Hydrometers • Hydrometer calibrated to read in % of salt concentration • Materials (one example) – Materials § soda straw § modeling clay § a fine-tipped permanent marker § a tall clear container to hold the solution for calibrating your device § salt for mixing one or more standard solutions § water (tap water will work-distilled is better)

Sample Analysis Using the picture below, explain all of the possible human caused problems that can occur. In addition, what types of chemical testing would you perform to confirm your suspicions?
- Slides: 60