2019 Legislative Issues Background on RSAI Priority Issues

2019 Legislative Issues Background on RSAI Priority Issues October 2018

Agenda of 2019 Issues Video on RSAI legislative site Larry Sigel, Partner, ISFIS Margaret Buckton, Professional Advocate, RSAI ØState Budget: Setting the Stage for the 2019 Session Ø 2018 Accomplishments – check some off the list Ø 2019 Issues ØAdvocacy Actions

THE STATE OF THE B UDGET S TATE 3

Revenue Estimates FY 2018 ended with $127 million Surplus REC set revenue estimates on Oct. 16 (December estimate is binding): ◦ FY 2019 4. 9% ◦ FY 2020 1. 7% $131. 8 million new money ◦ State’s reserve funds (EEF and CRF) are full Impact of tax cuts: ◦ Last year’s federal tax cut package increases state revenues due to federal deductibility ◦ Last year’s state tax cut package is a mixed bag; estimated to increase sales tax revenues and decrease income tax revenues, with triggers in place to ensure economic growth is sufficient to afford the tax cut. For FY 2019, the net fiscal impact is a loss of $100. 1 million. For FY 2020, another $168. 2 million will be off the table.

State of the State Budget A note about tax credits and exemptions: ◦ The RSAI Legislative Digest includes a list of tax credits on page 12, which estimates a total of $429 million. That is a 29% increase since FY 2017 (just two years. ) ◦ Commercial and Industrial Property Tax credits and local government hold harmless payments also cost the state a lot. $123. 9 million Business Property Tax Credit, $152. 2 million appropriation to local governments, and another $39. 7 million increase to the state for the school aid formula due to lower valuation. $315. 8 million total

Accomplishments over 4 Sessions Before 2018: ◦ Management fund authority to pay for retirements over age 65 and costs of arbitration ◦ PPEL flexibility to pay for repairs over $1, 500 ◦ Do. P Flexibility ◦ Home Rule Statute ◦ Categorical Fund Flexibility In 2018 Session ◦ Even more Do. P Flexibility ◦ Even more Categorical Fund Flexibility ◦ Staff Flexibility – CTE options for hard-to-staff content and local offerings of on-line learning ◦ Progress on Transportation and Formula Equality ◦ Extension of Operational Sharing Incentives ◦ State Penny Extension through the House 95: 3 – not done yet!


2018 Accomplishments FLEXIBILITY for Local School Leaders: ◦ HF 2441 Eliminates DE role in approving dropout prevention plans and turns that over to local school boards. Allows expenditure for “any purpose determined by the board of directors that directly benefits students participating in the adopted program, ” proration of staff costs including but not limited to administrative staff, mental health staff/services and school security personnel. Also allows Early Intervention/Class size funds to be used for any general fund purpose. ◦ RSAI initiative to eliminate 5 -year maximum lease of school property to a private entity and created a property tax exemption for private property that is generating electricity for a school on school property.

2018 Accomplishments OPERATIONAL SHARING Extension HF 633 Extends sharing incentives to June 30, 2024. ◦ Adds social workers as an allowable shared position at 3. 0 weighting ◦ Eliminates 5 -year limit for a position to be shared ◦ Will revisit for extension in the future

2018 Accomplishments TRANSPORTATION and FORMULA EQUITY SF 455 addressed both issues: ◦ $11. 2 M in transportation grants for FY 2019 – one time grant in FY 2019 budget - will need to be considered for FY 2020. ◦ Adds $5 to the minimum State Cost Per Pupil to close the gap to $170 – this is a permanent correction but just a start to closing the gap. ◦ Didn’t go as far as we originally wanted. Still work to do on both issues.

Transportation and Formula Equality Transportation expenditure differences are the biggest remaining inequity for students in Iowa. Money spent on busing is not available for teachers, textbooks and programs. Formula inequality still remains, with a $170 difference between the state cost per pupil, which serves as a ceiling for half of Iowa school districts with the other half of districts allowed to tax locally for up to $170 per pupil more. Legislative Education Committee leaders have indicated their support to continue to address these inequities.

Transportation • FY 2017 State cost per pupil was $6, 591. There were an estimated 30 Iowa school districts that required at least 10% of that general fund cost per pupil for transportation. • FY 2017 DE transportation report: The range in transportation expenditures varies from a low of $9. 60 to a high of $969. 60 per student enrolled. Square miles per district range from a low of 2 to a high of 555 square miles, and route miles range from a low of 958 to a high of 1, 227, 106 miles.

School Funding & Mandates ◦ SSA set at 1. 0%, set early and stayed at that level despite lower REC estimates and additional reductions to the budget later in the session. ◦ Appropriation for new State Assessment: $2. 7 million to be distributed to school districts for the statewide student assessment.

Iowa State Cost Per Pupil Funding History 16% Calculated by formula considering inflation and economic factors. Legislatively set one year in advance of the budget year. 14% Beginning in FY 18, set within 30 days of Gov. 's Budget, no longer a year in advance. 10% Historical annual cost increase of doing school is 3. 5 -4. 0% (orange band below): SSA set in 8 of the 9 last years lags the cost increase 8% 6% 4% 2% /7 73 3 /7 74 4 /7 75 5 /7 76 6 /7 77 7 /7 78 8 /7 79 9 /8 80 0 /8 81 1 /8 82 2 /8 83 3 /8 84 4 /8 85 5 /8 86 6 /8 87 7 /8 88 8 /8 89 9 /9 90 0 /9 91 1 /9 92 2 /9 93 3 /9 94 4 /9 95 5 /9 96 6 /9 97 7 /9 98 8 /9 99 9 /0 00 0 /0 01 1 /0 02 2 /0 03 3 /0 04 4 /0 05 5 /0 06 6 /0 07 7 /0 08 8 /0 09 9 /1 10 0 /1 11 1 /1 12 2 /1 13 3 /1 14 4 /1 15 5 /1 16 6 /1 17 7 /1 18 8 /1 9 0% 72 Percent Increase in State Cost Per Pupil 12%

History of Iowa Per Pupil State Supplemental Assistance/Allowable Growth and Consumer Price Index 16. 00% 14. 00% 12. 00% 10. 00% Allowable Growth Rate no longer set by formula 8. 00% FY 2019 FY 2018 FY 2017 FY 2016 FY 2015 FY 2014 FY 2013 FY 2012 FY 2011 FY 2010 FY 2009 FY 2008 FY 2007 FY 2006 FY 2005 FY 2004 FY 2003 FY 2002 FY 2001 FY 2000 FY 1999 FY 1998 FY 1997 FY 1996 FY 1995 FY 1994 FY 1993 FY 1992 FY 1991 FY 1990 FY 1989 FY 1988 FY 1987 FY 1986 FY 1985 FY 1984 FY 1983 FY 1982 FY 1981 FY 1980 FY 1979 FY 1978 FY 1977 FY 1976 FY 1975 FY 1974 -2. 00% CPI Allowable Growth or SSA Rate Allowable Growth changed to State Supplemental Assistance CPI 6. 30. 18 6. 00% 4. 00% 2. 00% 0. 00% -4. 00%

https: //www. legis. iowa. gov/d ocs/publications/FTNO/9667 60. pdf About 20% Iowa GDP growth controlling for inflation from 2011 to 2017 “Chart 3 shows the relative inflation-adjusted growth in total GDP for Iowa, the plains states, and the nation. From CY 1997 through CY 2017, Iowa’s 52. 4% growth leads the plains states’ 45. 0% growth and the nation’s growth of 50. 4% as a whole. Iowa surpassed the plains states beginning with CY 2004 and the nation beginning with CY 2014. ” 16

How big is $765 million? ? ? $ 765, 000 State aid over 8 years (true number) minus $ 90, 000 property tax relief minus $ 85, 700, 000 state funding for 13, 802 new students minus $ 159, 000 Teacher Leadership Initiative divided by 58 Cents/pp 512, 971 PK-12 enrollment 180 days of instruction equals $ 430, 300, 000 Net new money to the classroom divided by 8 $ 838. 84 Dollars per student over 8 years divided by 180 $ 4. 66 Dollars per student per day of instruction over 8 years equals annual increase dollars per student per day $ 0. 58 17

Student Inequities and Needs Student Mental Health: Mental health reform set a structure in place, with unanimous legislative support. It did not includes services for students or appropriate any funds. Governor Reynolds appointed a task force to make recommendations on student mental health systems. Mr. Hubbell said we already know what to do, but we have to fund it. Both Reynolds and Hubbell are talking about this issue.

Comparison state-by-state of Medicaid reimbursement for online therapy: https: //www. presencelearning. com/resources/medicaid-reimbursement-for-online-services/

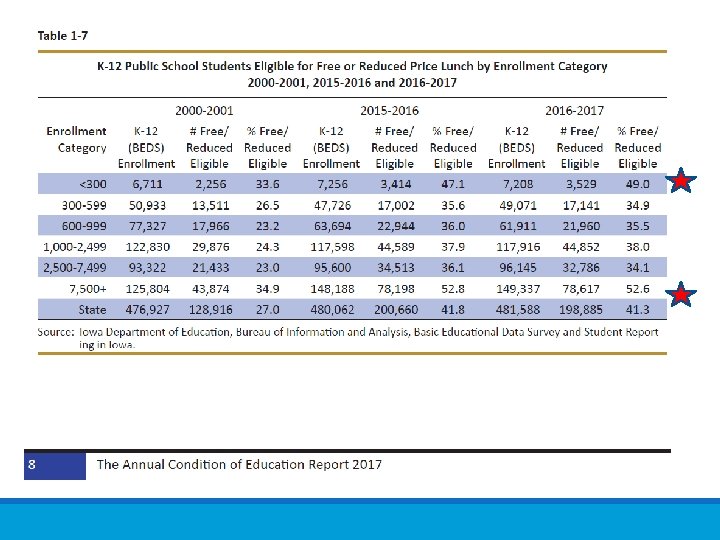
Student Inequities and Needs Funding Equity for At-risk Students: Resources for serving at-risk students should be based on need, such as the percentage of students eligible for Free and Reduced Price Lunch, in addition to enrollment of the district. The current disparity in dropout prevention capacity ceiling, with some districts held to 2. 5% and others allowed to access up to 5% of regular program district cost is unfair, arbitrary, and based on old history no longer relevant to supporting student needs.

Children from families with incomes at or below 130% of the poverty level are eligible for free lunch those 130 -185% eligible for reduced lunch, according to the National School Lunch Program. Districts in the largest and smallest enrollment categories had the highest percentage of students eligible for free or reduced price lunch (Table 1 -7).


Student Inequities and Needs Quality Preschool: RSAI supports full funding of quality preschool. Due to changing demographics in rural Iowa, significant transportation costs, and lack of quality day care access, preschool should be fully funded at the regular student count at 1. 0 per pupil cost.
, PK saves $17")
Why does preschool matter? ◦ The Perry Preschool Project (40 years), PK saves $17 for every dollar invested. ◦ The majority of states now view access to high-quality PK programs as a critical long-term economic investment in the future workforce. ◦ Education Commission of the States, Oct. 2014, http: //www. ecs. org/docs/early-learning-primer. pdf: Six Rigorous long term evaluation studies have found that children who participated in highquality preschool programs were: ◦ ◦ ◦ 25% less likely to drop out of school. 40% less likely to become a teen parent. 50% less likely to be placed in special education. 60% less likely to never attend college. 70% less likely to be arrested for a violent crime. ◦ NCSL quotes studies on long term return on investment. http: //www. ncsl. org/research/human-services/new-research-early-education-aseconomic-investme. aspx

Teacher Shortage and Quality Instruction Rural school districts require maximum flexibility to provide great instruction to all Iowa students. RSAI supports 1) district flexibility to meet offer and teach requirements CTE courses allowed to count if <600 enrollment in SF 475 which also included on-line learning options for all districts 2) elimination of barriers to teacher licensure such as Praxis test requirements Some progress in both chambers, but couldn’t agree between them on the solution. Will try again in 2019.

Teacher Shortages in Iowa v. HF 291 Chapter 20 Changes –possible motivation for experienced teachers to leave the field v. TLC demand for teacher leaders v. Wage and workload competition v. General economics of teacher supply with 2% unemployment in Iowa v. Public perception of the rewards of teaching v. Rural Schools have additional challenges with lack of economies of scale, inability to attract young teachers to rural communities, lack of resources to compete with larger districts. v. Its not just Iowa

Teacher Shortages: Economics The wage gap between public school teachers and similar workers, grew from a negative 5. 5% in the 1979 to a record -17% in 2015, according to Education Week. “In their findings, authors Lawrence Mishel, who is president of the Economic Policy Institute, and labor economist Sylvia A. Allegretto, who is chair of the Center on Wage and Employment Dynamics at the Institute for Research on Labor and Employment at University of California, Berkeley, cite recruiting and retaining high-quality teachers as crucial issues in K-12 education today, and say that in order to draw new teachers to the profession, fair compensation is necessary. "Continued budget austerity at all levels of government have created pressure to restrain teacher compensation, " Mishel wrote in an email. According to the Learning Policy Institute, in 2016, there were an estimated 108, 757 teachers not fully certified for their teaching position and 6, 424 reported vacancies in 36 states. (IA and some other states do not report)

Understanding Teacher Shortages: 2018 Update A State-by-State Analysis of the Factors Influencing Teacher Supply, Demand, and Equity https: //learningpolicyinstitute. org/product/understanding-teacher-shortages-interactive IA SD ND MN WI IL WY IA is in the second to lowest quintile, ranking 30 th in starting teacher pay. $35, 766 $37, 419 $38, 032 $37, 644 $36, 983 $38, 820 $45, 207

https: //www. legis. iowa. gov/docs/publications/MOW/970927. pdf


DE’s Annual Condition of Education Report shows average salary by school size (which is a good but not perfect predictor of rural districts), showing an almost $15 K difference in pay between the averages of the smallest and largest category of school size.

Sharing Incentives ◦ Extension of operational sharing plus added position of social worker/mental health counselor. ◦ Suggested to add SRO to the list ◦ Will need to work on Reorg and WGS extension next, since those incentives expire in 2020.

Number of Iowa Public School Districts 1949 -50 to 2018 -19 5, 000 4, 652 4, 500 4, 142 4, 000 3, 500 3, 000 2, 500 2, 000 1, 575 1, 500 1, 056 1, 000 453 500 449 443 437 430 384 374 367 361 338 336 333 330 9 -1 18 20 20 16 -1 7 6 -1 15 20 20 14 -1 5 0 -1 09 20 -0 04 20 -2 99 19 5 0 00 5 -9 94 19 0 -9 89 19 5 -8 84 19 0 -8 79 19 19 74 -7 5 0 -7 69 19 5 -6 64 19 0 -6 59 19 5 -5 54 19 19 49 -5 0 -

Number of Iowa Public School Districts 1999 -00 through 2018 -19 380 . 04500 370 . 04000. 03500 360 . 03000 350 . 02500 340. 02000 330 . 01500 320 . 01000 Note: 2 years after low AG or SSA, drop in number of districts 9 -1 18 8 Per Pupil $ Increase Percent 20 17 -1 7 20 6 -1 16 20 5 -1 15 20 4 -1 14 20 -1 13 3 -1 12 20 1 -1 11 20 -1 10 0 Number of School Districts 20 9 -1 09 20 8 -0 08 20 7 -0 07 20 6 -0 06 20 5 -0 05 20 -0 04 20 -0 03 20 -0 02 20 1 -0 01 20 -0 00 20 00 -2 99 19 4 . 00000 3 300 2 . 00500 0 310

School Choice Defense §Bills for ESA’s/vouchers in 2018 Session did not advance §Tax bill did expand STOs to $13 million, increased eligibility to 400% of FPL, and created 529 plan for tax free private school tuition §Costly – tight budget applies to this issue to (state already invests over $52 million) §Nonpublic school and home school advocates are expert, adamant and very politically active. §Advocate for investing in public school first. §Public dollars require public accountability; advocate for a level playing field (testing accountability, serve all students, require all mandates, oversight on expenditures). §Voters in 9 states have rejected vouchers on the ballot – none have approved. §Consider vouchers as a shift of resources from rural to urban communities since few nonpublic schools exist in rural Iowa.

Note location of existing private schools related to legislative seats Map from Legislative tax Expenditure Committee DOR Report (in RSAI School Choice Position Paper)

Advocacy Strategies q. Build relationships during the Interim and make introductions before the election. “Gentle persuasion applied relentlessly” q. Engage parents and the business community q. Get real – talk about the ongoing impact on the ability of your school to educate all children for the 21 st Century. q. Share position papers, impact on your district, with staff, stakeholders and your legislators and invite legislators into your school q. Don’t forget the media – letters to the editor, coverage of school budget events, stories of changes in student needs, successes too – tell the good news. q. Thank legislators for their work last session and offer to help them if you can. q. Call RSAI for help!

3 Legislators and 4 Sups

Resources: http: //www. rsaia. org/legislative. html

RSAI Priorities for 2019 you get to set them tonight!!!

Questions or Comments? LA RR Y SIGEL – ISFIS PARTNER MARGARET BUCKTON – ISFIS CEL L: 515 -490 -9951 PARTNER LARRY @IOWASCHOOLFINANCE. COM CELL: 515 -201 -3755 Margaret@iowaschoolfinance. com Iowa School Finance Information Services 1201 63 rd Street Des Moines, IA 50311 Office: 515 -251 -5970 www. isfis. net 42
- Slides: 42