
2019 ESE PARENT SURVEY RESULTS PINELLAS COUNTY SCHOOLS
- Slides: 8
2019 ESE PARENT SURVEY RESULTS PINELLAS COUNTY SCHOOLS
WHAT IS FL DOE - INDICATOR 8 Gauges a parents perception of how their child's school facilitated parent involvement Utilizes the “School’s Efforts to Partner with Parents Scale” (SEPPS) as the tool to collect parent input on annual basis (ESE Parent Survey) ESE Parent Survey State Report captures the results formatted based on Pre K and K 12.
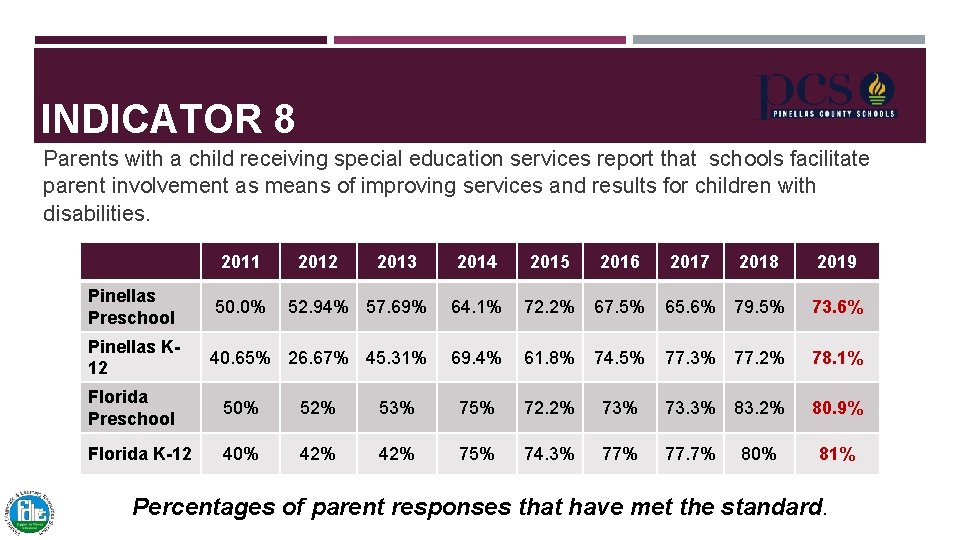
INDICATOR 8 Parents with a child receiving special education services report that schools facilitate parent involvement as means of improving services and results for children with disabilities. 2011 2012 2013 2014 2015 2016 2017 2018 2019 Pinellas Preschool 50. 0% 52. 94% 57. 69% 64. 1% 72. 2% 67. 5% 65. 6% 79. 5% 73. 6% Pinellas K 12 40. 65% 26. 67% 45. 31% 69. 4% 61. 8% 74. 5% 77. 3% 77. 2% 78. 1% 80. 9% Florida Preschool 50% 52% 53% 75% 72. 2% 73. 3% 83. 2% Florida K-12 40% 42% 75% 74. 3% 77. 7% 80% 81% Percentages of parent responses that have met the standard.
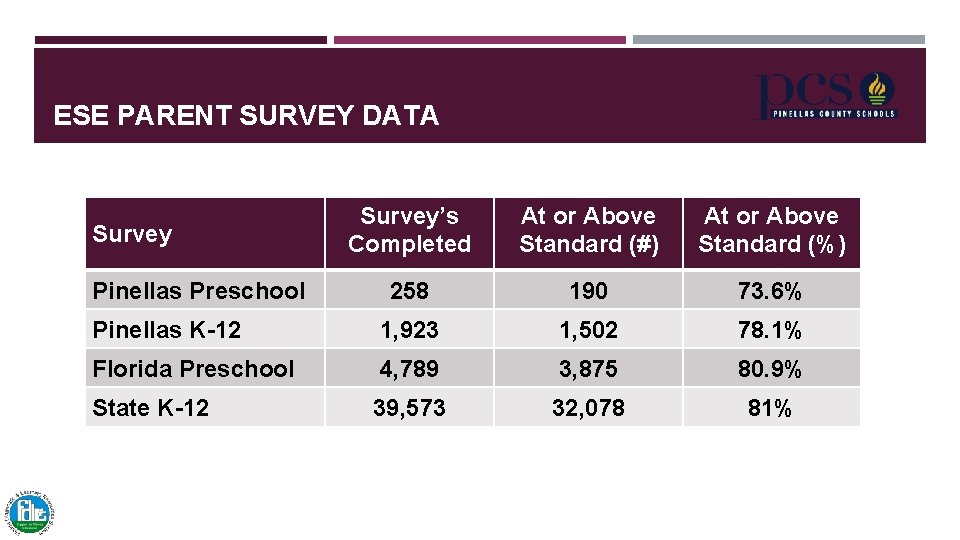
ESE PARENT SURVEY DATA Survey’s Completed At or Above Standard (#) At or Above Standard (%) 258 190 73. 6% Pinellas K-12 1, 923 1, 502 78. 1% Florida Preschool 4, 789 3, 875 80. 9% State K-12 39, 573 32, 078 81% Survey Pinellas Preschool
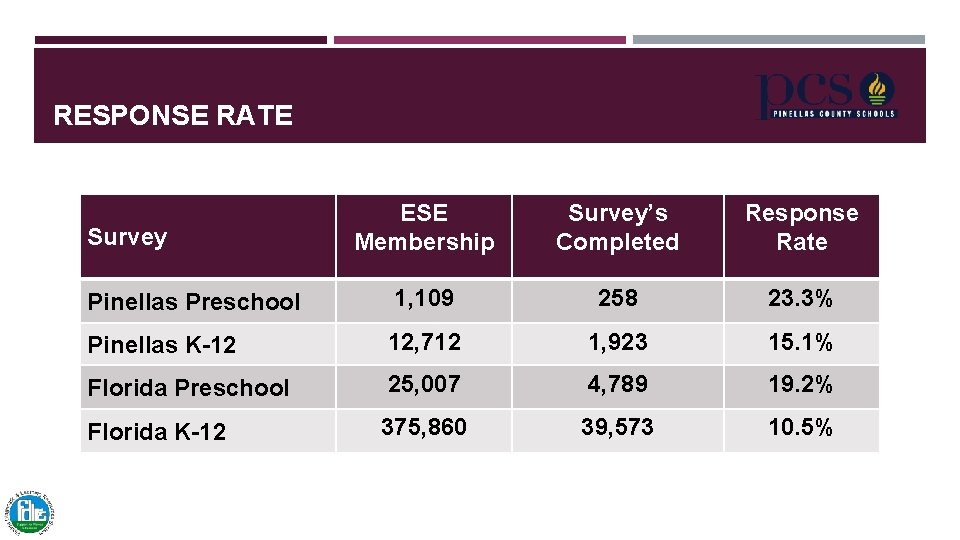
RESPONSE RATE ESE Membership Survey’s Completed Response Rate Pinellas Preschool 1, 109 258 23. 3% Pinellas K-12 12, 712 1, 923 15. 1% Florida Preschool 25, 007 4, 789 19. 2% Florida K-12 375, 860 39, 573 10. 5% Survey
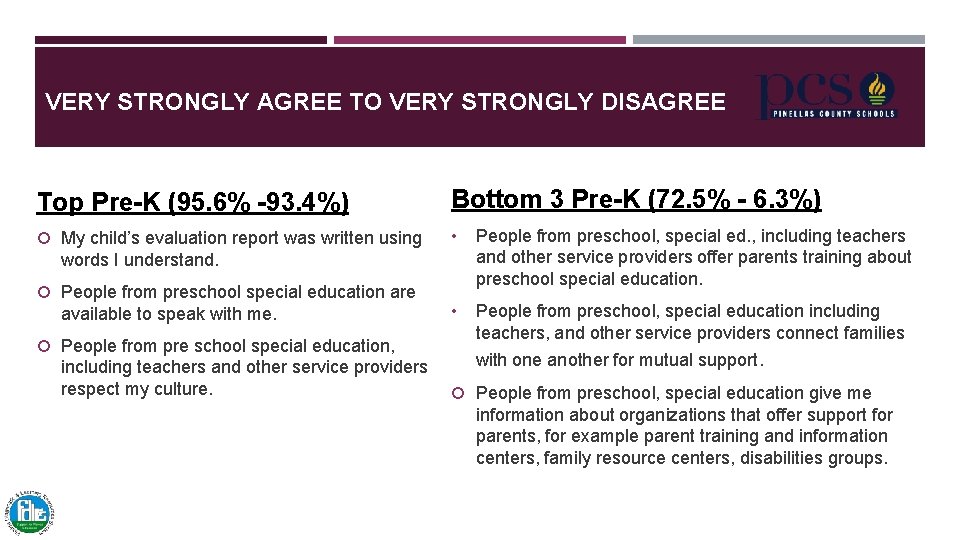
VERY STRONGLY AGREE TO VERY STRONGLY DISAGREE Top Pre-K (95. 6% -93. 4%) Bottom 3 Pre-K (72. 5% - 6. 3%) My child’s evaluation report was written using • People from preschool, special ed. , including teachers and other service providers offer parents training about preschool special education. • People from preschool, special education including teachers, and other service providers connect families words I understand. People from preschool special education are available to speak with me. People from pre school special education, including teachers and other service providers respect my culture. with one another for mutual support. People from preschool, special education give me information about organizations that offer support for parents, for example parent training and information centers, family resource centers, disabilities groups.
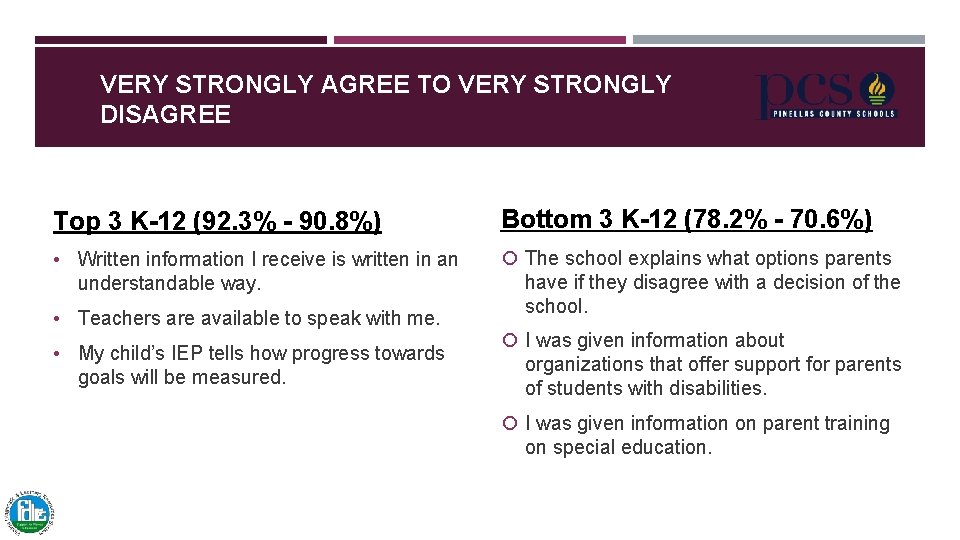
VERY STRONGLY AGREE TO VERY STRONGLY DISAGREE Top 3 K-12 (92. 3% - 90. 8%) Bottom 3 K-12 (78. 2% - 70. 6%) • Written information I receive is written in an The school explains what options parents understandable way. • Teachers are available to speak with me. • My child’s IEP tells how progress towards goals will be measured. have if they disagree with a decision of the school. I was given information about organizations that offer support for parents of students with disabilities. I was given information on parent training on special education.
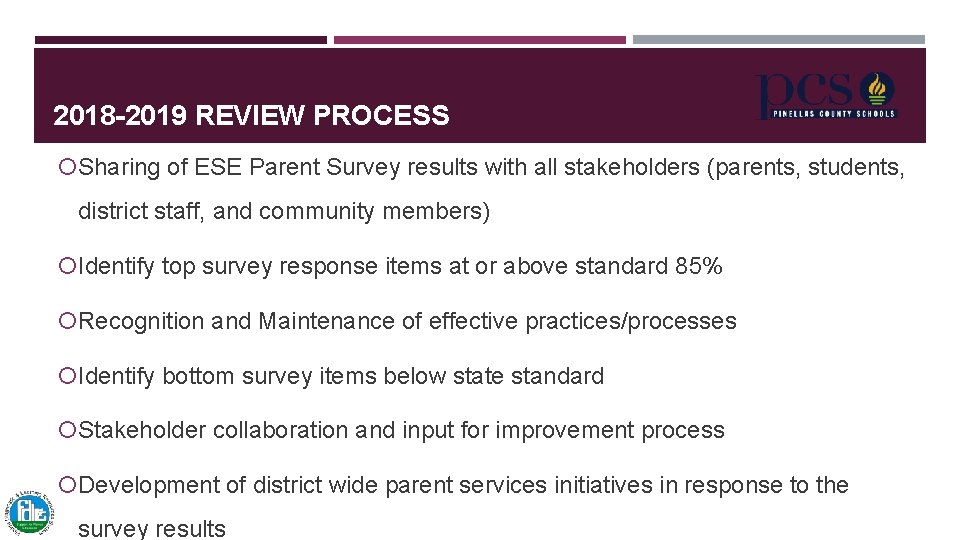
2018 -2019 REVIEW PROCESS Sharing of ESE Parent Survey results with all stakeholders (parents, students, district staff, and community members) Identify top survey response items at or above standard 85% Recognition and Maintenance of effective practices/processes Identify bottom survey items below state standard Stakeholder collaboration and input for improvement process Development of district wide parent services initiatives in response to the survey results