201819 Budget and CIP Overview DANVILLE TOWN COUNCIL

2018/19 Budget and CIP Overview DANVILLE TOWN COUNCIL STUDY SESSION MAY 1, 2018
 released on April 20,")
Process and Timeline Draft Budget and Capital Improvement Program (CIP) released on April 20, 2018 Study sessions to consider Draft Budget and CIP – 8: 30 a. m. on May 1, May 8, May 15 and May 22, 2018 @ Danville Town Offices Public Hearing to consider approving 2018/19 Budget and CIP – 7: 30 p. m. on Wednesday, June 6, 2017 @ Danville Town Meeting Hall

Budget & CIP Format Unchanged from 2017/18 Program pages have been updated, including descriptions, goals and highlights Ten-Year Forecast updated to cover years through 2027/28 Master Fee Schedule updated

Purpose of Budget and CIP Establish/review highest priorities for municipal service delivery to meet unique community needs Identify, plan for and fund one-time capital needs

Danville’s Vision “Small Town Atmosphere, Outstanding Quality of Life”

DANVILLE’S MISSION: Deliver Superior Municipal Services that make people’s lives better We: Ø Ø Ø Ø Keep residents, businesses and property safe Provide well-maintained public facilities Protect our environment, preserve our history and retain our special character Provide opportunities that support residents’ growth and enrichment Promote and support economic vitality and growth Represent and promote Danville’s best interests Celebrate community through family oriented special events Engage and communicate with residents and businesses effectively

BUDGET HISTORY 2004/05 – 2018/19

Revenue Sources 15 Year Avg. 2018/19 % of Total Revenue General Fund 72. 6% 73. 5% Special Revenue 27. 4% 26. 5%

Revenue & Expenditure Growth 15 Year Avg. % Change General Fund Property Tax Sales Tax Special Revenue Operating Expenses * 4. 20% 4. 28% 4. 16% 2. 53% 4. 71% 2018/19 3. 57% 4. 61% 3. 91% 7. 34%* 3. 10% Reflects full phase in of SB 1 and shifting 3% of the Solid Waste Franchise Fee to the Solid Waste V. I. F. Fund

Major Expenditures 15 Year Avg. 2018/19 Personnel 36. 3% 36. 6% Police 30. 0% 30. 5% % of Total Capital Appropriations $7. 47 M $10. 39 M

REVENUES

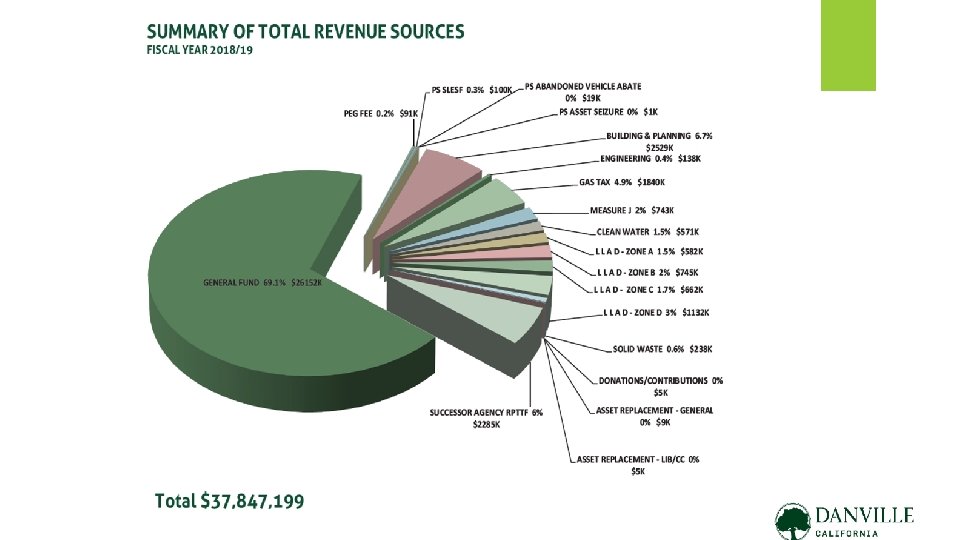
2018/19 Forecast 2017/18 2018/19 +/- $25, 249, 221 $ 8, 766, 847 $34, 016, 068 $26, 152, 198 $ 9, 410, 286 $35, 562, 484 $ 902, 977 $ 643, 439 $ 1, 546, 416 3. 6% 7. 3% 4. 5% Successor Agency $ 2, 181, 597 $ 2, 284, 715 $ 103, 118 4. 7% $37, 847, 199 $ 1, 649, 534 4. 6% Town General Fund Special Revenue TOTAL TOWN GRAND TOTAL $36, 197, 665
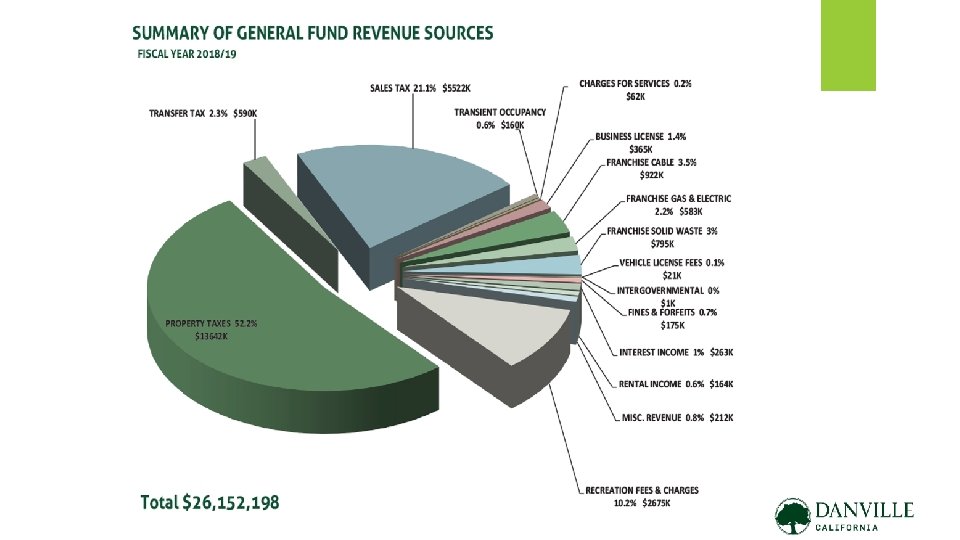

Major Revenues – General Fund Property Tax Sales Tax Franchise Fees Recreation Fees All Other 2017/18 $13, 041, 067 $ 5, 314, 000 $ 2, 378, 874 $ 2, 581, 657 $ 1, 933, 623 2018/19 +/% $13, 642, 000 $ 600, 933 4. 6% $ 5, 522, 000 $ 208, 000 3. 9% $ 2, 299, 730 -$ 79, 144 -3. 3% $ 2, 675, 110 $ 93, 453 3. 6% $ 2, 013, 358 $ 79, 735 4. 1% TOTAL $25, 249, 221 $26, 152, 198 $ 902, 977 3. 6%

Major Revenues – Special Revenue LLAD Building & Planning Gas Tax Measure J RTS Clean Water Solid Waste VIF All Other TOTAL 2017/18 $ 3, 120, 682 $ 2, 752, 600 $ 1, 211, 992 $ 742, 857 $ 570, 793 $ 0 $ 367, 923 $ 8, 766, 847 2018/19 $ 3, 120, 682 $ 2, 529, 200 $ 1, 840, 430 $ 742, 857 $ 570, 793 $ 238, 401 $ 367, 923 $ 9, 410, 286 +/$ -$ $ $ $ 0 223, 400 628, 438 0 0 238, 401 0 643, 439 % 0. 0% -8. 1% 51. 9% 0. 0% NA 0. 0% 7. 3%

EXPENDITURES

2018/19 Recommended 2017/18 2018/19 +/- % Town General Fund Special Revenue TOTAL TOWN $22, 328 $ 9, 389, 529 $31, 711, 857 $23, 114, 329 $ 9, 581, 452 $32, 695, 781 $ 792, 001 $ 191, 923 $ 983, 924 Successor Agency $ 1, 181, 597 $ 1, 184, 715 $ 3, 118 0. 3% GRAND TOTAL $32, 893, 454 $33, 880, 496 $ 987, 042 3. 0% 3. 5% 2. 0% 3. 1%
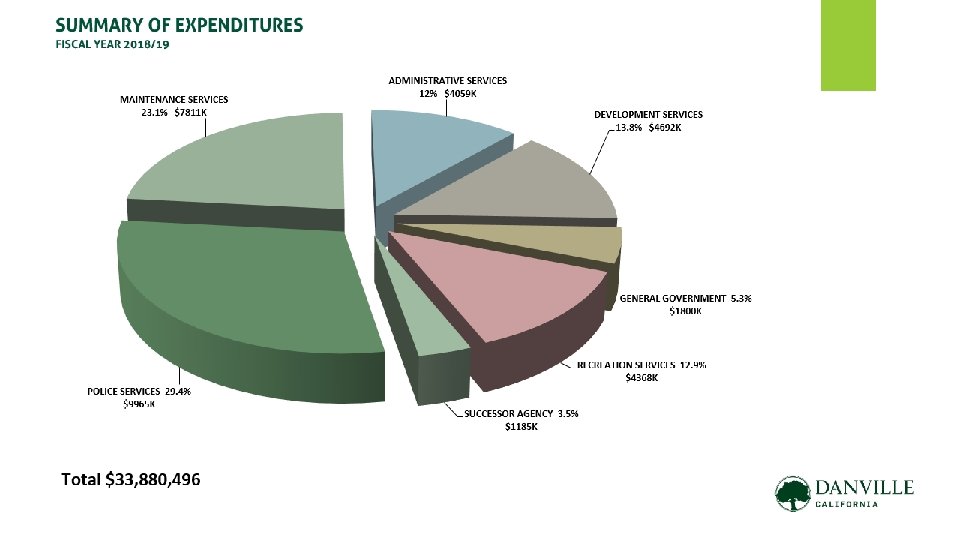

By Department General Gov’t Police Administrative Services Development Services Maintenance Services Recreation, Arts & Community Services TOTAL 2017/18 2018/19 +/- % $ 1, 933, 215 $ 9, 644, 494 $ 3, 888, 736 $ 4, 453, 198 $ 7, 554, 321 $ 1, 799, 546 $ 9, 965, 204 $ 4, 059, 391 $ 4, 691, 813 $ 7, 811, 342 ($ 133, 669) $ 320, 710 $ 170, 665 $ 238, 615 $ 257, 021 -6. 9% 3. 3% 4. 4% 5. 4% 3. 4% $ 4, 237, 893 $31, 711, 857 $ 4, 368, 485 $32, 695, 781 $ 130, 592 $ 983, 924 3. 1%

Purpose for Change Department General Government Police Services Administrative Services Development Services Maintenance Services Recreation, Arts, & Community Services $ Change Reason(s) from 17/18 Reduced 1. 0 FTE by shifting Assistant T. M. position to Development Services; increased costs for 2018 ($133, 669) Municipal Elections; increased personnel costs Increase in contract cost for sworn personnel; increase in $320, 710 contract cost for animal services Increased liability insurance premiums; increased $170, 665 personnel costs Increased 1. 0 FTE by shifting Assistant T. M. position to Development Services and backfilling former D. S. Director position with 1. 0 Associate Civil Engineer; increased $238, 625 personnel costs Increased utility costs in Roadside and Park Maintenance; $257, 021 increased personnel costs Increased instructor/ contract services costs among all $130, 592 department programs; increased personnel costs

By Category 2017/18 Employee Expenses Temporary Salaries Administration Materials & Supplies Contracted Services Equipment Program Activities TOTAL $11, 598, 838 $ 1, 161, 429 $ 628, 590 $ 1, 548, 921 $12, 631, 870 $ 908, 712 $ 3, 233, 497 $31, 711, 857 2018/19 $11, 946, 804 $ 1, 154, 149 $ 646, 813 $ 1, 588, 374 $12, 839, 689 $ 919, 916 $ 3, 600, 036 $32, 695, 781 +/- $ ($ $ $ $ % 347, 966 3. 0% 7, 280) -0. 6% 18, 223 2. 9% 39, 453 2. 5% 207, 819 1. 6% 11, 204 1. 2% 366, 539 11. 3% 983, 924 3. 1%

Purpose for Change Department Employee Expenses $ Change from 17/18 Purpose Increased Workers Compensation and benefit costs; merit based $347, 996 pay increases Temporary Salaries ($7, 280) Reduced cost for temporary staff – all departments Administration $18, 223 Incremental increases across all programs and departments Materials and Supplies $39, 453 Incremental increases across all programs and departments Contract Services Equipment Program Activities Increased costs in Police Services and General Government $207, 819 (election), offset by reduced costs in Development Services Incremental increases across all programs and departments $11, 204 offset by reduced Asset Replacement costs $366, 539 Increased liability insurance costs in Administrative Services; increased utility costs in Maintenance Svcs.

2018/19 LLAD Fund Activity Op. & Capital Zone Expenses Assessment Revenue % +/- Transfer In G. F. Subsidy +/- in Fund Balance A $ 926, 673 $ 582, 115 62. 8% ($ 344, 558) $ 350, 000 B $ 998, 730 $ 744, 744 74. 6% ($ 253, 986) $ 150, 000 ($ 103, 986) C $ 865, 747 $ 662, 204 76. 5% ($ 203, 543) $ 0 ($ 203, 543) D $1, 706, 075 $1, 131, 619 66. 3% ($ 574, 456) $ 400, 000 ($ 174, 456) $4, 497, 225 $3, 120, 682 69. 4% ($1, 376, 543) $ 900, 000 ($ 476, 543) * $ 5, 442 G. F. Subsidy Increases from $800, 000 to $900, 000; available LLAD Fund Balance reduced from $3, 465, 030 to $2, 988, 487

Recommended Fund Transfers REVENUES Operating Revenues/Transfers Less Operating Expenses CDA Loan Re-Payment Gross Funds Available TRANSFERS LLAD Operations Pavement Management Asset Replacement CIP General Purpose Total Transfers 2017/18 2018/19 $25, 546, 774 ($22, 328) $ 1, 000 $ 4, 224, 446 $26, 449, 751 ($23, 114, 329) $ 1, 100, 000 $ 4, 435, 422 $ 800, 000 $ 1, 524, 446 $ 4, 224, 446 $ 900, 000 $ 1, 510, 000 $ 100, 000 $ 1, 925, 422 $ 4, 435, 422

Personnel Allocation General Government Police Services Administrative Services Development Services Maintenance Services Recreation, Arts & C. S. TOTAL Permanent Contract Temporary Total 5. 75 15. 00 28. 50 28. 00 15. 75 94. 75 0. 00 30. 00 0. 50 6. 00 0. 75 1. 00 3. 00 26. 25 37. 50 6. 25 37. 75 15. 75 29. 50 31. 00 42. 00 162. 25
 Assistant Town Manager Ø - 1. 0")
Personnel Changes Ø General Government Eliminated (shifted) Assistant Town Manager Ø - 1. 0 FTE Development Services Eliminated Development Services Director Added (shifted) Assistant Town Manager Added Associate Civil Engineer Ø Net Change Ø Total Compensation Survey currently underway - 1. 0 FTE +1. 0 FTE 0. 0 FTE

Summary - Budget 2018/19 Budget is balanced; services continued to be delivered at current levels; healthy operating and capital reserves are maintained; Town has no unfunded liabilities. Ø Overall financial condition continues to be positive in the short to mid -term. Ø Ø Second half of ten-year forecasts show the GF subsidy to LLAD and end of CDA loan repayment significantly impact operations. Town will need to re-visit LLAD rates along with opportunities to generate other revenues; or alternately re-visit service levels.

Summary - CIP Ø Recommend funding 42 capital projects totaling $10. 39 million w/no debt. Ø Major progress with Downtown Parking – Rose Street and VTAG Expansion add 210 spaces Ø Fund Balance available in CIP General Purpose is not sufficient to fund currently planned projects over the next 5 years absent additional revenue. Ø GF transfers required to support the LLAD + retirement of CDA debt to Town will eliminate new GF transfers to support CIP.

Review Budget Programs
- Slides: 30