2018 State Accountability AF Accountability 2018 September 20

2018 State Accountability A-F Accountability 2018 September 20, 2018 District Board Meeting

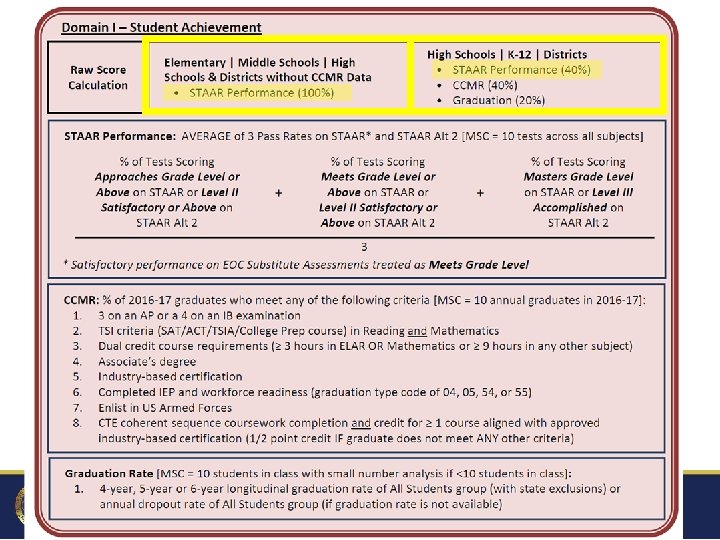
New Accountability System: A-F Domain I: Student Achievement Domain II: School Progress Domain III: Closing the Gaps Elementary & Middle Schools: • STAAR Performance (100%) • % Approaches, % Meets, and % Masters Part A: Academic Growth • Based on Student Growth and Performance in Reading & Math # of Student Groups Meeting Targets • 14 groups – Ethnicities, Eco. Dis, SPED, EL, Enrollment Groups High Schools: • STAAR Performance (40%) • % Approaches, % Meets, and % Masters • CCMR - College, Career, Military Readiness (40%) • Graduation Rate (20%) Part B: Relative Performance • STAAR Performance compared to a predicted performance based on % Eco Dis Groups will be measured on: • STAAR Growth • STAAR Performance (Approaches, Meets, Masters) • EL Proficiency • CCMR & Graduation

On an assessment with 4 performance levels … there are 3 pass rates! Approaches Did Not Meet Grade Level Meets Approaches Grade Level Masters Meets Grade Level Masters Grade Level % Masters Grade % Meets Grade % Approaches Grade Level Grade Level % Meets Grade % Masters Grade % Meets Grade Level % Masters Grade Level

Clint ISD 2018 Ratings The “What If” Report will have letter grades in Nov. /Dec.

© lead 4 ward 2017

accountability

… so let’s have F U N igure out how to calculate Domain scores nderstand the impact of Domains avigate connections to instruction

A few things before we get started… © lead 4 ward 2017

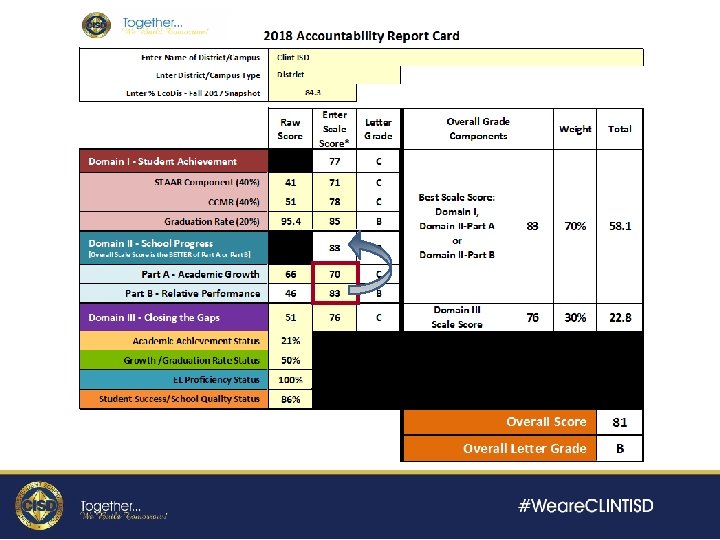
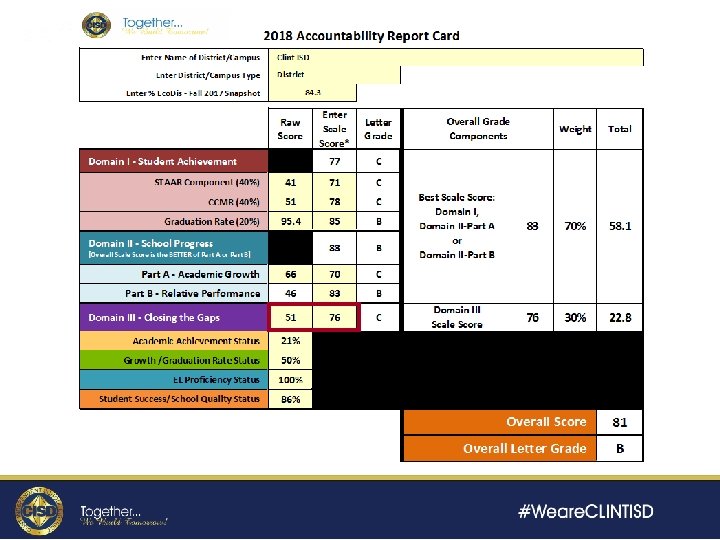
Overall Rating Ø Ø 30% on Domain III 70% on the better of Domain I or Domain II Since Domain II is the better of Part A or Part B … 70% of the overall rating will be based on the BEST of Domain III 30% q Domain II – Part A q Domain II – Part B Overall Rating Domain III [VALUE] © lead 4 ward 2017 70% Best Score [CATEGORY NAME]Domain I [VALUE] OR [CATEGORY NAME]Domain II – Part A [VALUE] OR [CATEGORY NAME]Domain II – Part B [VALUE] Better of Domain I or Domain II 70%

Online Testing Disruptions CTW DHE FME MVE RSE WDS District-ES Total Students % of Students with Disruptions Who Failed for Both Admins Failed 9 7 78% 34 26 76% 9 8 89% 20 11 55% 8 7 88% 108 78 72% 188 137 73% CJHS EMMS HMS REMS District-MS Total Students Total % of with Disruptions Students for Both Admins Who Failed 65 53 82% 108 83 77% 155 131 85% 58 49 84% 386 316 82% Spring 2018 STAAR EOC, English I CHS HHS MVHS District-HS © lead 4 ward 2017 Total Did Not Students Meet 8 21 33 62 7 19 30 56 % of Students Who Failed 88% 90% 91% 90%

HB 22 This + This

What would Student Achievement have looked like in the OLD DAYS? (i. e. , LAST YEAR!)

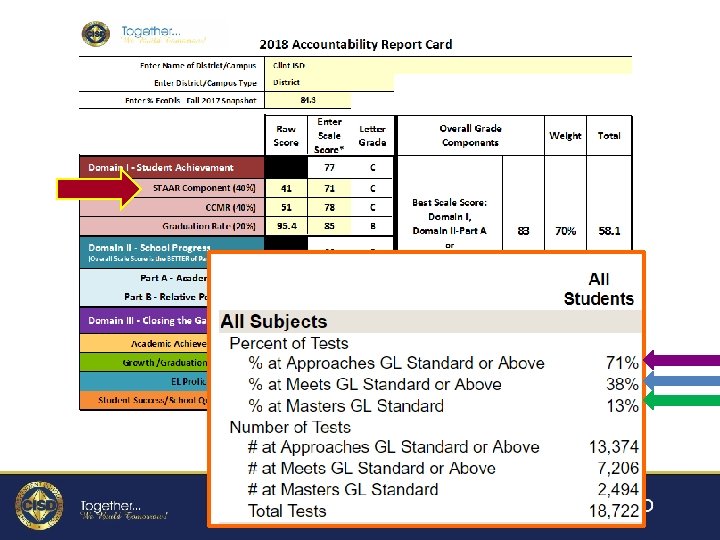
STAAR Performance 71 + 38 + 13 = 122 So … what does Student Achievement 122 ÷ 3 = 41 look like THIS year? ? Score = 41

STAAR Performance in 2018 -19?

what impact does this have? let’s say this is how our students did in 2017 -18 … Approaches Meets Masters 70% Approaches 70 % Meets 30 % Masters 10 AVERAGE 37 30% Meets 10% Masters

what impact does this have? how do we get better? what if in 2018 -19 we do what we have always done – which means focus on our lowest performing students Approaches Meets Masters 80% Approaches 80 % Meets 20 % Masters 10 AVERAGE 37 20% Meets 10% Masters

what impact does this have? what if we re-envision planning and instruction … and we focus on ALL students (ESPECIALLY students who are already passing) … Approaches Meets Masters 80% Approaches 80 % Meets 50 % Masters 20 AVERAGE 50 50% Meets 20% Masters

what impact does this have? what if the result of fousing on ALL students means that we don’t actually move any students from Did Not Meet to Approaches … Approaches Meets Masters 70% Approaches 70 % Meets 50 % Masters 20 AVERAGE 47 50% Meets 20% Masters

the takeaway… historically, the accountability system in Texas has been a PUSH THE STRING system meaning … focus on the lowest performing students to get them to passing (even at the cost of failing to appropriately serve the highest performing students) 2018 Accountability will reward schools that PULL THE STRING meaning … focus on the needs of ALL students – particularly high performing students and leverage their learning to benefit all students!

what does this mean for planning? how do we pull all students up? Approaches Did Not Meet Grade Level Meets Approaches Grade Level 3 Masters Meets Grade Level 2 Masters Grade Level 1

HB 22
 Ø This is what it looks like …")
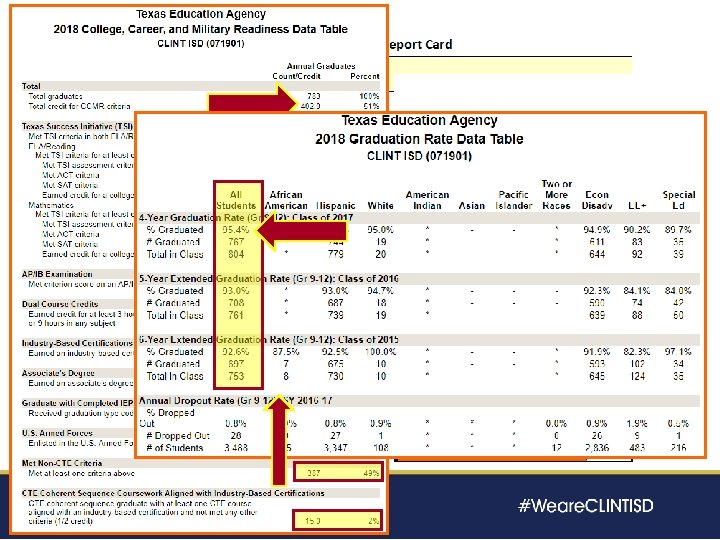
College, Career, Military Readiness (CCMR) Ø This is what it looks like …
 Ø This is what it looks like … Y")
College, Career, Military Readiness (CCMR) Ø This is what it looks like … Y Y Y Y 1 N N N Y Y N N N N N N N N N N N N N Y N N 1 0 1 1. 5 0 0

HB 22 Graduation Rate [MSC = 10 students in class with small number analysis if <10 students in class]: 1. 4 -year, 5 -year or 6 -year longitudinal graduation rate of All Students group (with state exclusions) or annual dropout rate of All Students group (if graduation rate is not available)

HB 22

Part A Part B

School Progress Domain Part A: Academic Growth Ø Methodology q Calculate based on Reading and Math combined results (beginning at Grade 4) v v q Reading tests: Grades 4 -8 and English II Math tests: Grades 4 -8 and Algebra I Success = v v Maintain Performance Level Meet STAAR Progress

0 Points – Went Backwards 2018 2017 © lead 4 ward 2018 . 5 Point – Did not Meet Progress 1 Point- Met or Exceeded Progress

how? © lead 4 ward 2018

Do NOT let kids fail backwards! looking at Starting with how growth students did in … what is the Spring 2018 NUMBER 1 priority for S pring 2019? Approaches to Approaches Meets stay Meets Masters stay Masters

Part A Part B

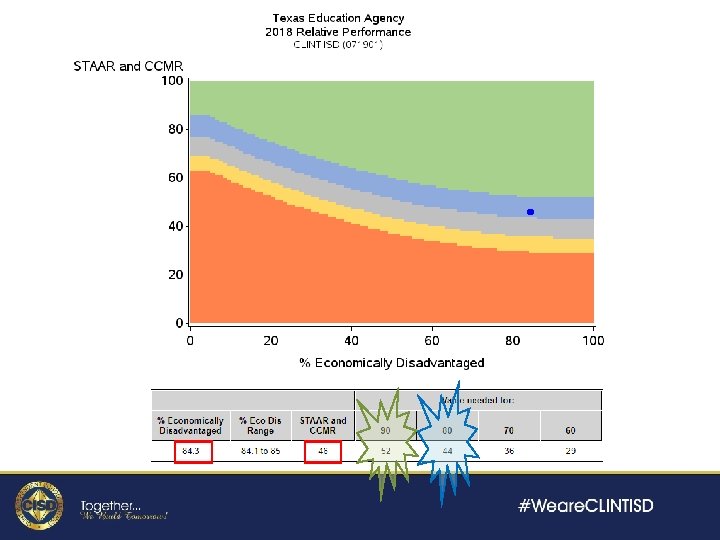
School Progress Domain Part B: Relative Performance Ø Methodology q Relative Performance For each district/campus, look at 2 measures 1. Domain I Score q q STAAR Performance Only, OR Average of STAAR Performance and CCMR 2. % Eco. Dis Students q Compare ACTUAL Domain I Score to PREDICTED Domain I Score (for a district/campus with the same % Eco. Dis)
 Student Achievement What about 2")
(STAAR Performance or Average of STAAR Performance and CCMR) Student Achievement What about 2 campuses with the SAME Domain I Score, but different %ages of Eco. Dis? C? ? A • • Domain I Score = 66
 becomes")
Part A Part B Whichever score is BETTER (Part A or Part B) becomes the Domain II Score

High Schools and Districts Elem and Middle Schools 14 student groups

Targets
 %")
Meets Grade Level Component 35% 41% 35% 38% 43% Academic Achievement (Meets GL) % age of Evaluated 50%Indicators 24%Met 36% 20% Weight Total Points 19% 38% 28% 38% 42% 35% 4/19 = 21% 50% 10. 5 4 -Year Federal Graduation Rate 3/6 = 50% 10% 5. 0 EL Language Proficiency (TELPAS) TELPAS Composite 1/1 = 100% 10. 0 6/7 = 86% 30. 0 4 -Year Grad Rate Score Increase CCMR School Quality (CCMR) Closing the Gaps Raw Domain Score 51

what is my overall rating?

overall rating Ø Ø 30% on Domain III 70% on the better of Domain I or Domain II Since Domain II is the better of Part A or Part B … 70% of the overall rating will be based on the BEST of Domain III 30% q Domain II – Part A q Domain II – Part B Overall Rating Domain III [VALUE] 70% Best Score [CATEGORY NAME]Domain I [VALUE] OR [CATEGORY NAME]Domain II – Part A [VALUE] OR [CATEGORY NAME]Domain II – Part B [VALUE] Better of Domain I or Domain II 70%

Scale Scores and Ratings for Districts: q 90 to 100 = A q 80 to 89 = B q 70 to 79 = C q 60 to 69 = D q < 60 = F Overall Score and Rating

Clint ISD 2018 Ratings The “What If” Report will have letter grades in Nov. /Dec.

Thank you!
- Slides: 48