
2018 ASSET BASED LENDING STATS THOMSON REUTERS LPC
2018 ASSET BASED LENDING STATS THOMSON REUTERS LPC 1 H 2018 Maria C. Dikeos Director of Analysis maria. dikeos@thomsonreuters. com 646 -223 -6820
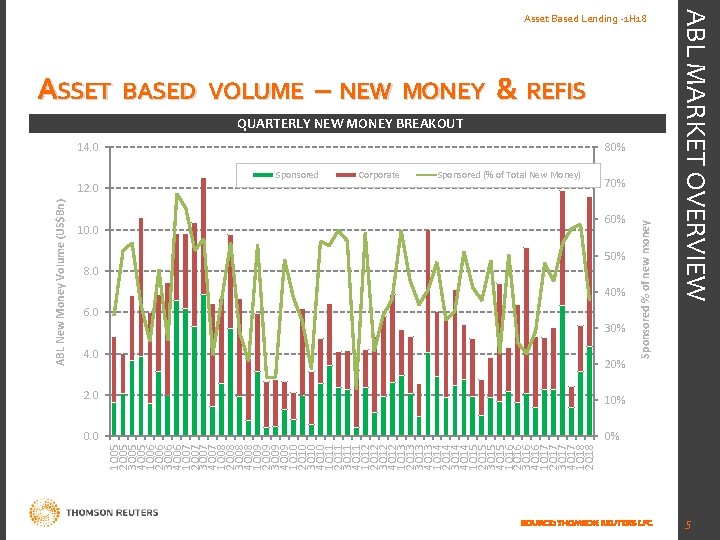
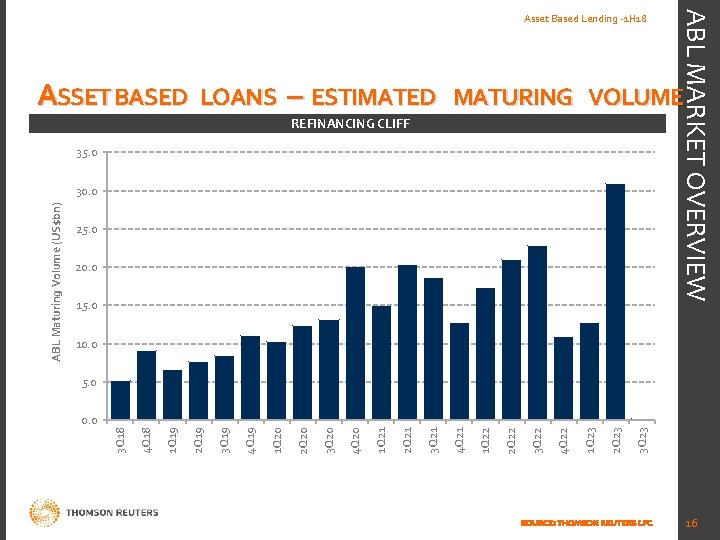
KEY POINTS • US syndicated asset based loan volume totaled US$32 billion in 2 Q 2018, a 63% increase over the US$20 billion raised in 1 Q 18, and a 21% increase year over year. The result also set new quarterly high for asset based lending. An additional US$900 million in clubbed issuance also was completed during the quarter. • Year to date, US syndicated asset based loan volume was north of US$52 billion, a nearly 14% increase compared to the same time last year (US$46 billion). Of this total, over 17% backed M&A activity, the highest pro rata share since 2008. • On a deal count basis, the calendar saw 80 deals work their way through the retail market in 2 Q, up from 69 in 1 Q 18. • Roughly US$17 billion of syndicated ABL loan volume or 33% of total issuance represented new loan assets. • New syndicated loan assets totaled just under US$12 billion in 2 Q 2018, the second highest quarterly total on record, and the highest since 4 Q 2007. New money issuance made up to make up just over 36% of quarterly issuance. 37% of total new money loan assets during the quarter came via sponsored credits. • Just over 38% of total ABL issuance year to date represented deals or amendments of US$150 million or less in size. This is down from over 51% for the same grouping in full year 2017. In contrast, nearly 19% of ABL issuance on a deal basis was at least US$500 million or greater, up from just over 13% for full year 2017. ABL MARKET OVERVIEW Asset Based Lending -1 H 18 • Over 21% of total ABL volume in 2 Q 2018 was for borrowers in the oil and gas space. An additional 20% represented liquidity for retail and supermarket names and general manufacturing borrowers represented over 17% of total quarterly lending. • As a result of the volume of refinancing activity, the maturity wall for ABL credits has been pushed out to 2023. It is estimated that nearly US$48 billion in ABL issuance may be up for renewal (based on upcoming maturity) in 2 H 2018 and full year 2019. • Quarter over quarter average spreads on ABL credits saw tightening amid strong lender demand for assets. Over 45% of total asset based lending during the quarter was priced at or below 150 bps over Libor. More than 60% of all deals which cleared the market were priced at or below 175 bps over Libor during the same time period. 2
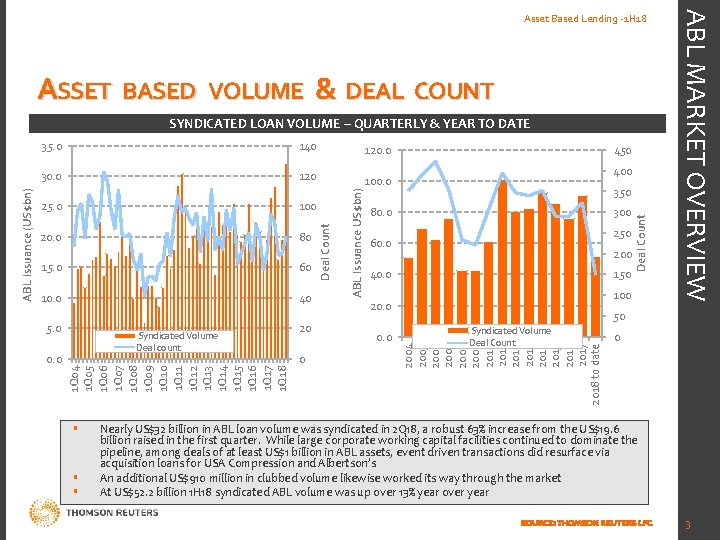
ASSET BASED VOLUME & DEAL COUNT 30. 0 120 100 20. 0 80 15. 0 60 10. 0 40 5. 0 Syndicated Volume Deal count 0. 0 20 0 400 350 80. 0 300 250 60. 0 200 40. 0 150 100 20. 0 50 Syndicated Volume Deal Count 0 2004 2005 2006 2007 2008 2009 2010 2011 2012 2013 2014 2015 2016 2017 2018 to date 25. 0 450 Deal Count 120. 0 ABL Issuance US$bn) 140 Deal Count 35. 0 1 Q 04 1 Q 05 1 Q 06 1 Q 07 1 Q 08 1 Q 09 1 Q 10 1 Q 11 1 Q 12 1 Q 13 1 Q 14 1 Q 15 1 Q 16 1 Q 17 1 Q 18 ABL Issuance (US$bn) SYNDICATED LOAN VOLUME – QUARTERLY & YEAR TO DATE ABL MARKET OVERVIEW Asset Based Lending -1 H 18 Nearly US$32 billion in ABL loan volume was syndicated in 2 Q 18, a robust 63% increase from the US$19. 6 billion raised in the first quarter. While large corporate working capital facilities continued to dominate the pipeline, among deals of at least US$1 billion in ABL assets, event driven transactions did resurface via acquisition loans for USA Compression and Albertson’s An additional US$910 million in clubbed volume likewise worked its way through the market At US$52. 2 billion 1 H 18 syndicated ABL volume was up over 13% year over year SOURCE: THOMSON REUTERS LPC 3
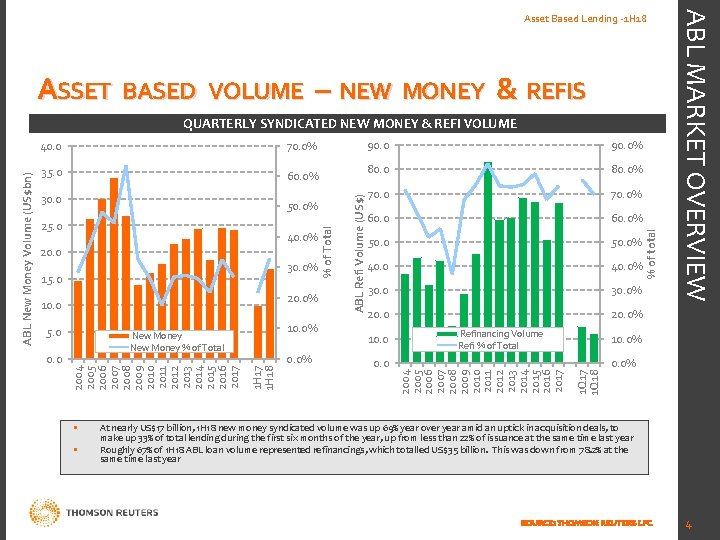
ASSET BASED VOLUME – NEW MONEY & REFIS 30. 0 25. 0 40. 0% 20. 0 30. 0% 15. 0 20. 0% 10. 0 5. 0 10. 0% New Money % of Total 0. 0% 1 H 17 1 H 18 0. 0 % of Total 50. 0% 80. 0% 70. 0% 60. 0% 50. 0% 40. 0% 30. 0% 20. 0% 10. 0 Refinancing Volume Refi % of Total % of total 60. 0% 90. 0% 10. 0% 1 Q 17 1 Q 18 35. 0 90. 0 2004 2005 2006 2007 2008 2009 2010 2011 2012 2013 2014 2015 2016 2017 70. 0% ABL Refi Volume (US$) 40. 0 2004 2005 2006 2007 2008 2009 2010 2011 2012 2013 2014 2015 2016 2017 ABL New Money Volume (US$bn) QUARTERLY SYNDICATED NEW MONEY & REFI VOLUME ABL MARKET OVERVIEW Asset Based Lending -1 H 18 At nearly US$17 billion, 1 H 18 new money syndicated volume was up 69% year over year amid an uptick in acquisition deals, to make up 33% of total lending during the first six months of the year, up from less than 22% of issuance at the same time last year Roughly 67% of 1 H 18 ABL loan volume represented refinancings, which totalled US$35 billion. This was down from 78. 2% at the same time last year SOURCE: THOMSON REUTERS LPC 4
VOLUME 14. 0 Sponsored Corporate Sponsored (% of Total New Money) 10. 0 60% 50% 8. 0 40% 6. 0 30% 4. 0 20% 2. 0 10% 0. 0 0% Sponsored % of new money 12. 0 1 Q 05 2 Q 05 3 Q 05 4 Q 05 1 Q 06 2 Q 06 3 Q 06 4 Q 06 1 Q 07 2 Q 07 3 Q 07 4 Q 07 1 Q 08 2 Q 08 3 Q 08 4 Q 08 1 Q 09 2 Q 09 3 Q 09 4 Q 09 1 Q 10 2 Q 10 3 Q 10 4 Q 10 1 Q 11 2 Q 11 3 Q 11 4 Q 11 1 Q 12 2 Q 12 3 Q 12 4 Q 12 1 Q 13 2 Q 13 3 Q 13 4 Q 13 1 Q 14 2 Q 14 3 Q 14 4 Q 14 1 Q 15 2 Q 15 3 Q 15 4 Q 15 1 Q 16 2 Q 16 3 Q 16 4 Q 16 1 Q 17 2 Q 17 3 Q 17 4 Q 17 1 Q 18 2 Q 18 ABL New Money Volume (US$Bn) ASSET BASED – NEW MONEY & REFIS QUARTERLY NEW MONEY BREAKOUT 80% 70% SOURCE: THOMSON REUTERS LPC ABL MARKET OVERVIEW Asset Based Lending -1 H 18 5
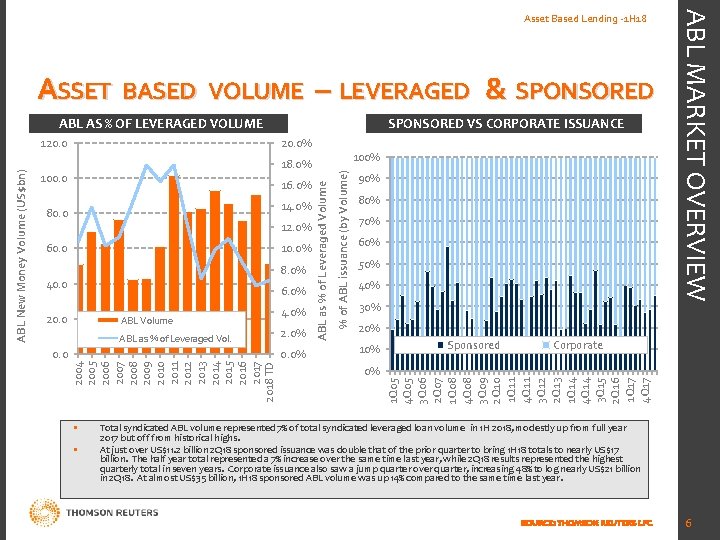
VOLUME – LEVERAGED & SPONSORED ABL AS % OF LEVERAGED VOLUME 20. 0% 16. 0% 14. 0% 80. 0 12. 0% 60. 0 10. 0% 8. 0% 40. 0 6. 0% 20. 0 ABL Volume ABL as % of Leveraged Vol. 0. 0 4. 0% 2. 0% 0. 0% ABL as % of Leveraged Volume 100. 0 % of ABL issuance (by Volume) 100% 18. 0% 2004 2005 2006 2007 2008 2009 2010 2011 2012 2013 2014 2015 2016 2017 2018 TD ABL New Money Volume (US$bn) 120. 0 SPONSORED VS CORPORATE ISSUANCE 90% 80% 70% 60% 50% 40% 30% 20% 10% Sponsored Corporate 0% 1 Q 05 4 Q 05 3 Q 06 2 Q 07 1 Q 08 4 Q 08 3 Q 09 2 Q 10 1 Q 11 4 Q 11 3 Q 12 2 Q 13 1 Q 14 4 Q 14 3 Q 15 2 Q 16 1 Q 17 4 Q 17 ASSET BASED ABL MARKET OVERVIEW Asset Based Lending -1 H 18 Total syndicated ABL volume represented 7% of total syndicated leveraged loan volume in 1 H 2018, modestly up from full year 2017 but off from historical highs. At just over US$11. 2 billion 2 Q 18 sponsored issuance was double that of the prior quarter to bring 1 H 18 totals to nearly US$17 billion. The half year total represented a 7% increase over the same time last year, while 2 Q 18 results represented the highest quarterly total in seven years. Corporate issuance also saw a jump quarter over quarter, increasing 48% to log nearly US$21 billion in 2 Q 18. At almost US$35 billion, 1 H 18 sponsored ABL volume was up 14% compared to the same time last year. SOURCE: THOMSON REUTERS LPC 6
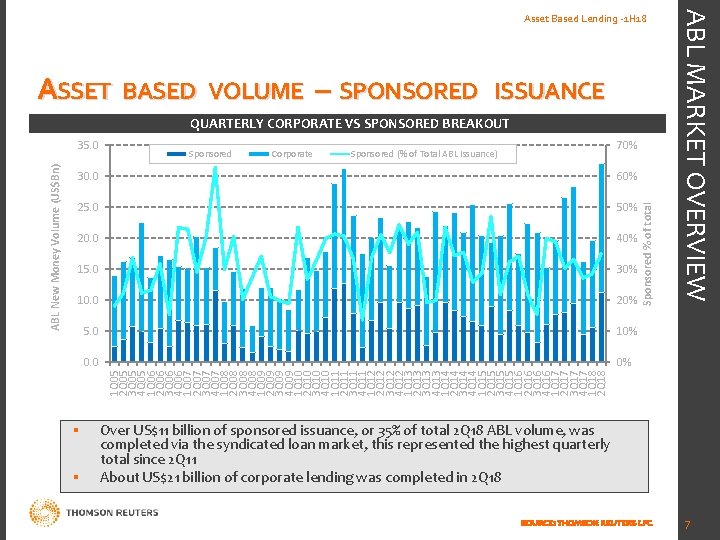
ASSET BASED VOLUME – SPONSORED ISSUANCE QUARTERLY CORPORATE VS SPONSORED BREAKOUT Corporate 70% Sponsored (% of Total ABL Issuance) 30. 0 60% 25. 0 50% 20. 0 40% 15. 0 30% 10. 0 20% 5. 0 10% 0. 0 0% Sponsored % of total Sponsored 1 Q 05 2 Q 05 3 Q 05 4 Q 05 1 Q 06 2 Q 06 3 Q 06 4 Q 06 1 Q 07 2 Q 07 3 Q 07 4 Q 07 1 Q 08 2 Q 08 3 Q 08 4 Q 08 1 Q 09 2 Q 09 3 Q 09 4 Q 09 1 Q 10 2 Q 10 3 Q 10 4 Q 10 1 Q 11 2 Q 11 3 Q 11 4 Q 11 1 Q 12 2 Q 12 3 Q 12 4 Q 12 1 Q 13 2 Q 13 3 Q 13 4 Q 13 1 Q 14 2 Q 14 3 Q 14 4 Q 14 1 Q 15 2 Q 15 3 Q 15 4 Q 15 1 Q 16 2 Q 16 3 Q 16 4 Q 16 1 Q 17 2 Q 17 3 Q 17 4 Q 17 1 Q 18 2 Q 18 ABL New Money Volume (US$Bn) 35. 0 ABL MARKET OVERVIEW Asset Based Lending -1 H 18 Over US$11 billion of sponsored issuance, or 35% of total 2 Q 18 ABL volume, was completed via the syndicated loan market, this represented the highest quarterly total since 2 Q 11 About US$21 billion of corporate lending was completed in 2 Q 18 SOURCE: THOMSON REUTERS LPC 7
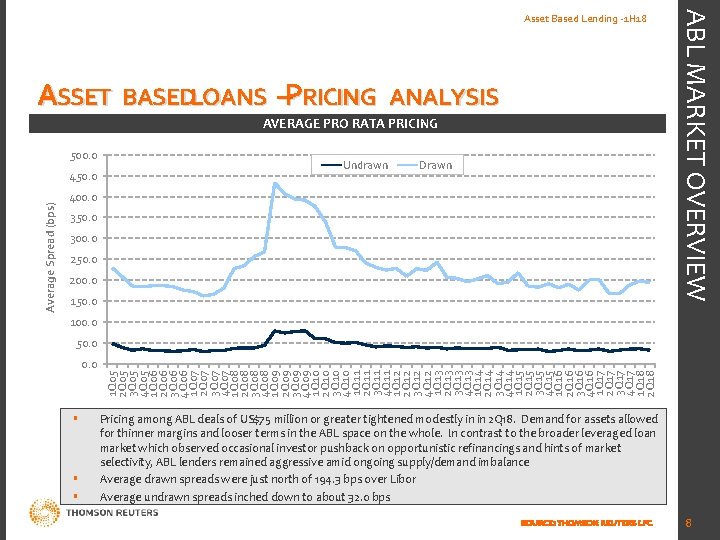
ASSET BASEDLOANS –PRICING ANALYSIS AVERAGE PRO RATA PRICING 500. 0 Undrawn Drawn 400. 0 350. 0 300. 0 250. 0 200. 0 150. 0 100. 0 50. 0 1 Q 05 2 Q 05 3 Q 05 4 Q 05 1 Q 06 2 Q 06 3 Q 06 4 Q 06 1 Q 07 2 Q 07 3 Q 07 4 Q 07 1 Q 08 2 Q 08 3 Q 08 4 Q 08 1 Q 09 2 Q 09 3 Q 09 4 Q 09 1 Q 10 2 Q 10 3 Q 10 4 Q 10 1 Q 11 2 Q 11 3 Q 11 4 Q 11 1 Q 12 2 Q 12 3 Q 12 4 Q 12 1 Q 13 2 Q 13 3 Q 13 4 Q 13 1 Q 14 2 Q 14 3 Q 14 4 Q 14 1 Q 15 2 Q 15 3 Q 15 4 Q 15 1 Q 16 2 Q 16 3 Q 16 4 Q 16 1 Q 17 2 Q 17 3 Q 17 4 Q 17 1 Q 18 2 Q 18 Average Spread (bps) 450. 0 ABL MARKET OVERVIEW Asset Based Lending -1 H 18 Pricing among ABL deals of US$75 million or greater tightened modestly in in 2 Q 18. Demand for assets allowed for thinner margins and looser terms in the ABL space on the whole. In contrast to the broader leveraged loan market which observed occasional investor pushback on opportunistic refinancings and hints of market selectivity, ABL lenders remained aggressive amid ongoing supply/demand imbalance Average drawn spreads were just north of 194. 3 bps over Libor Average undrawn spreads inched down to about 32. 0 bps SOURCE: THOMSON REUTERS LPC 8
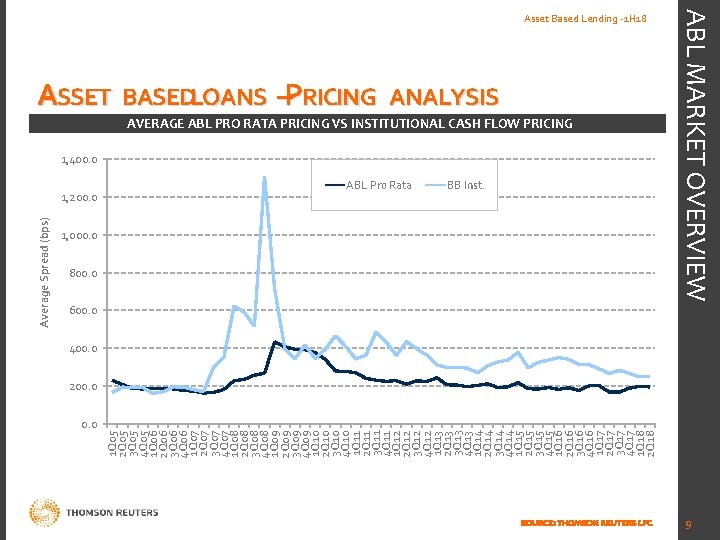
1, 200. 0 1 Q 05 2 Q 05 3 Q 05 4 Q 05 1 Q 06 2 Q 06 3 Q 06 4 Q 06 1 Q 07 2 Q 07 3 Q 07 4 Q 07 1 Q 08 2 Q 08 3 Q 08 4 Q 08 1 Q 09 2 Q 09 3 Q 09 4 Q 09 1 Q 10 2 Q 10 3 Q 10 4 Q 10 1 Q 11 2 Q 11 3 Q 11 4 Q 11 1 Q 12 2 Q 12 3 Q 12 4 Q 12 1 Q 13 2 Q 13 3 Q 13 4 Q 13 1 Q 14 2 Q 14 3 Q 14 4 Q 14 1 Q 15 2 Q 15 3 Q 15 4 Q 15 1 Q 16 2 Q 16 3 Q 16 4 Q 16 1 Q 17 2 Q 17 3 Q 17 4 Q 17 1 Q 18 2 Q 18 Average Spread (bps) ASSET BASEDLOANS –PRICING ANALYSIS AVERAGE ABL PRO RATA PRICING VS INSTITUTIONAL CASH FLOW PRICING 1, 400. 0 ABL Pro Rata BB Inst. 1, 000. 0 800. 0 SOURCE: THOMSON REUTERS LPC ABL MARKET OVERVIEW Asset Based Lending -1 H 18 600. 0 400. 0 200. 0 9
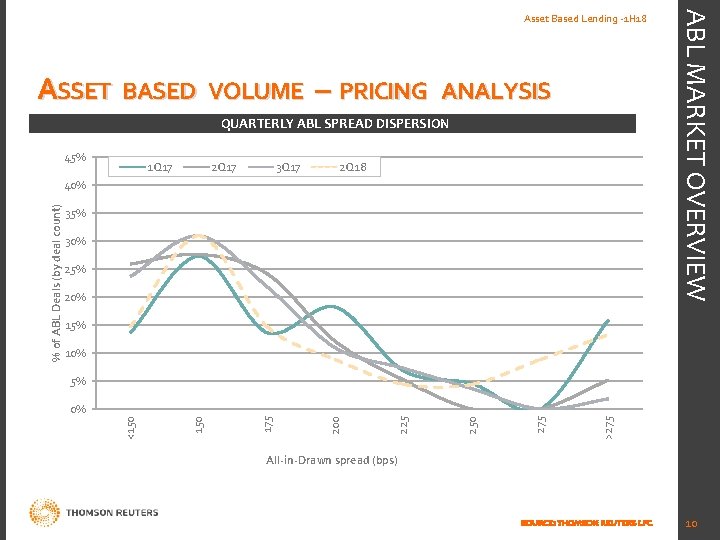
ASSET BASED VOLUME – PRICING ANALYSIS QUARTERLY ABL SPREAD DISPERSION 45% 1 Q 17 2 Q 17 3 Q 17 2 Q 18 35% 30% 25% 20% 15% 10% 5% >275 250 225 200 175 150 0% <150 % of ABL Deals (by deal count) 40% ABL MARKET OVERVIEW Asset Based Lending -1 H 18 All-in-Drawn spread (bps) SOURCE: THOMSON REUTERS LPC 10
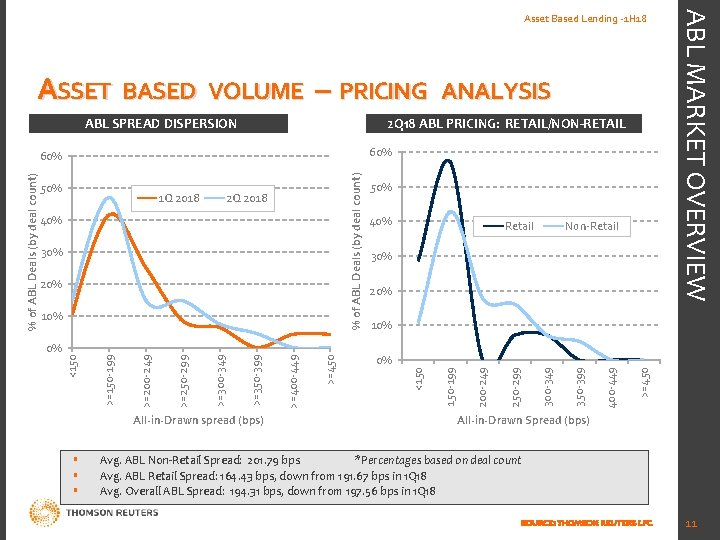
ASSET BASED VOLUME – PRICING ABL SPREAD DISPERSION 2 Q 18 ABL PRICING: RETAIL/NON-RETAIL 60% All-in-Drawn spread (bps) 20% 10% 0% >=450 >=400 -449 >=350 -399 >=300 -349 >=250 -299 >=200 -249 >=150 -199 <150 0% 30% 400 -449 10% Non-Retail 350 -399 20% Retail 300 -349 30% 40% 250 -299 40% 50% 200 -249 2 Q 2018 150 -199 1 Q 2018 <150 50% % of ABL Deals (by deal count) 60% % of ABL Deals (by deal count) ANALYSIS ABL MARKET OVERVIEW Asset Based Lending -1 H 18 All-in-Drawn Spread (bps) Avg. ABL Non-Retail Spread: 201. 79 bps *Percentages based on deal count Avg. ABL Retail Spread: 164. 43 bps, down from 191. 67 bps in 1 Q 18 Avg. Overall ABL Spread: 194. 31 bps, down from 197. 56 bps in 1 Q 18 SOURCE: THOMSON REUTERS LPC 11
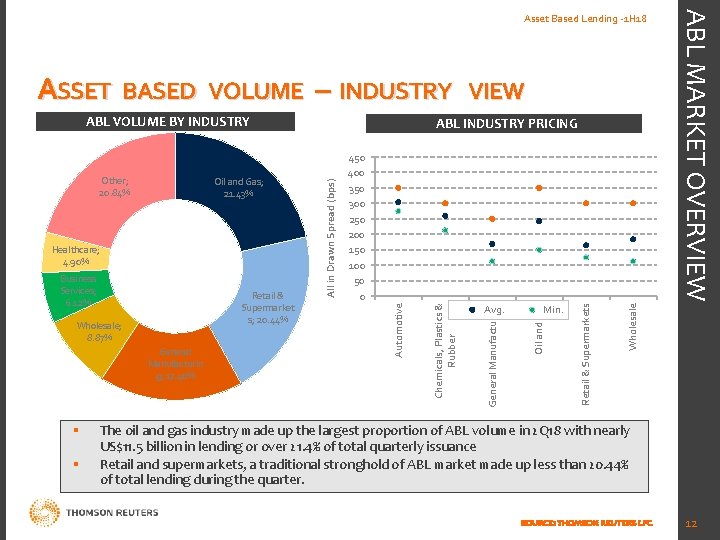
– INDUSTRY ABL VOLUME BY INDUSTRY Wholesale; 8. 87% General Manufacturin g; 17. 40% Avg. Min. Wholesale Retail & Supermarket s; 20. 44% Retail & Supermarkets Business Services; 6. 12% Oil and Gas Healthcare; 4. 90% 450 400 350 300 250 200 150 100 50 0 Automotive Oil and Gas; 21. 43% ABL INDUSTRY PRICING All in Drawn Spread (bps) Other; 20. 84% VIEW General Manufacturing VOLUME Chemicals, Plastics & Rubber ASSET BASED ABL MARKET OVERVIEW Asset Based Lending -1 H 18 The oil and gas industry made up the largest proportion of ABL volume in 2 Q 18 with nearly US$11. 5 billion in lending or over 21. 4% of total quarterly issuance Retail and supermarkets, a traditional stronghold of ABL market made up less than 20. 44% of total lending during the quarter. SOURCE: THOMSON REUTERS LPC 12
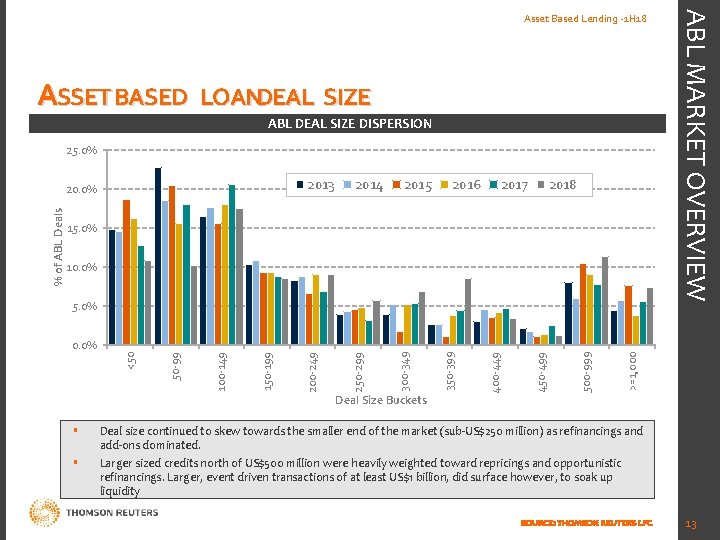
ASSET BASED LOANDEAL SIZE ABL DEAL SIZE DISPERSION 25. 0% 2013 2014 2015 2016 2017 2018 15. 0% 10. 0% 5. 0% >=1, 000 500 -999 450 -499 400 -449 Deal Size Buckets 350 -399 300 -349 250 -299 200 -249 150 -199 100 -149 50 -99 0. 0% <50 % of ABL Deals 20. 0% ABL MARKET OVERVIEW Asset Based Lending -1 H 18 Deal size continued to skew towards the smaller end of the market (sub-US$250 million) as refinancings and add-ons dominated. Larger sized credits north of US$500 million were heavily weighted toward repricings and opportunistic refinancings. Larger, event driven transactions of at least US$1 billion, did surface however, to soak up liquidity SOURCE: THOMSON REUTERS LPC 13
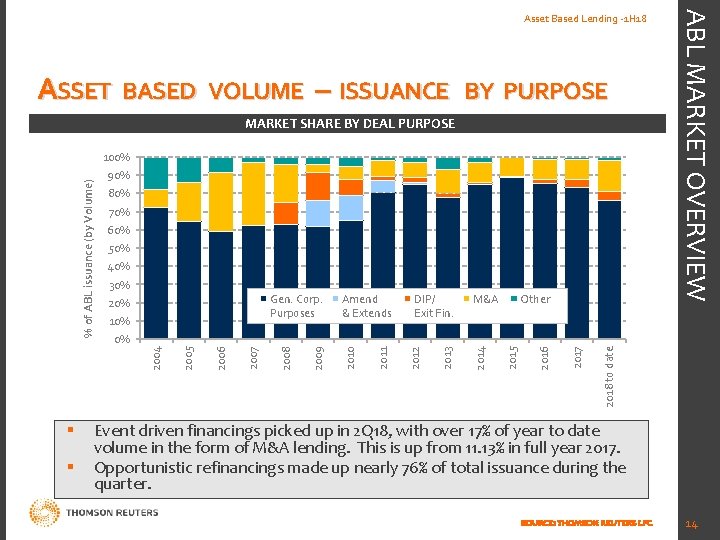
ASSET BASED VOLUME – ISSUANCE BY PURPOSE MARKET SHARE BY DEALSPONSORED PURPOSE VS CORPORATE ISSUANCE 90% 80% 70% 60% 50% 40% 30% Gen. Corp. Purposes 20% 10% Amend & Extends DIP/ Exit Fin. M&A Other 2018 to date 2017 2016 2015 2014 2013 2012 2011 2010 2009 2008 2007 2006 2005 0% 2004 % of ABL issuance (by Volume) 100% ABL MARKET OVERVIEW Asset Based Lending -1 H 18 Event driven financings picked up in 2 Q 18, with over 17% of year to date volume in the form of M&A lending. This is up from 11. 13% in full year 2017. Opportunistic refinancings made up nearly 76% of total issuance during the quarter. SOURCE: THOMSON REUTERS LPC 14
90. 0% 1 Q 07 2 Q 07 3 Q 07 4 Q 07 1 Q 08 2 Q 08 3 Q 08 4 Q 08 1 Q 09 2 Q 09 3 Q 09 4 Q 09 1 Q 10 2 Q 10 3 Q 10 4 Q 10 1 Q 11 2 Q 11 3 Q 11 4 Q 11 1 Q 12 2 Q 12 3 Q 12 4 Q 12 1 Q 13 2 Q 13 3 Q 13 4 Q 13 1 Q 14 2 Q 14 3 Q 14 4 Q 14 1 Q 15 2 Q 15 3 Q 15 4 Q 15 1 Q 16 2 Q 16 3 Q 16 4 Q 16 1 Q 17 2 Q 17 3 Q 17 4 Q 17 1 Q 18 2 Q 18 Percent of total Issuance ASSET BASEDLOANS – ISSUANCE 3 -Year BY TENOR U. S. LEVERAGED LOAN ISSUANCE 100. 0% 4 -Year 5 -Year 80. 0% 70. 0% 60. 0% 50. 0% 40. 0% SOURCE: THOMSON REUTERS LPC ABL MARKET OVERVIEW Asset Based Lending -1 H 18 30. 0% 20. 0% 10. 0% 15
ASSET BASED LOANS – ESTIMATED MATURING VOLUME REFINANCING CLIFF 35. 0 30. 0 25. 0 20. 0 15. 0 10. 0 5. 0 3 Q 23 2 Q 23 1 Q 23 4 Q 22 3 Q 22 2 Q 22 1 Q 22 4 Q 21 3 Q 21 2 Q 21 1 Q 21 4 Q 20 3 Q 20 2 Q 20 1 Q 20 4 Q 19 3 Q 19 2 Q 19 1 Q 19 4 Q 18 0. 0 3 Q 18 ABL Maturing Volume (US$bn) ABL MARKET OVERVIEW Asset Based Lending -1 H 18 SOURCE: THOMSON REUTERS LPC 16
- Slides: 16