
2017 Edelman Trust Barometer 1 2017 Edelman Trust
2017 Edelman Trust Barometer 1
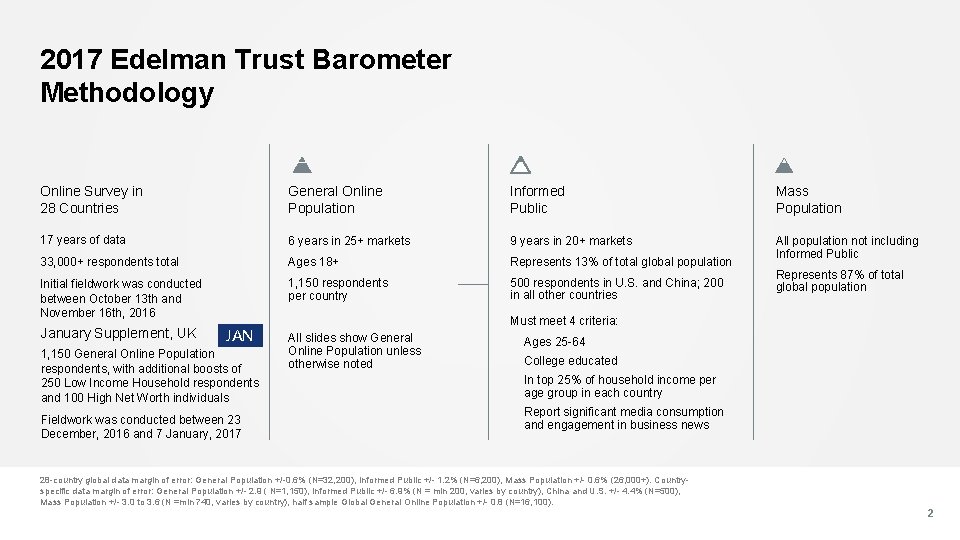
2017 Edelman Trust Barometer Methodology Online Survey in 28 Countries General Online Population Informed Public Mass Population 17 years of data 6 years in 25+ markets 9 years in 20+ markets 33, 000+ respondents total Ages 18+ Represents 13% of total global population All population not including Informed Public Initial fieldwork was conducted between October 13 th and November 16 th, 2016 1, 150 respondents per country 500 respondents in U. S. and China; 200 in all other countries January Supplement, UK JAN 1, 150 General Online Population respondents, with additional boosts of 250 Low Income Household respondents and 100 High Net Worth individuals Fieldwork was conducted between 23 December, 2016 and 7 January, 2017 Represents 87% of total global population Must meet 4 criteria: All slides show General Online Population unless otherwise noted Ages 25 -64 College educated In top 25% of household income per age group in each country Report significant media consumption and engagement in business news 28 -country global data margin of error: General Population +/-0. 6% (N=32, 200), Informed Public +/- 1. 2% (N=6, 200), Mass Population +/- 0. 6% (26, 000+). Countryspecific data margin of error: General Population +/- 2. 9 ( N=1, 150), Informed Public +/- 6. 9% (N = min 200, varies by country), China and U. S. +/- 4. 4% (N=500), Mass Population +/- 3. 0 to 3. 6 (N =min 740, varies by country), half sample Global General Online Population +/- 0. 8 (N=16, 100). 2
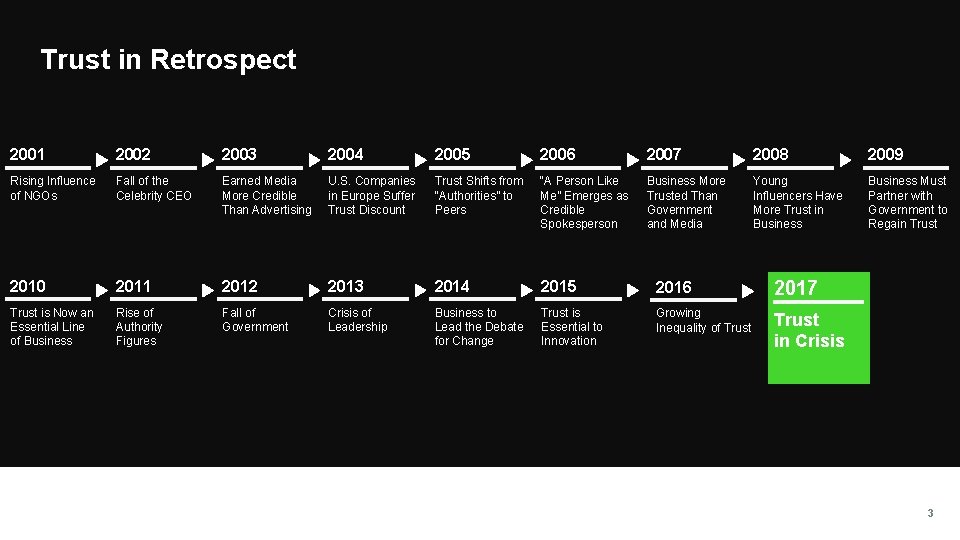
Trust in Retrospect 2001 2002 2003 2004 2005 2006 2007 2008 2009 Rising Influence of NGOs Fall of the Celebrity CEO Earned Media More Credible Than Advertising U. S. Companies in Europe Suffer Trust Discount Trust Shifts from “Authorities” to Peers “A Person Like Me” Emerges as Credible Spokesperson Business More Trusted Than Government and Media Young Influencers Have More Trust in Business Must Partner with Government to Regain Trust 2010 2011 2012 2013 2014 2015 2016 2017 Trust is Now an Essential Line of Business Rise of Authority Figures Fall of Government Crisis of Leadership Business to Lead the Debate for Change Trust is Essential to Innovation Growing Inequality of Trust in Crisis 3
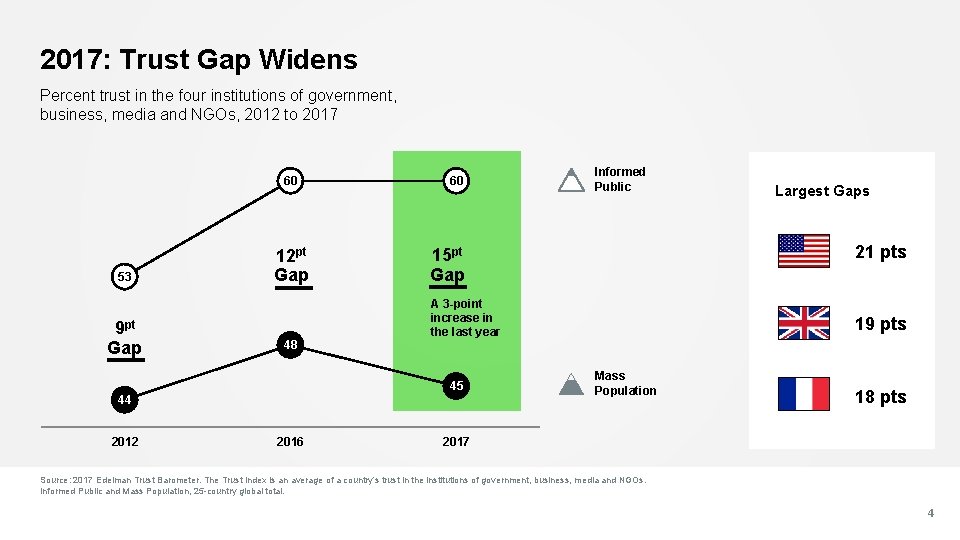
2017: Trust Gap Widens Percent trust in the four institutions of government, business, media and NGOs, 2012 to 2017 60 53 9 pt Gap 12 pt Gap 48 60 A 3 -point increase in the last year 44 2016 Largest Gaps 21 pts 15 pt Gap 45 2012 Informed Public 19 pts Mass Population 18 pts 2017 Source: 2017 Edelman Trust Barometer. The Trust Index is an average of a country’s trust in the institutions of government, business, media and NGOs. Informed Public and Mass Population, 25 -country global total. 4
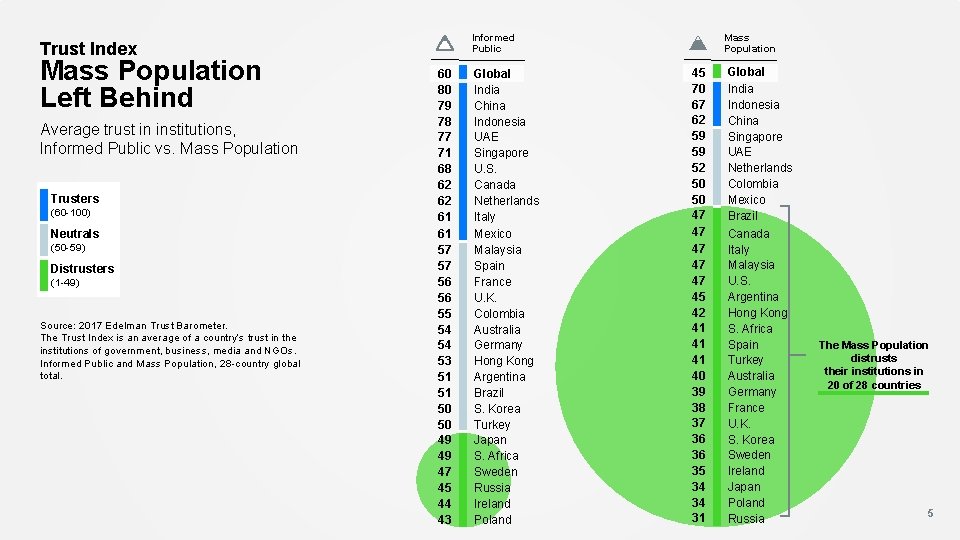
Mass Population Left Behind Average trust in institutions, Informed Public vs. Mass Population Trusters (60 -100) Neutrals (50 -59) Distrusters (1 -49) Source: 2017 Edelman Trust Barometer. The Trust Index is an average of a country’s trust in the institutions of government, business, media and NGOs. Informed Public and Mass Population, 28 -country global total. Mass Population Informed Public Trust Index 60 80 79 78 77 71 68 62 62 61 61 57 57 56 56 55 54 54 53 51 51 50 50 49 49 47 45 44 43 Global India China Indonesia UAE Singapore U. S. Canada Netherlands Italy Mexico Malaysia Spain France U. K. Colombia Australia Germany Hong Kong Argentina Brazil S. Korea Turkey Japan S. Africa Sweden Russia Ireland Poland 45 70 67 62 59 59 52 50 50 47 47 47 45 42 41 41 41 40 39 38 37 36 36 35 34 34 31 Global India Indonesia China Singapore UAE Netherlands Colombia Mexico Brazil Canada Italy Malaysia U. S. Argentina Hong Kong S. Africa Spain Turkey Australia Germany France U. K. S. Korea Sweden Ireland Japan Poland Russia The Mass Population distrusts their institutions in 20 of 28 countries 5
Trust in Crisis
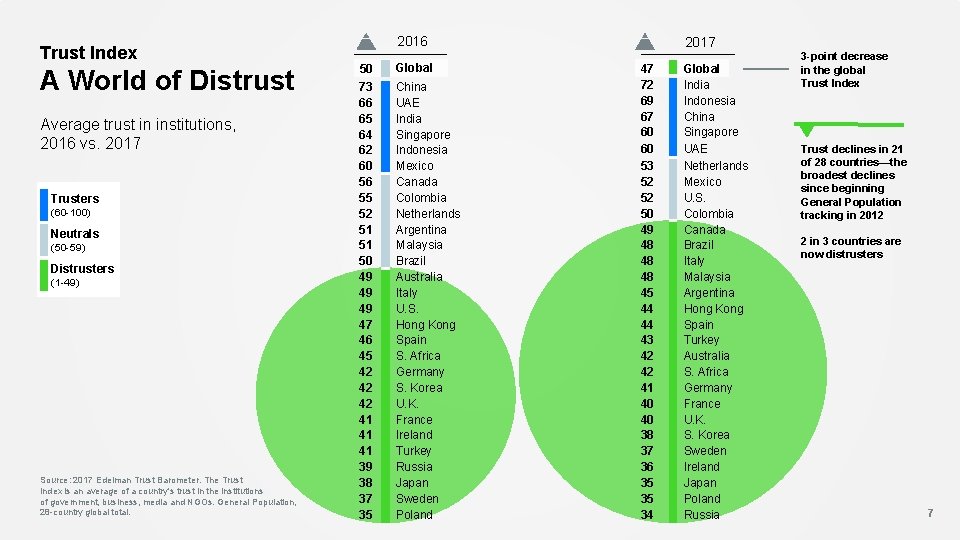
Trust Index A World of Distrust Average trust in institutions, 2016 vs. 2017 Trusters (60 -100) Neutrals (50 -59) Distrusters (1 -49) Source: 2017 Edelman Trust Barometer. The Trust Index is an average of a country's trust in the institutions of government, business, media and NGOs. General Population, 28 -country global total. 2016 50 Global 73 66 65 64 62 60 56 55 52 51 51 50 49 49 49 47 46 45 42 42 42 41 41 41 39 38 37 35 China UAE India Singapore Indonesia Mexico Canada Colombia Netherlands Argentina Malaysia Brazil Australia Italy U. S. Hong Kong Spain S. Africa Germany S. Korea U. K. France Ireland Turkey Russia Japan Sweden Poland 2017 47 72 69 67 60 60 53 52 52 50 49 48 48 48 45 44 44 43 42 42 41 40 40 38 37 36 35 35 34 Global India Indonesia China Singapore UAE Netherlands Mexico U. S. Colombia Canada Brazil Italy Malaysia Argentina Hong Kong Spain Turkey Australia S. Africa Germany France U. K. S. Korea Sweden Ireland Japan Poland Russia 3 -point decrease in the global Trust Index Trust declines in 21 of 28 countries—the broadest declines since beginning General Population tracking in 2012 2 in 3 countries are now distrusters 7
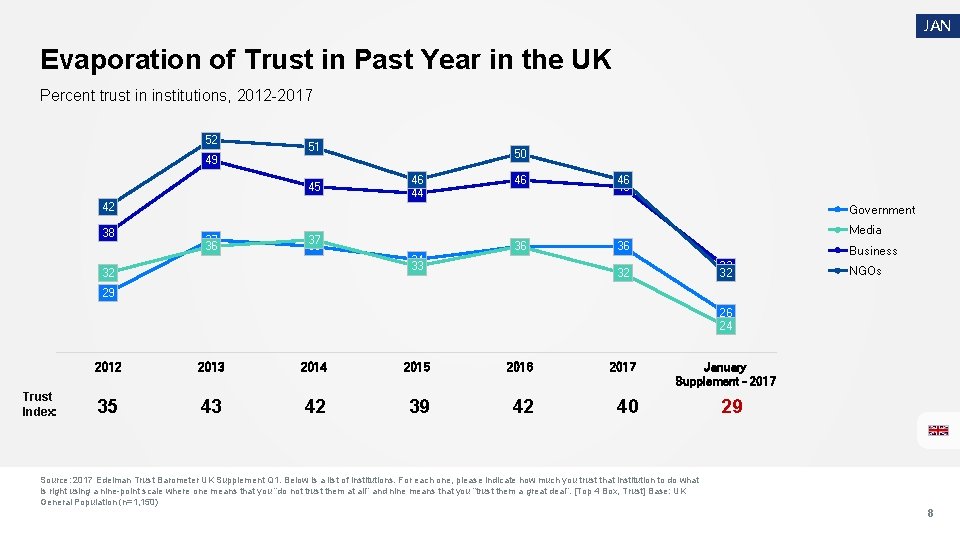
JAN Evaporation of Trust in Past Year in the UK Percent trust in institutions, 2012 -2017 52 51 50 49 45 46 44 46 46 45 42 38 Government 37 36 Media 37 36 36 34 33 32 36 Business 33 32 32 NGOs 29 26 24 Trust Index: 2012 2013 2014 2015 2016 2017 35 43 42 39 42 40 January Supplement - 2017 29 Source: 2017 Edelman Trust Barometer UK Supplement Q 1. Below is a list of institutions. For each one, please indicate how much you trust that institution to do what is right using a nine-point scale where one means that you “do not trust them at all” and nine means that you “trust them a great deal”. [Top 4 Box, Trust] Base: UK General Population (n=1, 150) 8
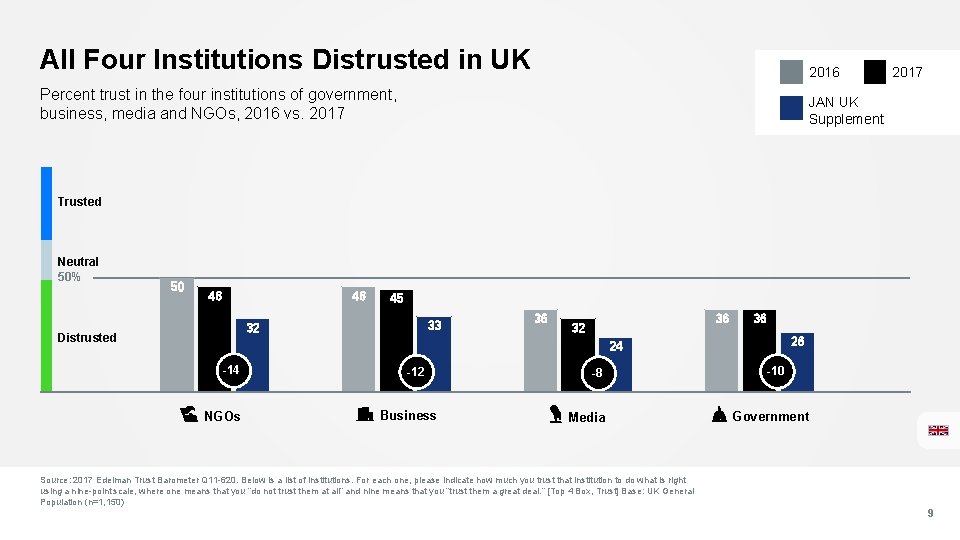
All Four Institutions Distrusted in UK 2016 Percent trust in the four institutions of government, business, media and NGOs, 2016 vs. 2017 JAN UK Supplement 2017 Trusted Neutral 50% 50 46 46 45 33 32 Distrusted 36 36 32 36 26 24 -14 NGOs -12 Business -8 Media -10 Government Source: 2017 Edelman Trust Barometer Q 11 -620. Below is a list of institutions. For each one, please indicate how much you trust that institution to do what is right using a nine-point scale, where one means that you “do not trust them at all” and nine means that you “trust them a great deal. ” [Top 4 Box, Trust] Base: UK General Population (n=1, 150) 9
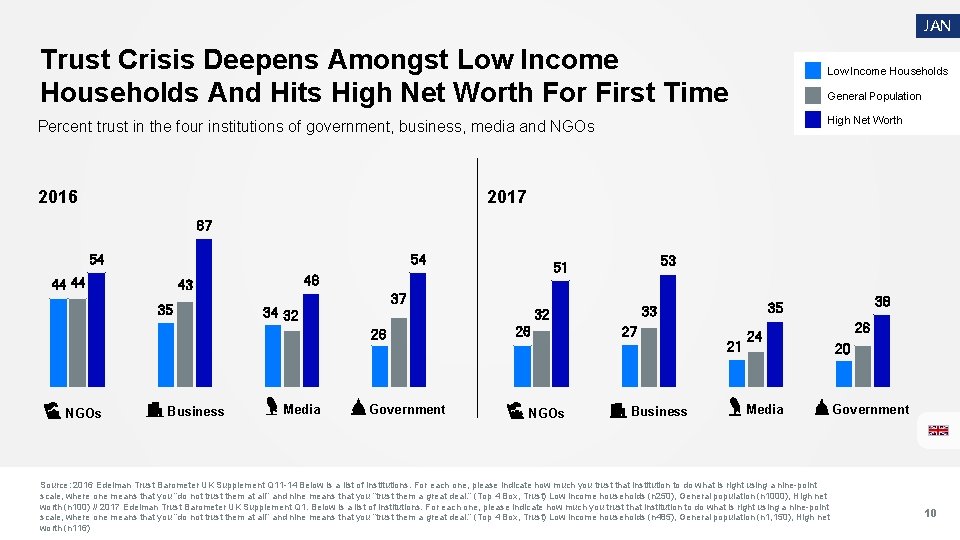
JAN Trust Crisis Deepens Amongst Low Income Households And Hits High Net Worth For First Time Low Income Households General Population High Net Worth Percent trust in the four institutions of government, business, media and NGOs 2016 2017 67 54 54 44 44 46 43 35 37 34 32 26 NGOs Business Media Government 53 51 26 NGOs 27 Business 38 35 33 32 21 24 Media Source: 2016 Edelman Trust Barometer UK Supplement Q 11 -14 Below is a list of institutions. For each one, please indicate how much you trust that institution to do what is right using a nine-point scale, where one means that you “do not trust them at all” and nine means that you “trust them a great deal. ” (Top 4 Box, Trust) Low income households (n 250), General population (n 1000), High net worth (n 100) // 2017 Edelman Trust Barometer UK Supplement Q 1. Below is a list of institutions. For each one, please indicate how much you trust that institution to do what is right using a nine-point scale, where one means that you “do not trust them at all” and nine means that you “trust them a great deal. ” (Top 4 Box, Trust) Low income households (n 485), General population (n 1, 150), High net worth (n 116) 26 20 Government 10
Post Brexit
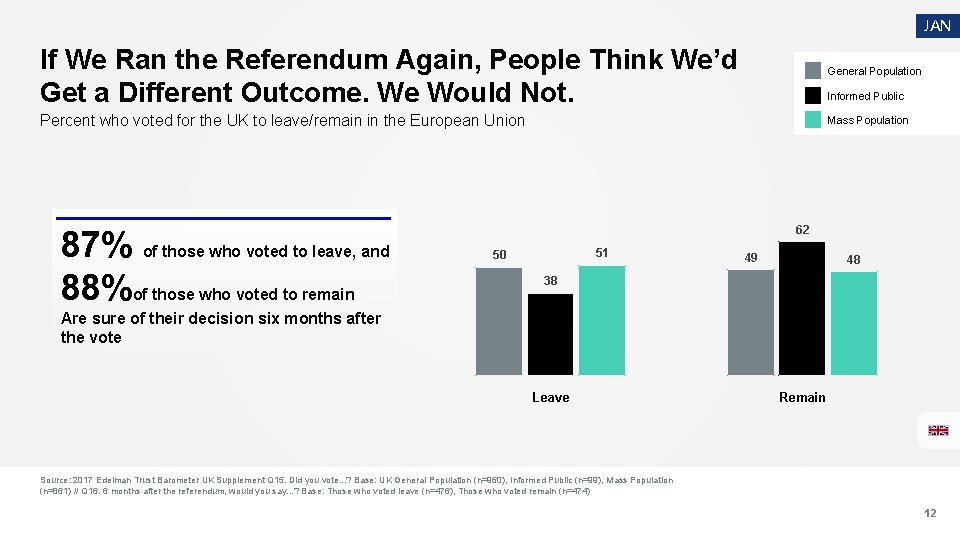
JAN If We Ran the Referendum Again, People Think We’d Get a Different Outcome. We Would Not. General Population Percent who voted for the UK to leave/remain in the European Union Mass Population 87% of those who voted to leave, and 88%of those who voted to remain Informed Public 62 51 50 49 48 38 Are sure of their decision six months after the vote Leave Remain Source: 2017 Edelman Trust Barometer UK Supplement Q 15. Did you vote. . . ? Base: UK General Population (n=960), Informed Public (n=99), Mass Population (n=861) // Q 16. 6 months after the referendum, would you say. . . ? Base: Those who voted leave (n=476), Those who voted remain (n=474) 12
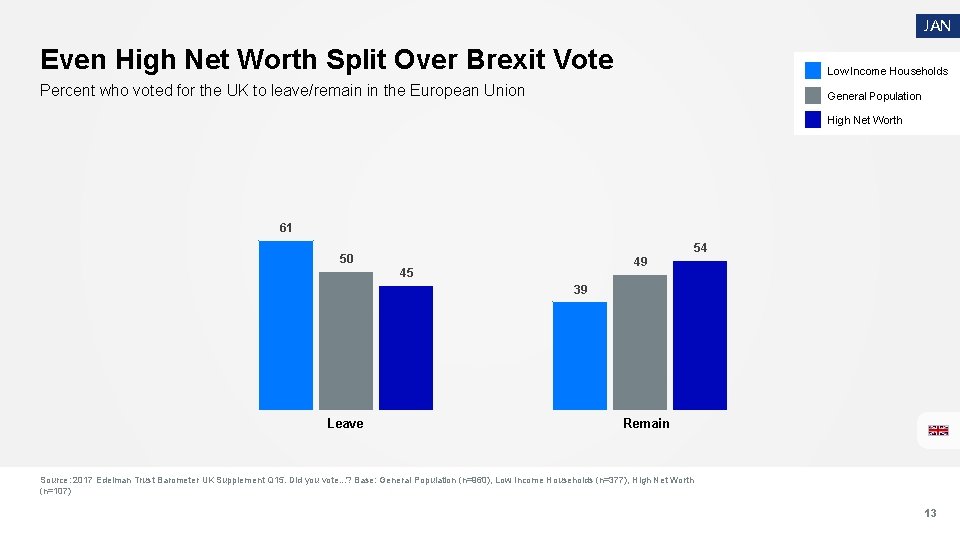
JAN Even High Net Worth Split Over Brexit Vote Low Income Households Percent who voted for the UK to leave/remain in the European Union General Population High Net Worth 61 54 50 49 45 39 Leave Remain Source: 2017 Edelman Trust Barometer UK Supplement Q 15. Did you vote. . . ? Base: General Population (n=960), Low Income Households (n=377), High Net Worth (n=107) 13
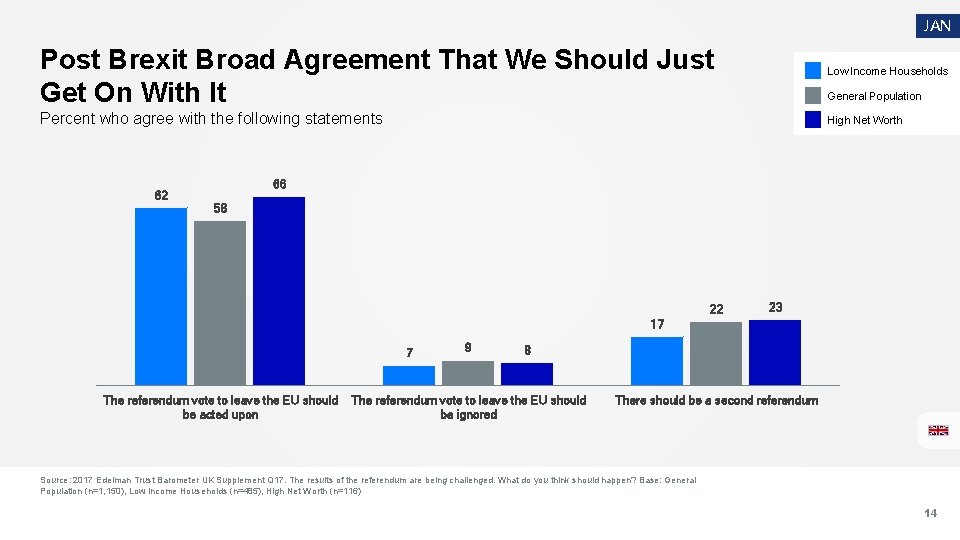
JAN Post Brexit Broad Agreement That We Should Just Get On With It Low Income Households Percent who agree with the following statements High Net Worth 62 General Population 66 58 22 23 17 7 The referendum vote to leave the EU should be acted upon 9 8 The referendum vote to leave the EU should be ignored There should be a second referendum Source: 2017 Edelman Trust Barometer UK Supplement Q 17. The results of the referendum are being challenged. What do you think should happen? Base: General Population (n=1, 150), Low Income Households (n=485), High Net Worth (n=116) 14
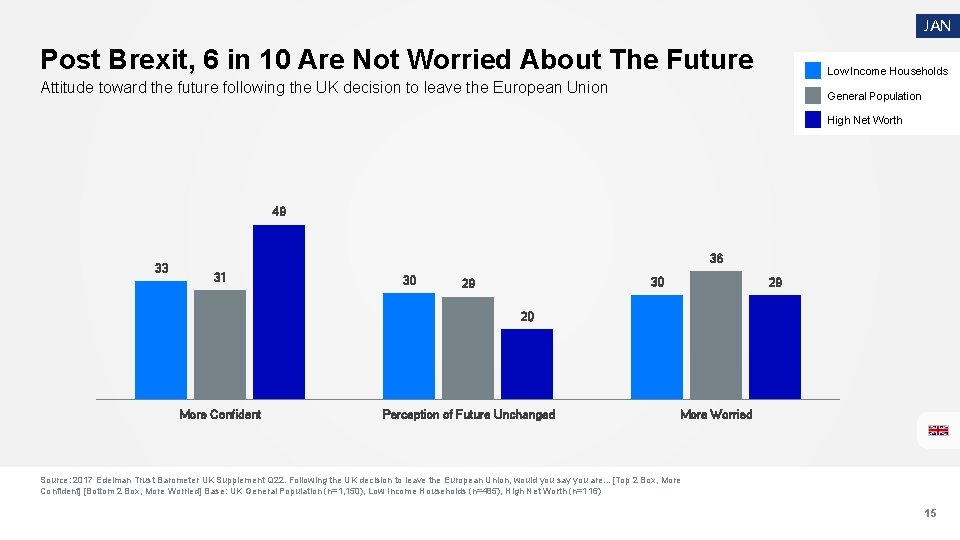
JAN Post Brexit, 6 in 10 Are Not Worried About The Future Low Income Households Attitude toward the future following the UK decision to leave the European Union General Population High Net Worth 49 33 36 31 30 30 29 29 20 More Confident Perception of Future Unchanged More Worried Source: 2017 Edelman Trust Barometer UK Supplement Q 22. Following the UK decision to leave the European Union, would you say you are…[Top 2 Box, More Confident] [Bottom 2 Box, More Worried] Base: UK General Population (n=1, 150), Low Income Households (n=485), High Net Worth (n=116) 15
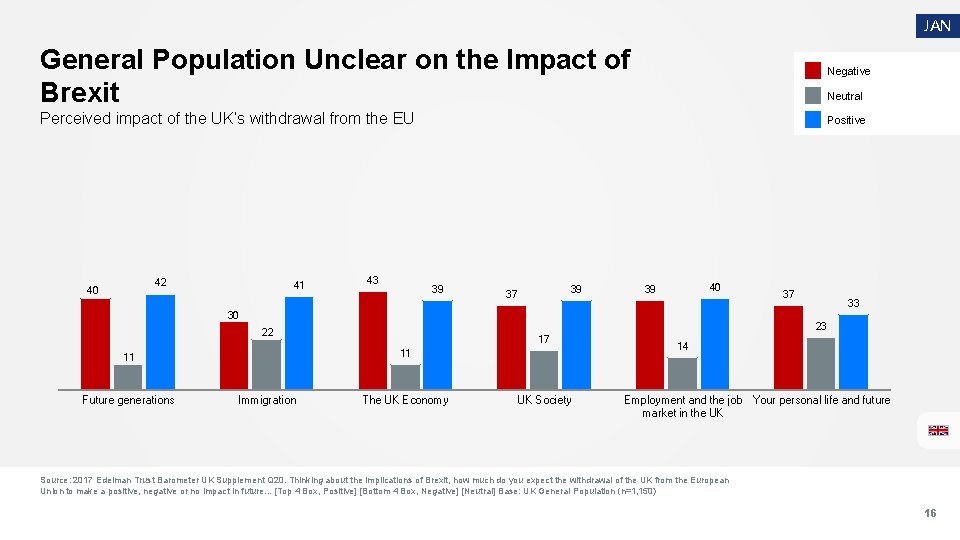
JAN General Population Unclear on the Impact of Brexit Negative Perceived impact of the UK’s withdrawal from the EU Positive 42 40 41 43 39 39 37 Neutral 40 39 30 Future generations 17 11 Immigration 33 23 22 11 37 The UK Economy UK Society 14 Employment and the job Your personal life and future market in the UK Source: 2017 Edelman Trust Barometer UK Supplement Q 20. Thinking about the implications of Brexit, how much do you expect the withdrawal of the UK from the European Union to make a positive, negative or no impact in future. . . [Top 4 Box, Positive] [Bottom 4 Box, Negative] [Neutral] Base: UK General Population (n=1, 150) 16
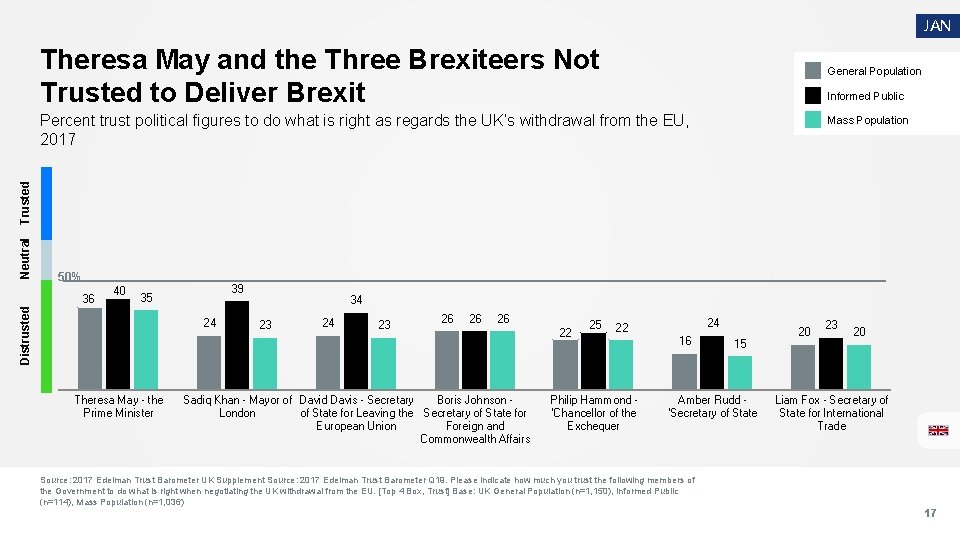
JAN Theresa May and the Three Brexiteers Not Trusted to Deliver Brexit General Population Informed Public Percent trust political figures to do what is right as regards the UK’s withdrawal from the EU, 2017 Neutral Trusted Mass Population 50% 40 39 35 Distrusted 36 24 Theresa May - the Prime Minister 34 23 26 26 26 Sadiq Khan - Mayor of David Davis - Secretary Boris Johnson London of State for Leaving the Secretary of State for European Union Foreign and Commonwealth Affairs 22 25 24 22 Philip Hammond 'Chancellor of the Exchequer 16 15 Amber Rudd 'Secretary of State 20 23 20 Liam Fox - Secretary of State for International Trade Source: 2017 Edelman Trust Barometer UK Supplement Source: 2017 Edelman Trust Barometer Q 19. Please indicate how much you trust the following members of the Government to do what is right when negotiating the UK withdrawal from the EU. [Top 4 Box, Trust] Base: UK General Population (n=1, 150), Informed Public (n=114), Mass Population (n=1, 036) 17
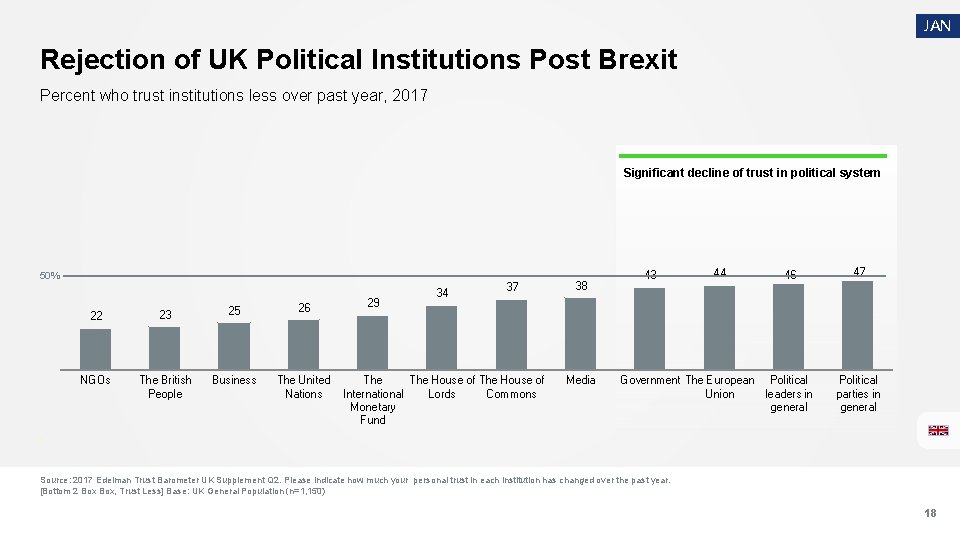
JAN Rejection of UK Political Institutions Post Brexit Percent who trust institutions less over past year, 2017 Significant decline of trust in political system 50% 22 23 25 26 NGOs The British People Business The United Nations 29 34 37 The House of International Lords Commons Monetary Fund 38 Media 43 44 46 Government The European Political Union leaders in general 47 Political parties in general Source: 2017 Edelman Trust Barometer UK Supplement Q 2. Please indicate how much your personal trust in each institution has changed over the past year. [Bottom 2 Box, Trust Less] Base: UK General Population (n=1, 150) 18
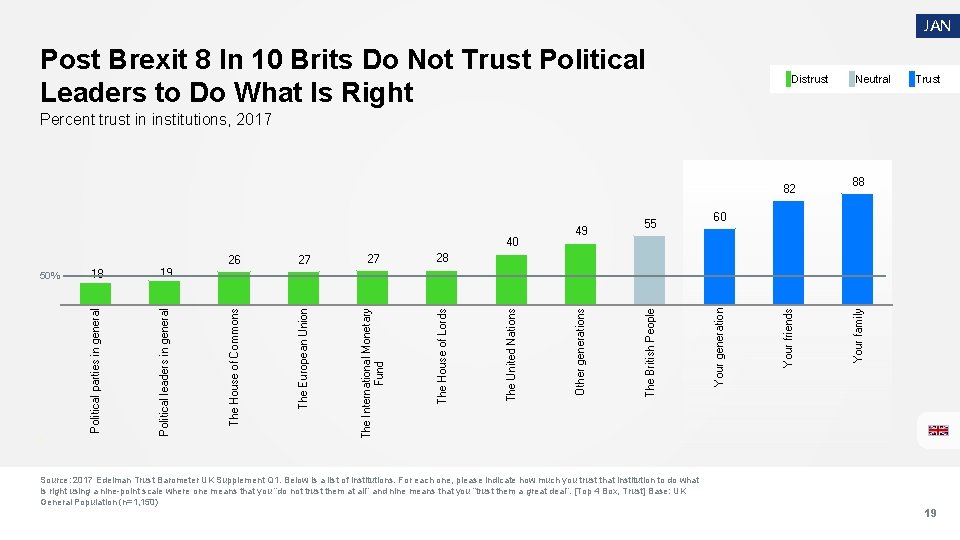
JAN Post Brexit 8 In 10 Brits Do Not Trust Political Leaders to Do What Is Right Distrust Neutral Trust Percent trust in institutions, 2017 82 Your family Your friends The House of Lords 60 Your generation The International Monetary Fund 55 The British People 28 Other generations 27 The United Nations 27 The European Union 19 26 The House of Commons 18 Political leaders in general 50% Political parties in general 40 49 88 Source: 2017 Edelman Trust Barometer UK Supplement Q 1. Below is a list of institutions. For each one, please indicate how much you trust that institution to do what is right using a nine-point scale where one means that you “do not trust them at all” and nine means that you “trust them a great deal”. [Top 4 Box, Trust] Base: UK General Population (n=1, 150) 19
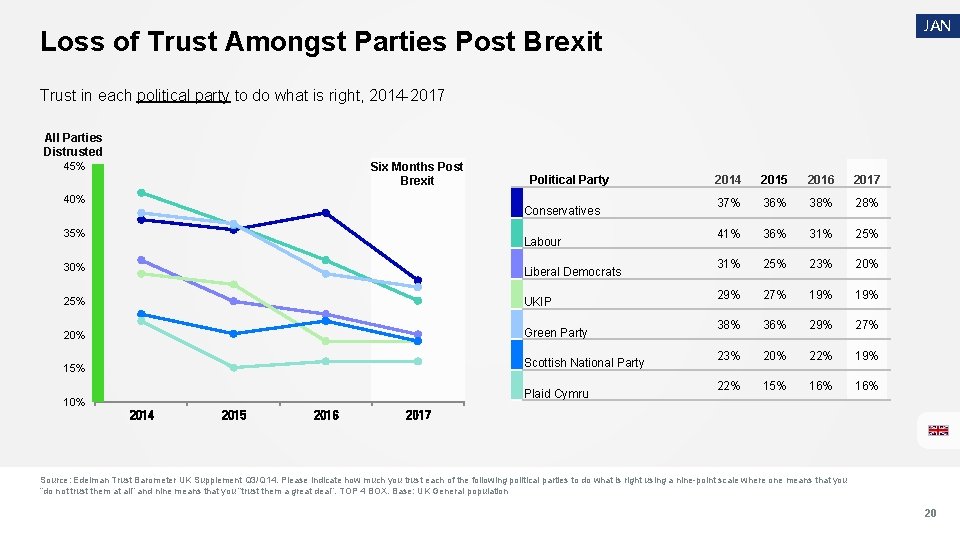
JAN Loss of Trust Amongst Parties Post Brexit Trust in each political party to do what is right, 2014 -2017 All Parties Distrusted 45% Six Months Post Brexit 40% Political Party Conservatives 35% Labour 30% Liberal Democrats 25% UKIP 20% Green Party 15% Scottish National Party Plaid Cymru 10% 2014 2015 2016 2017 37% 36% 38% 28% 41% 36% 31% 25% 23% 20% 29% 27% 19% 38% 36% 29% 27% 23% 20% 22% 19% 22% 15% 16% 2017 Source: Edelman Trust Barometer UK Supplement Q 3/Q 14. Please indicate how much you trust each of the following political parties to do what is right using a nine-point scale where one means that you “do not trust them at all” and nine means that you “trust them a great deal”. TOP 4 BOX. Base: UK General population 20
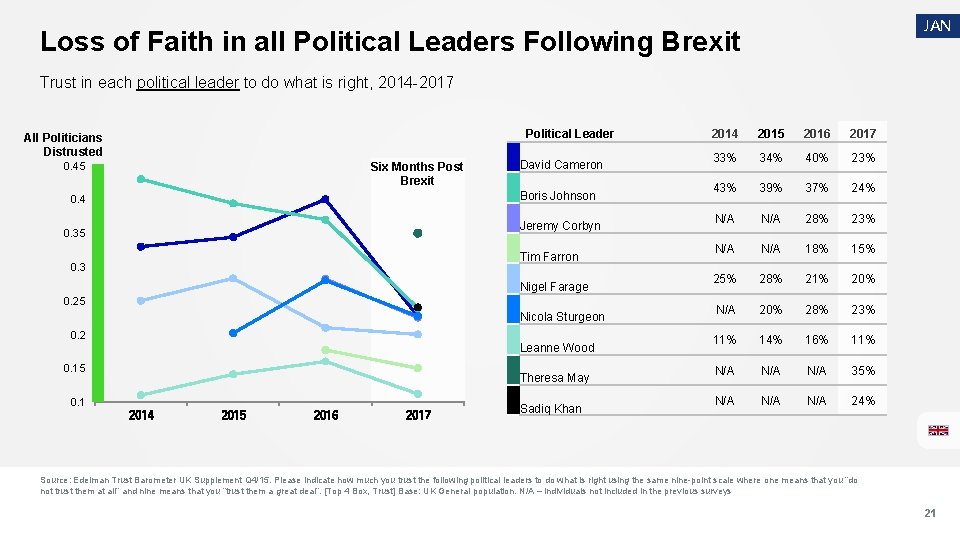
JAN Loss of Faith in all Political Leaders Following Brexit Trust in each political leader to do what is right, 2014 -2017 Political Leader All Politicians Distrusted 0. 45 Six Months Post Brexit David Cameron Boris Johnson 0. 4 Jeremy Corbyn 0. 35 Tim Farron 0. 3 Nigel Farage 0. 25 Nicola Sturgeon 0. 2 Leanne Wood 0. 15 Theresa May 0. 1 2014 2015 2016 2017 Sadiq Khan 2014 2015 2016 2017 33% 34% 40% 23% 43% 39% 37% 24% N/A 28% 23% N/A 18% 15% 28% 21% 20% N/A 20% 28% 23% 11% 14% 16% 11% N/A N/A 35% N/A N/A 24% Source: Edelman Trust Barometer UK Supplement Q 4/15. Please indicate how much you trust the following political leaders to do what is right using the same nine-point scale where one means that you “do not trust them at all” and nine means that you “trust them a great deal”. [Top 4 Box, Trust] Base: UK General population. N/A – individuals not included in the previous surveys 21
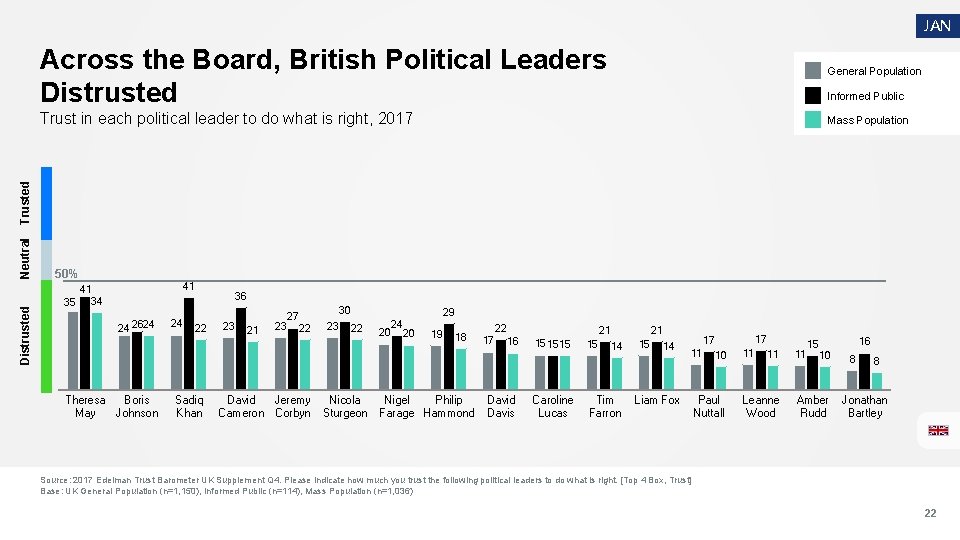
JAN Across the Board, British Political Leaders Distrusted General Population Trust in each political leader to do what is right, 2017 Mass Population Neutral Trusted Informed Public 50% 41 Distrusted 41 35 36 34 24 2624 Theresa Boris May Johnson 24 22 Sadiq Khan 23 21 David Cameron 23 30 27 22 Jeremy Corbyn 23 29 22 Nicola Sturgeon 20 24 20 19 18 Nigel Philip Farage Hammond 22 17 21 16 David Davis 15 15 15 Caroline Lucas 15 21 14 Tim Farron 15 14 17 17 11 Liam Fox 10 Paul Nuttall 11 11 Leanne Wood 11 16 15 10 Amber Rudd 8 8 Jonathan Bartley Source: 2017 Edelman Trust Barometer UK Supplement Q 4. Please indicate how much you trust the following political leaders to do what is right. [Top 4 Box, Trust] Base: UK General Population (n=1, 150), Informed Public (n=114), Mass Population (n=1, 036) 22
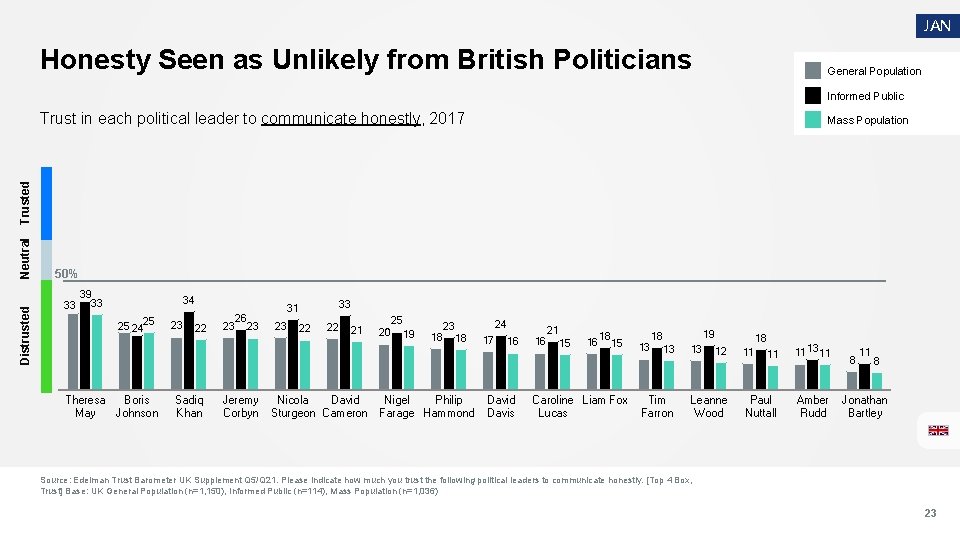
JAN Honesty Seen as Unlikely from British Politicians General Population Informed Public Trust in each political leader to communicate honestly, 2017 Distrusted Neutral Trusted Mass Population 50% 33 39 34 33 25 24 25 Theresa Boris May Johnson 23 22 Sadiq Khan 23 26 33 31 23 Jeremy Corbyn 23 22 22 21 Nicola David Sturgeon Cameron 25 20 19 18 24 23 18 Nigel Philip Farage Hammond 17 21 16 David Davis 16 15 16 18 15 Caroline Liam Fox Lucas 19 18 13 13 Tim Farron 13 18 12 Leanne Wood 11 11 13 11 Paul Nuttall Amber Rudd 11 8 Jonathan Bartley Source: Edelman Trust Barometer UK Supplement Q 5/Q 21. Please indicate how much you trust the following political leaders to communicate honestly. [Top 4 Box, Trust] Base: UK General Population (n=1, 150), Informed Public (n=114), Mass Population (n=1, 036) 23
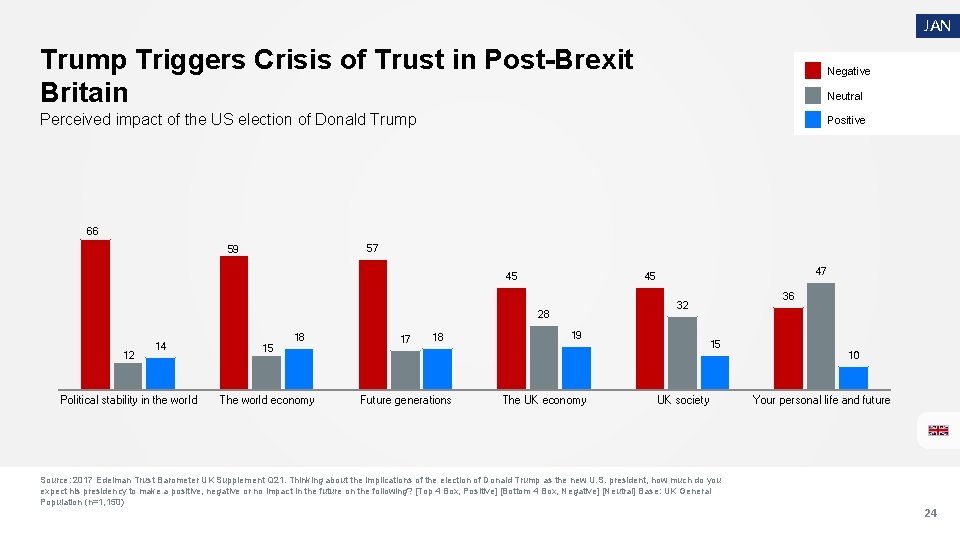
JAN Trump Triggers Crisis of Trust in Post-Brexit Britain Negative Perceived impact of the US election of Donald Trump Positive Neutral 66 57 59 45 12 Political stability in the world 15 18 The world economy 17 18 36 32 28 14 47 45 19 15 10 Future generations The UK economy UK society Your personal life and future Source: 2017 Edelman Trust Barometer UK Supplement Q 21. Thinking about the implications of the election of Donald Trump as the new U. S. president, how much do you expect his presidency to make a positive, negative or no impact in the future on the following? [Top 4 Box, Positive] [Bottom 4 Box, Negative] [Neutral] Base: UK General Population (n=1, 150) 24
The System Is Broken
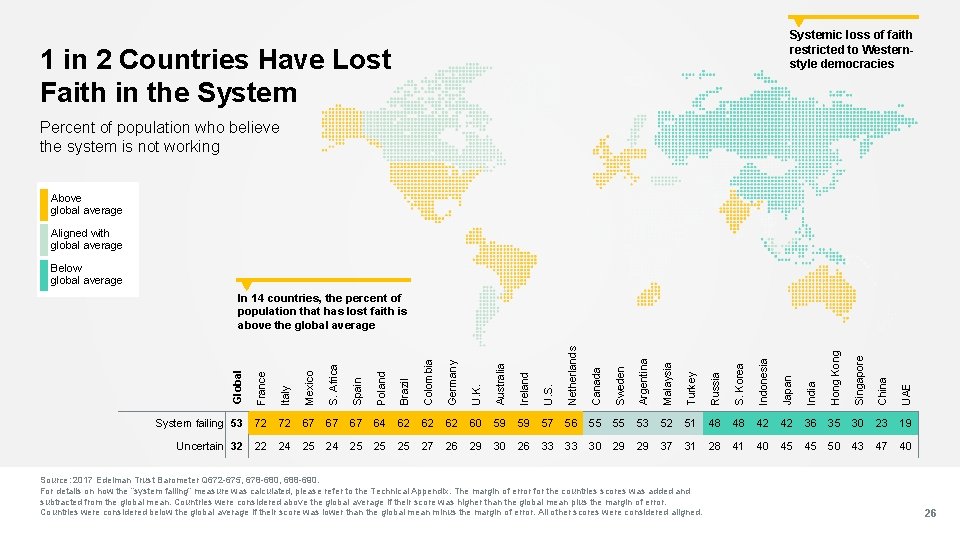
Systemic loss of faith restricted to Westernstyle democracies 1 in 2 Countries Have Lost Faith in the System Percent of population who believe the system is not working Above global average Aligned with global average Below global average Global France Italy Mexico S. Africa Spain Poland Brazil Colombia Germany U. K. Australia Ireland U. S. Netherlands Canada Sweden Argentina Malaysia Turkey Russia S. Korea Indonesia Japan India Hong Kong Singapore China UAE In 14 countries, the percent of population that has lost faith is above the global average System failing 53 72 72 67 67 67 64 62 62 62 60 59 59 57 56 55 55 53 52 51 48 48 42 42 36 35 30 23 19 Uncertain 32 22 24 25 25 25 27 26 29 30 26 33 33 30 29 29 37 31 28 41 40 45 45 50 43 47 40 Source: 2017 Edelman Trust Barometer Q 672 -675, 678 -680, 688 -690. For details on how the “system failing” measure was calculated, please refer to the Technical Appendix. The margin of error for the countries scores was added and subtracted from the global mean. Countries were considered above the global average if their score was higher than the global mean plus the margin of error. Countries were considered below the global average if their score was lower than the global mean minus the margin of error. All other scores were considered aligned. 26
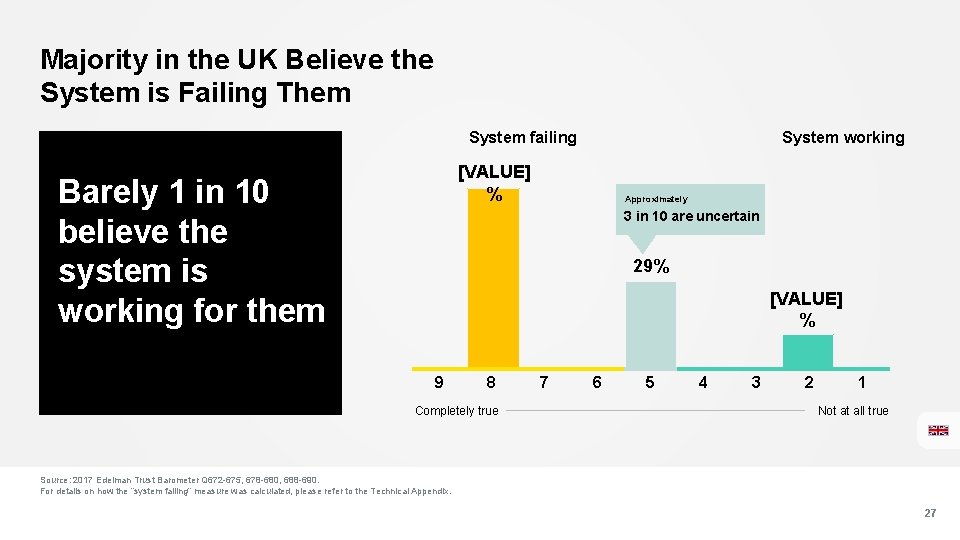
Majority in the UK Believe the System is Failing Them System failing System working [VALUE] % Barely 1 in 10 believe the system is working for them Approximately 3 in 10 are uncertain 29% [VALUE] % 9 8 Completely true 7 6 5 4 3 2 1 Not at all true Source: 2017 Edelman Trust Barometer Q 672 -675, 678 -680, 688 -690. For details on how the “system failing” measure was calculated, please refer to the Technical Appendix. 27
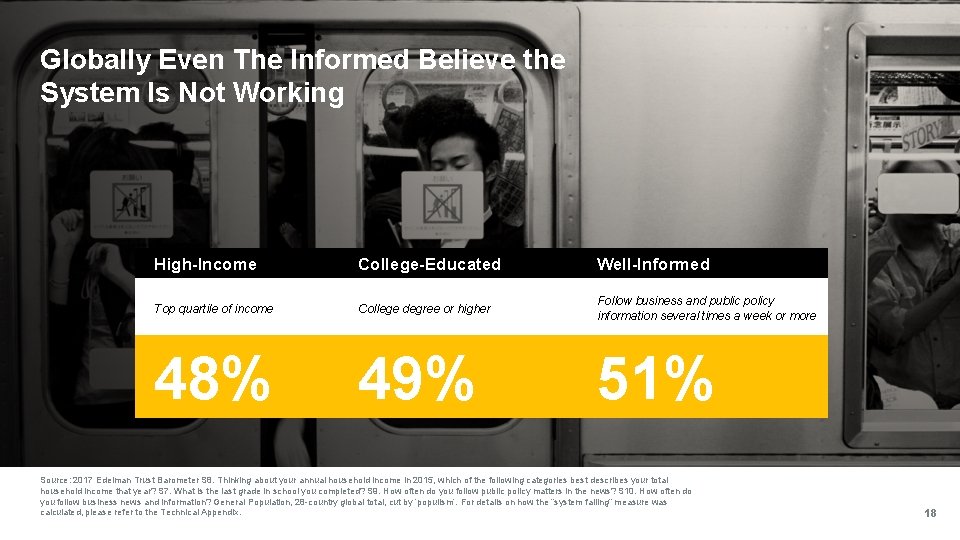
Globally Even The Informed Believe the System Is Not Working High-Income College-Educated Well-Informed Top quartile of income College degree or higher Follow business and public policy information several times a week or more 48% 49% 51% Source: 2017 Edelman Trust Barometer S 8. Thinking about your annual household income in 2015, which of the following categories best describes your total household income that year? S 7. What is the last grade in school you completed? S 9. How often do you follow public policy matters in the news? S 10. How often do you follow business news and information? General Population, 28 -country global total, cut by ‘populism’. For details on how the “system failing” measure was calculated, please refer to the Technical Appendix. 18
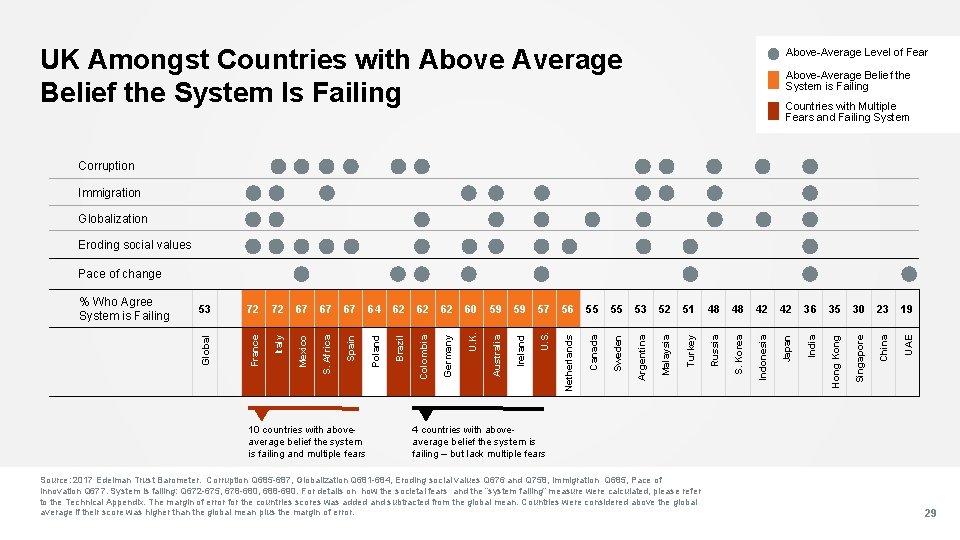
UK Amongst Countries with Above Average Belief the System Is Failing Above-Average Level of Fear Above-Average Belief the System is Failing Countries with Multiple Fears and Failing System Corruption Immigration Globalization Eroding social values 57 56 55 55 53 52 51 48 48 42 42 36 35 30 23 19 Turkey Russia S. Korea Indonesia Japan India Hong Kong Singapore China UAE Brazil 59 Malaysia Poland 59 Argentina Spain 60 Sweden S. Africa 62 Canada Mexico 10 countries with aboveaverage belief the system is failing and multiple fears 62 Netherlands 62 U. S. 64 Ireland 67 Australia 67 U. K. 67 Germany 72 Colombia 72 Italy 53 Global % Who Agree System is Failing France Pace of change 4 countries with aboveaverage belief the system is failing – but lack multiple fears Source: 2017 Edelman Trust Barometer. Corruption Q 685 -687, Globalization Q 681 -684, Eroding social values Q 676 and Q 758, Immigration Q 685, Pace of innovation Q 677. System is failing: Q 672 -675, 678 -680, 688 -690. For details on how the societal fears and the “system failing” measure were calculated, please refer to the Technical Appendix. The margin of error for the countries scores was added and subtracted from the global mean. Countries were considered above the global average if their score was higher than the global mean plus the margin of error. 29
The Echo Chamber
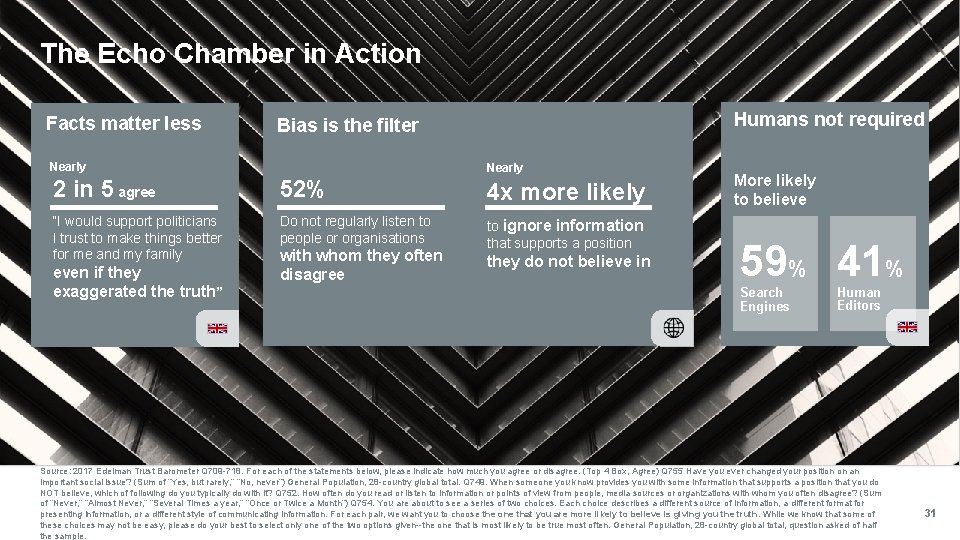
The Echo Chamber in Action Facts matter less Humans not required Bias is the filter Nearly 2 in 5 agree 52% 4 x more likely “I would support politicians I trust to make things better for me and my family Do not regularly listen to people or organisations to ignore information that supports a position even if they exaggerated the truth” with whom they often disagree they do not believe in More likely to believe 59% 41% Search Engines Human Editors Source: 2017 Edelman Trust Barometer Q 709 -718. For each of the statements below, please indicate how much you agree or disagree. (Top 4 Box, Agree) Q 755 Have you ever changed your position on an important social issue? (Sum of “Yes, but rarely, ” “No, never”) General Population, 28 -country global total. Q 749. When someone you know provides you with some information that supports a position that you do NOT believe, which of following do you typically do with it? Q 752. How often do you read or listen to information or points of view from people, media sources or organizations with whom you often disagree? (Sum of “Never, ” “Almost Never, ” “Several Times a year, ” “Once or Twice a Month”) Q 754. You are about to see a series of two choices. Each choice describes a different source of information, a different format for presenting information, or a different style of communicating information. For each pair, we want you to choose the one that you are more likely to believe is giving you the truth. While we know that some of these choices may not be easy, please do your best to select only one of the two options given--the one that is most likely to be true most often. General Population, 28 -country global total, question asked of half the sample. 31
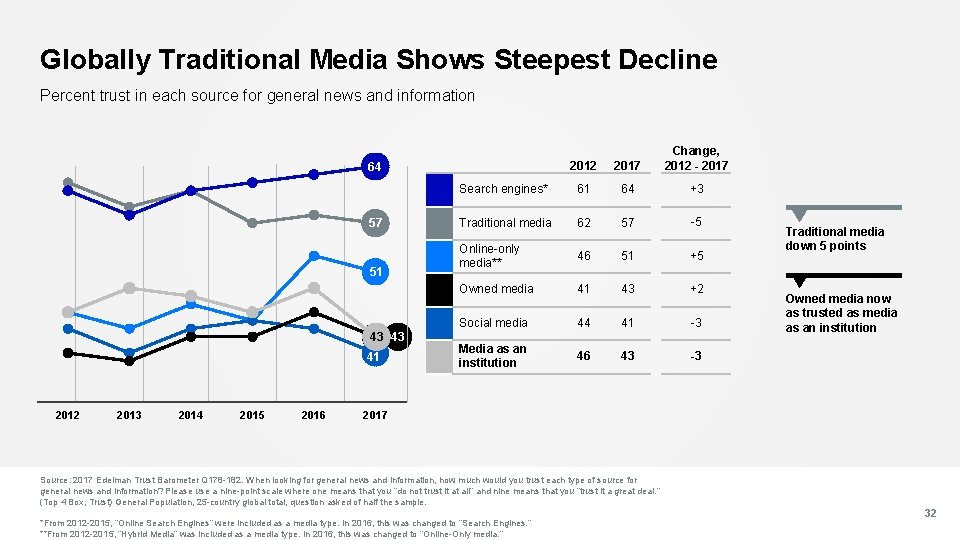
Globally Traditional Media Shows Steepest Decline Percent trust in each source for general news and information 2012 2017 Change, 2012 - 2017 Search engines* 61 64 +3 Traditional media 62 57 -5 Online-only media** 46 51 +5 Owned media 41 43 +2 Social media 44 41 -3 Media as an institution 46 43 -3 64 57 51 43 43 41 2012 2013 2014 2015 2016 Traditional media down 5 points Owned media now as trusted as media as an institution 2017 Source: 2017 Edelman Trust Barometer Q 178 -182. When looking for general news and information, how much would you trust each type of source for general news and information? Please use a nine-point scale where one means that you “do not trust it at all” and nine means that you “trust it a great deal. ” (Top 4 Box, Trust) General Population, 25 -country global total, question asked of half the sample. *From 2012 -2015, “Online Search Engines” were included as a media type. In 2016, this was changed to “Search Engines. ” **From 2012 -2015, “Hybrid Media” was included as a media type. In 2016, this was changed to “Online-Only media. ” 32
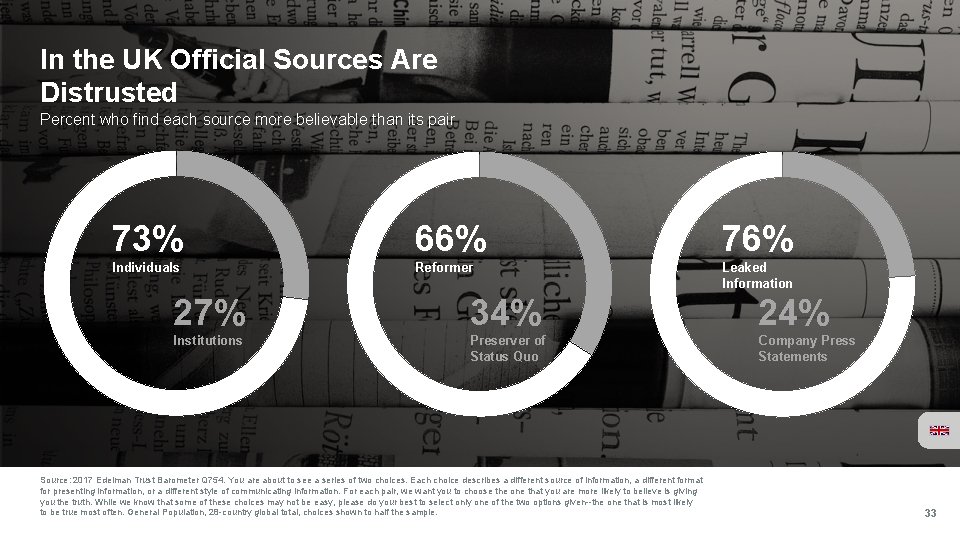
In the UK Official Sources Are Distrusted Percent who find each source more believable than its pair 73% 66% 76% Individuals Reformer Leaked Information 27% 34% 24% Institutions Preserver of Status Quo Company Press Statements Source: 2017 Edelman Trust Barometer Q 754. You are about to see a series of two choices. Each choice describes a different source of information, a different format for presenting information, or a different style of communicating information. For each pair, we want you to choose the one that you are more likely to believe is giving you the truth. While we know that some of these choices may not be easy, please do your best to select only one of the two options given--the one that is most likely to be true most often. General Population, 28 -country global total, choices shown to half the sample. 33
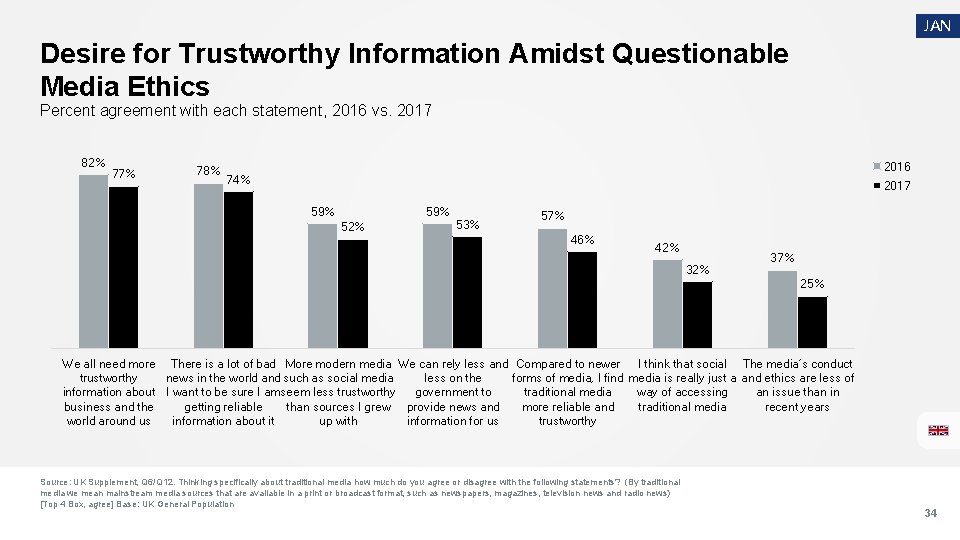
JAN Desire for Trustworthy Information Amidst Questionable Media Ethics Percent agreement with each statement, 2016 vs. 2017 82% 77% 78% 2016 74% 2017 59% 52% 53% 57% 46% 42% 37% 25% We all need more There is a lot of bad More modern media We can rely less and Compared to newer I think that social The media’s conduct trustworthy news in the world and such as social media less on the forms of media, I find media is really just a and ethics are less of information about I want to be sure I amseem less trustworthy government to traditional media way of accessing an issue than in business and the getting reliable than sources I grew provide news and more reliable and traditional media recent years world around us information about it up with information for us trustworthy Source: UK Supplement, Q 6/Q 12. Thinking specifically about traditional media how much do you agree or disagree with the following statements? (By traditional media we mean mainstream media sources that are available in a print or broadcast format, such as newspapers, magazines, television news and radio news) [Top 4 Box, agree] Base: UK General Population 34

Business on Notice
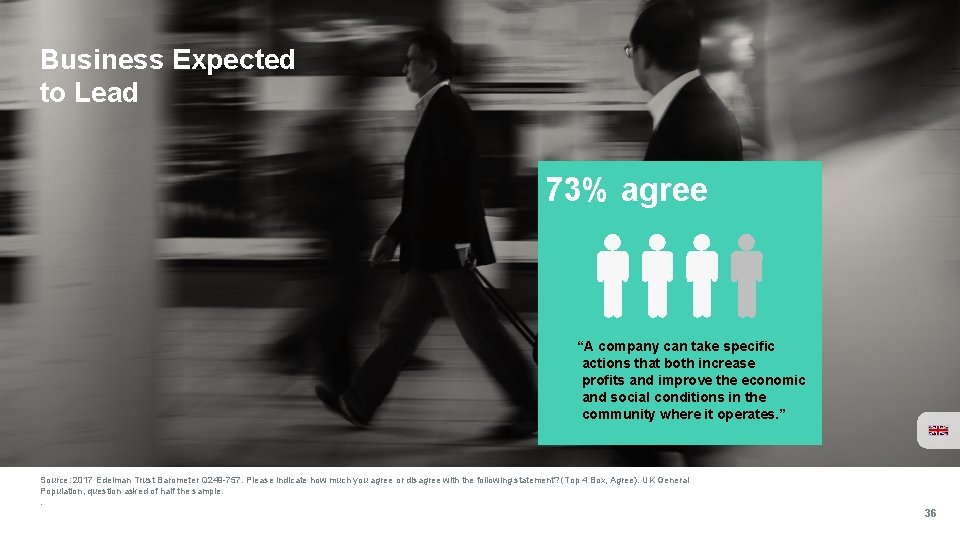
Business Expected to Lead 73% agree “A company can take specific actions that both increase profits and improve the economic and social conditions in the community where it operates. ” Source: 2017 Edelman Trust Barometer Q 249 -757. Please indicate how much you agree or disagree with the following statement? (Top 4 Box, Agree). UK General Population, question asked of half the sample. . 36
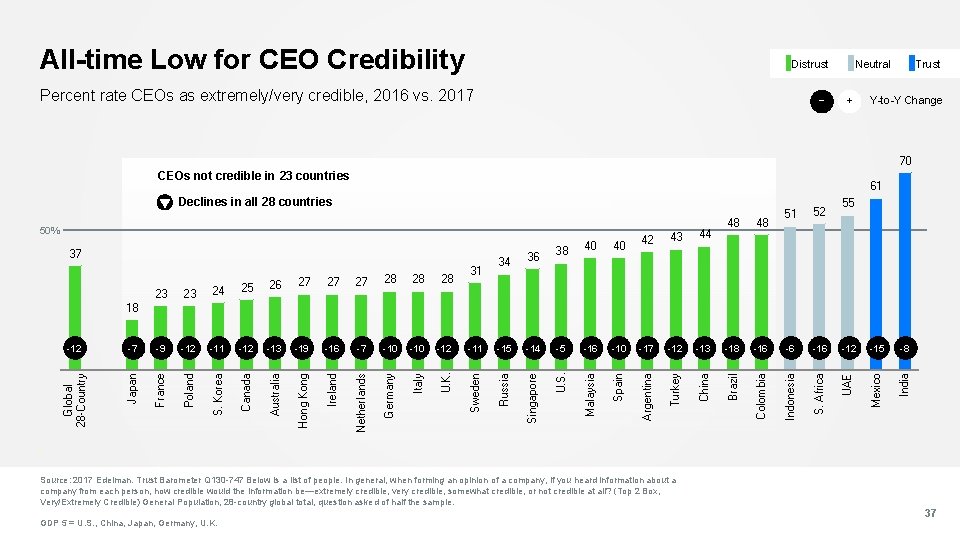
All-time Low for CEO Credibility Neutral Distrust Percent rate CEOs as extremely/very credible, 2016 vs. 2017 − + Trust Y-to-Y Change 70 CEOs not credible in 23 countries 61 Declines in all 28 countries 50% 37 23 23 24 25 26 27 27 27 28 28 28 31 34 36 38 40 40 42 43 44 48 48 51 52 55 -12 -7 -9 -12 -11 -12 -13 -19 -16 -7 -10 -12 -11 -15 -14 -5 -16 -10 -17 -12 -13 -18 -16 -6 -12 -15 -8 Global 28 -Country Japan France Poland S. Korea Canada Australia Hong Kong Ireland Netherlands Germany Italy U. K. Sweden Russia Singapore U. S. Malaysia Spain Argentina Turkey China Brazil Colombia Indonesia S. Africa UAE Mexico India 18 Source: 2017 Edelman. Trust Barometer Q 130 -747 Below is a list of people. In general, when forming an opinion of a company, if you heard information about a company from each person, how credible would the information be—extremely credible, very credible, somewhat credible, or not credible at all? (Top 2 Box, Very/Extremely Credible) General Population, 28 -country global total, question asked of half the sample. GDP 5 = U. S. , China, Japan, Germany, U. K. 37
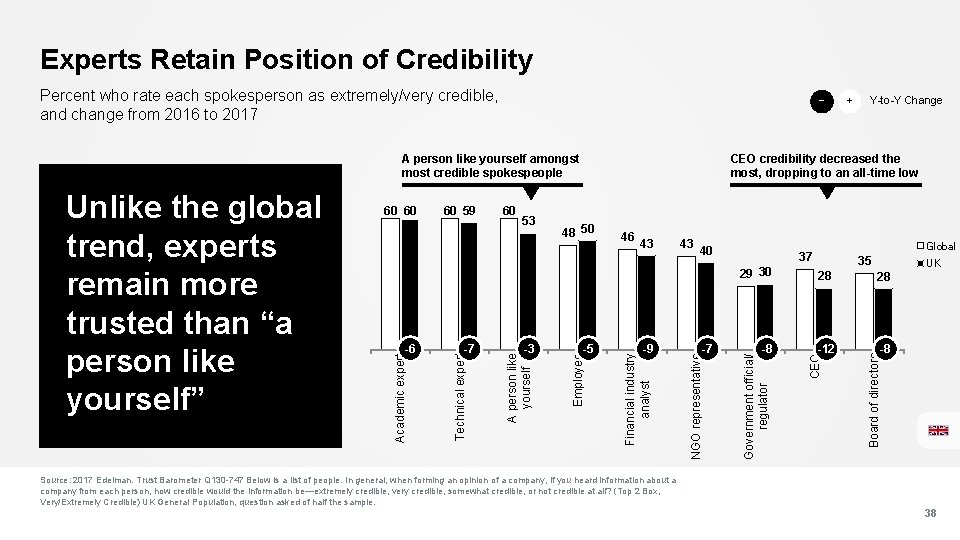
Experts Retain Position of Credibility Percent who rate each spokesperson as extremely/very credible, and change from 2016 to 2017 − 53 48 50 46 43 43 40 29 30 -9 -7 -8 Government official/ regulator -5 NGO representative -3 Financial industry analyst -7 Employee -6 Global 37 35 UK 28 28 -12 -8 Board of directors 60 A person like yourself -5 60 59 Technical expert -7 60 60 Academic expert Unlike the global trend, experts remain more trusted than “a person like yourself” Y-to-Y Change CEO credibility decreased the most, dropping to an all-time low CEO A person like yourself amongst most credible spokespeople + Source: 2017 Edelman. Trust Barometer Q 130 -747 Below is a list of people. In general, when forming an opinion of a company, if you heard information about a company from each person, how credible would the information be—extremely credible, very credible, somewhat credible, or not credible at all? (Top 2 Box, Very/Extremely Credible) UK General Population, question asked of half the sample. 38
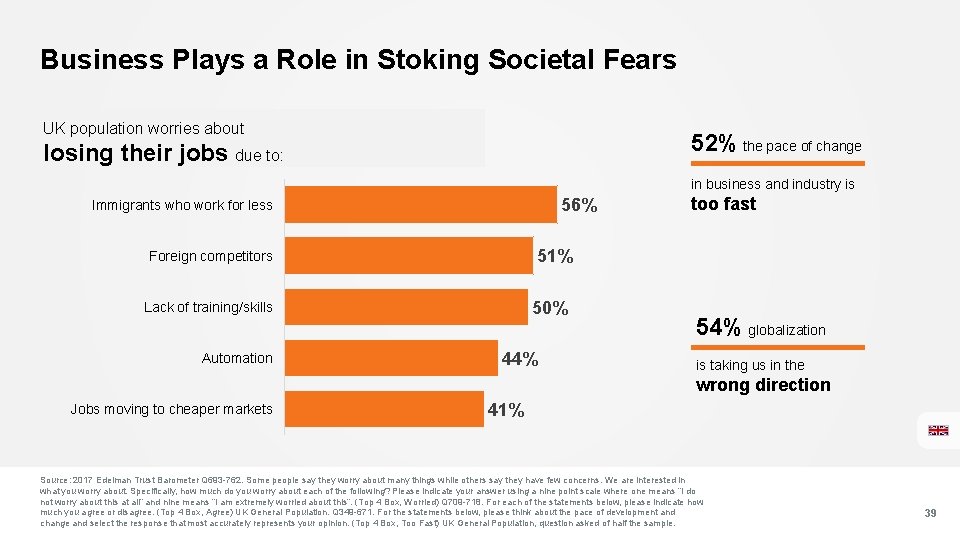
Business Plays a Role in Stoking Societal Fears UK population worries about 52% the pace of change losing their jobs due to: in business and industry is 56% Immigrants who work for less 51% Foreign competitors 50% Lack of training/skills Automation too fast 44% 54% globalization is taking us in the wrong direction Jobs moving to cheaper markets 41% Source: 2017 Edelman Trust Barometer Q 693 -762. Some people say they worry about many things while others say they have few concerns. We are interested in what you worry about. Specifically, how much do you worry about each of the following? Please indicate your answer using a nine point scale where one means “I do not worry about this at all” and nine means “I am extremely worried about this”. (Top 4 Box, Worried) Q 709 -718. For each of the statements below, please indicate how much you agree or disagree. (Top 4 Box, Agree) UK General Population. Q 349 -671. For the statements below, please think about the pace of development and change and select the response that most accurately represents your opinion. (Top 4 Box, Too Fast) UK General Population, question asked of half the sample. 39
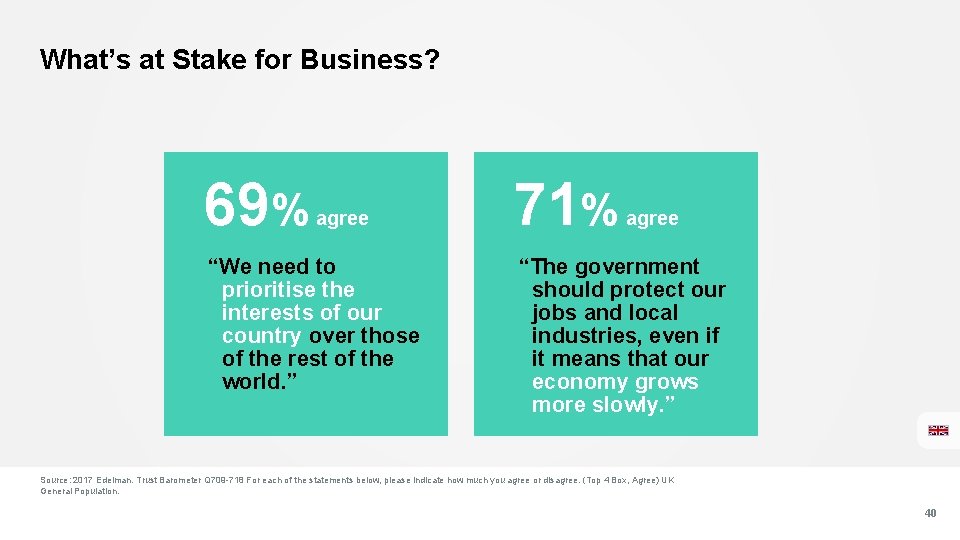
What’s at Stake for Business? 69% agree “We need to prioritise the interests of our country over those of the rest of the world. ” 71% agree “The government should protect our jobs and local industries, even if it means that our economy grows more slowly. ” Source: 2017 Edelman. Trust Barometer Q 709 -718 For each of the statements below, please indicate how much you agree or disagree. (Top 4 Box, Agree) UK General Population. 40
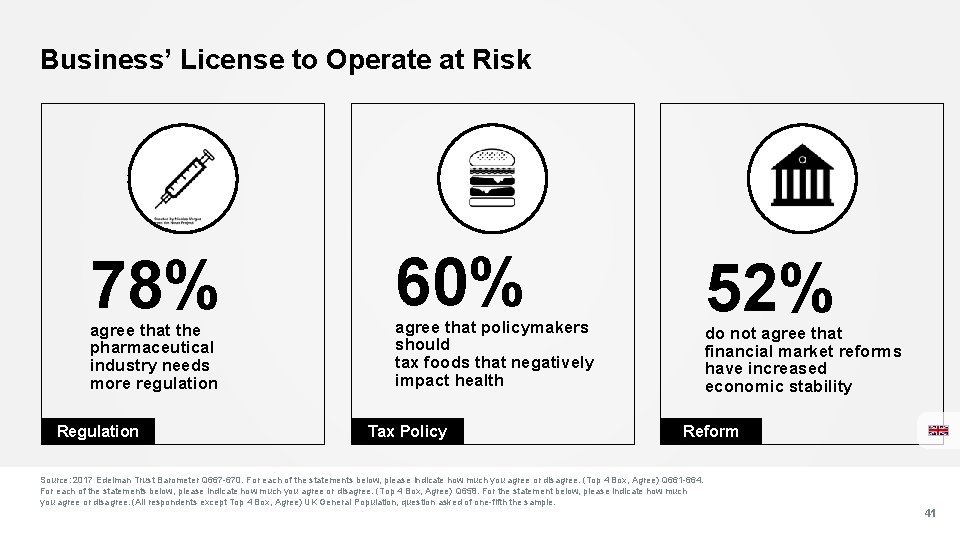
Business’ License to Operate at Risk 78% agree that the pharmaceutical industry needs more regulation Regulation 60% 52% agree that policymakers should tax foods that negatively impact health Tax Policy do not agree that financial market reforms have increased economic stability Reform Source: 2017 Edelman Trust Barometer Q 667 -670. For each of the statements below, please indicate how much you agree or disagree. (Top 4 Box, Agree) Q 661 -664. For each of the statements below, please indicate how much you agree or disagree. (Top 4 Box, Agree) Q 658. For the statement below, please indicate how much you agree or disagree. (All respondents except Top 4 Box, Agree) UK General Population, question asked of one-fifth the sample. 41
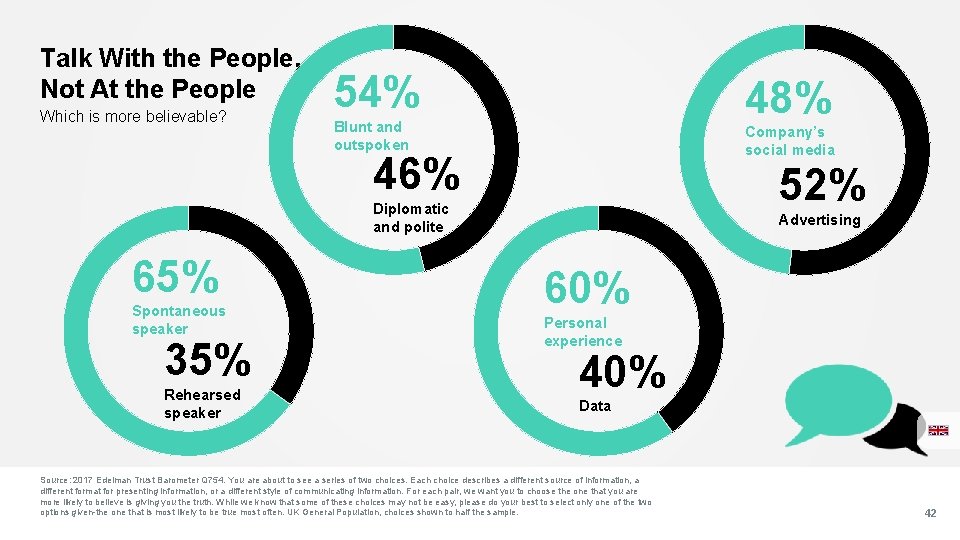
Talk With the People, Not At the People Which is more believable? 54% 48% Blunt and outspoken Company’s social media 46% 52% Diplomatic and polite 65% Spontaneous speaker 35% Rehearsed speaker Advertising 60% Personal experience 40% Data Source: 2017 Edelman Trust Barometer Q 754. You are about to see a series of two choices. Each choice describes a different source of information, a different format for presenting information, or a different style of communicating information. For each pair, we want you to choose the one that you are more likely to believe is giving you the truth. While we know that some of these choices may not be easy, please do your best to select only one of the two options given-the one that is most likely to be true most often. UK General Population, choices shown to half the sample. 42
With the People, Not For the People
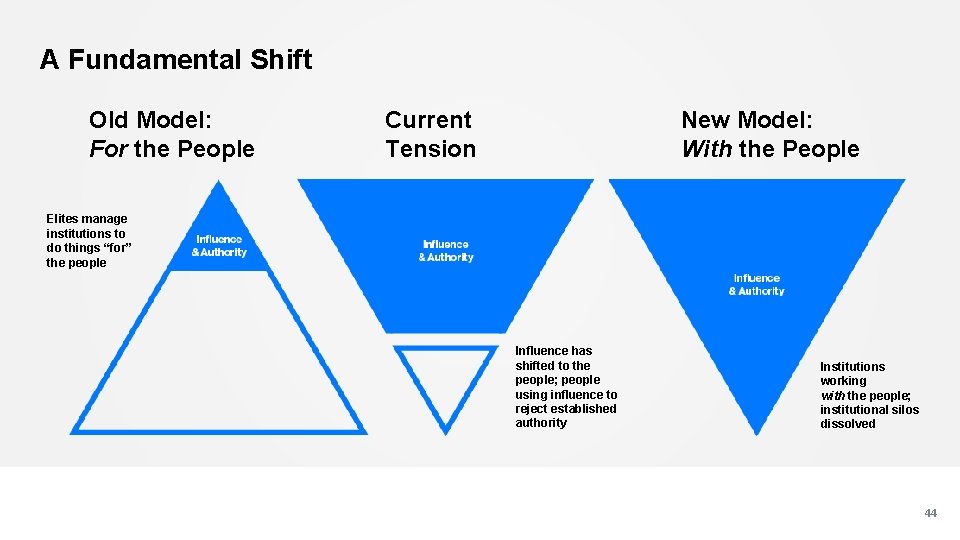
A Fundamental Shift Old Model: For the People Current Tension New Model: With the People Elites manage institutions to do things “for” the people Influence has shifted to the people; people using influence to reject established authority Institutions working with the people; institutional silos dissolved 44
- Slides: 44