2016 Tennessee Drought Survey 6045 Total Emails 40


 Answered:")


 Answered: 2,")


 Answered: 63")


- Slides: 32
2016 Tennessee Drought Survey
6045 Total Emails 40% 34% Response Rate 2405 Total Responses Completed Response Rate Opened Emails: 3383 (61% of opened emails completed) Complete Responses: 2077
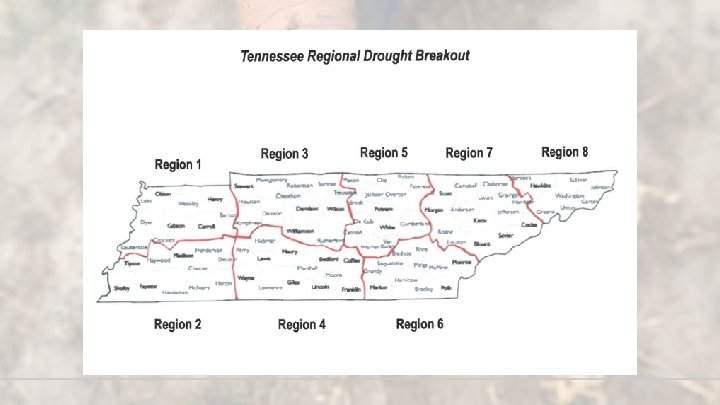
Q 1: In what region are you located? Answered: 2, 393 Skipped: 12
Q 2: How are you involved in the Agriculture Industry? Answered: 2, 346 Skipped: 59
Livestock Production
Q 3: Are you involved in Livestock Production? Answered: 2, 368 Skipped: 37 Q 4: What type of livestock do you manage? (Check all that apply) Answered: 2, 050 Skipped: 355
Q 5: Are you supplementing pasture due to drought? (Check all that apply) Answered: 2, 050 Skipped: 355 Q 6: How long have you been supplementing? Answered: 1, 975 Skipped: 430
Q 7: If you produce your own hay, total production this year was: Answered: 2, 031 Skipped: 374 Q 8: Total hay production was below average by: Answered: 1, 504 Skipped: 901
Q 9: Do you purchase hay in a year with average rain fall? Answered: 2, 034 Skipped: 371
Q 10: Are you going to have to purchase additional hay this year due to drought? Answered: 2, 006 Skipped: 399 Q 11: If so, approximately how much? (Round/Square) Answered: 1, 153 Round Region Square # Producers # Bales 1 64 5, 024 2 350 2 64 5, 633 3 700 3 102 9, 585 15 5, 460 4 215 20, 049 7 2, 150 5 185 20, 142 9 2, 325 6 141 18, 458 7 1, 165 7 134 14, 483 7 2, 130 8 117 14, 446 5 1, 950 Total 1, 022 107, 820 55 16, 230
Q 12: Have you been able to manage your hay resources more adequately due to TAEP infrastructure investments? Answered: 2, 000 Skipped: 405 Q 13: Do you use the Tennessee Hay Directory? Answered: 2, 031 Skipped: 374
Q 14: Have you had to market animals due to drought? (Check all that apply) Answered: 2, 039 Skipped: 366
Q 17: Will you replace these animals in the near future if rainfall increases in your area? Answered: 1, 978 Skipped: 427
Q 18: Have you had increased incidents of respiratory disease? Answered: 2, 029 Skipped: 376 Q 19: Have you had an increase in sick animals since drought conditions began in your area? Answered: 2, 035 Skipped: 370
Q 22: What is your source of water? (Check all that apply) Answered: 2, 028 Skipped: 377 Q 20: Are you having to supplement your normal water source for livestock due to drought? Answered: 2, 034 Skipped: 371
Q 21: If so, what date did you start supplementing your normal water source? Answered: 780 Skipped: 1, 628 Water Supplementation by Region (as reported) 175 150 125 100 75 50 25 0 April Region 1 May June Region 2 Region 3 July Region 4 August Sept Region 5 Region 6 Oct Region 7 Nov Region 8
Q 23: Approximate total farm loss due to drought? Region # of Producers Total Loss Range of Loss 1 58 $ 723, 225. 00 $800 - $250, 000 2 81 $ 689, 875. 00 $500 - $50, 000 3 125 $ 1, 267, 738. 00 $250 - $100, 000 4 236 $ 2, 538, 923. 00 $5 - $100, 000 5 208 $ 2, 508, 879. 00 $15 - $500, 000 6 140 $ 2, 829, 725. 00 $10 - $500, 000 7 134 $ 2, 485, 250. 00 $300 - $500, 000 8 123 $ 1, 714, 675. 00 $50 - $450, 000 Total 1, 105 $ 14, 758, 290. 00 18
Crop Production
Q 24: Are you involved in crop production? Answered: 2, 154 Skipped: 251
Q 28: Are you holding off on winter seeded crops until you receive adequate moisture? Answered: 455 Skipped: 1, 950
Q 25: How many acres of winter crops do you normally plant? Q 27: How many acres less did you plant due to drought? Region # Producers Reporting Total Acres per Region Range of Acres in Production # of Producers Who Stated # Acres Not They are Planting Less Due Planted Due to Drought % Acres Not Planted 1 42 18856 12 - 4500 17 3976 21% 2 28 5604 3 - 1200 13 1504 27% 3 45 13555 3 - 3000 13 920 7% 4 67 12372 2 - 1150 27 2537 21% 5 47 5657 5 - 600 17 1390 25% 6 35 5500 5 - 750 20 3189 58% 7 34 4683 6 - 1750 12 987 21% 8 47 4260 3 -1600 25 937 22% Total 345 70487 141 15440 22%
Q 29: Approximated Total Crop Loss Due to Drought? Region # Producers Reporting Total Loss 1 18 $ 713, 700. 00 2 18 $ 571, 800. 00 3 17 $ 177, 500. 00 4 32 $ 1, 273, 418. 00 5 19 $ 6 22 $ 1, 769, 800. 00 7 19 $ 356, 000. 00 8 24 $ 824, 420. 00 Total 169 439, 460. 00 $ 6, 126, 098. 00
Horticulture Production
Q 30: Are you involved in horticulture? Q 31: Is your horticulture operation any of the following? (Check all that apply) Answered: 2, 061 Answered: 86 Skipped: 344 Skipped: 2, 319
Q 32: Have you lost plants due to the drought this season? Answered: 90 Skipped: 2, 315 Region # Producers Reporting # Reporting Loss Value Lost Due to Plant Death Loss B&B 9 6 $ 126, 000. 00 Bareroot 10 5 $ 167, 000. 00 Container 17 7 $ 44, 407. 00 Evergreen 11 10 $ 214, 600. 00 Other 28 12 $ 84, 750. 00 Total 75 40 $ 636, 757. 00
Q 34: Have you lost sales due to the drought this year (growth loss, inability to dig, etc)? Answered: 89 Skipped: 2, 316 Region # Reporting Value of Sales Lost B&B 8 $ 425, 100. 00 Bareroot 5 $ 102, 000. 00 Container 7 $ 236, 710. 00 Evergreen 5 $ 55, 800. 00 Other 7 Total 32 $ $ 70, 350. 00 889, 960. 00
Q 36: Approximate future loss due to drought? Region # Reporting Loss Value of Sales Lost B&B 5 $ 480, 000. 00 Bareroot 5 $ 262, 500. 00 Container 4 $ 75, 200. 00 Evergreen 7 $ 282, 200. 00 Other 5 $ 4, 036, 000. 00 Total 26 $ 5, 135, 900. 00
Q 37: Have you used irrigation this year? Answered: 98 Skipped: 2, 307 Q 38: Do you have access to irrigation? Answered: 98 Skipped: 2, 307
Q 39: What is your source of irrigation? (Check all that apply) Answered: 63 Skipped: 2, 342
Q 40: Approximate total horticulture value lost due to drought: Region # Reporting Loss Value Total Value Lost B&B 6 $ 730, 000. 00 Bareroot 5 $ 178, 200. 00 Container 8 $ 295, 700. 00 Evergreen 8 $ 117, 400. 00 Other 10 $ 4, 089, 700. 00 Total 37 $ 5, 411, 000. 00
Total Value Lost by Reporting Producers Region # Producers Reporting Total Loss of Value Livestock 1047 $ 14, 758, 290. 00 Crop 164 $ 6, 126, 098. 00 Horticulture 31 $ 5, 411, 000. 00 Total 1, 311 $ 26, 295, 388. 00