2016 Forage Production 500 lbsac Forage Production in
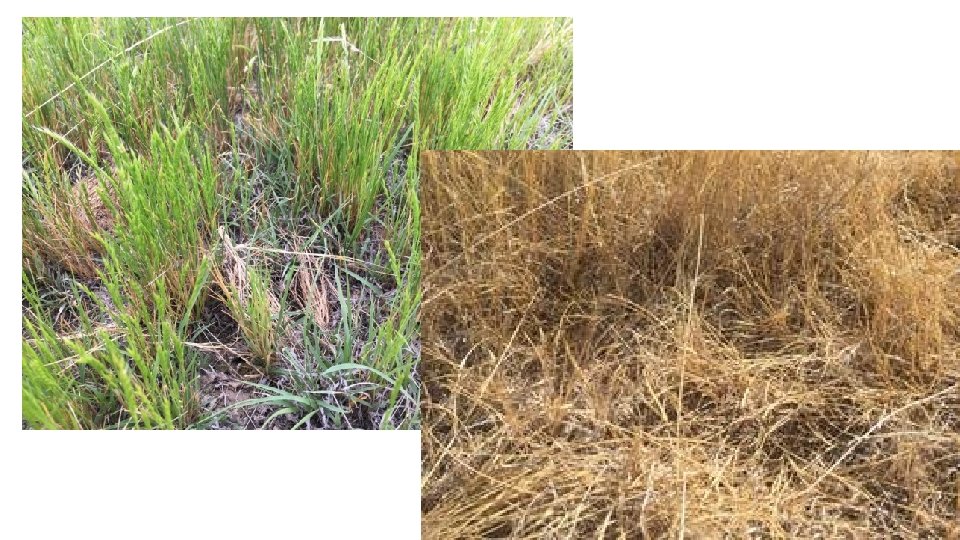

2016 Forage Production ~500 lbs/ac Forage Production in Loamier Pastures ~730 lbs/ac Forage Production in Sandier Pastures
 changed over the past 4 years")
How has the abundance of Western Wheatgrass (WW) changed over the past 4 years (2013 -2016) in relation to grazing management?

Change in WW abundance averaged across 10 AGM vs. 10 TGM pastures, 2013 -2016 How fast did they increase? WW Rate of Increase (2016 density divided by 2013 density per pasture; thick black line Is mean ROI; thin line is median); no statistical difference between grazing treatments How much did they increase? WW Net Increase (2016 Density minus 2013 Density per pasture; thick black line Is mean change); no statistical difference between grazing treatments
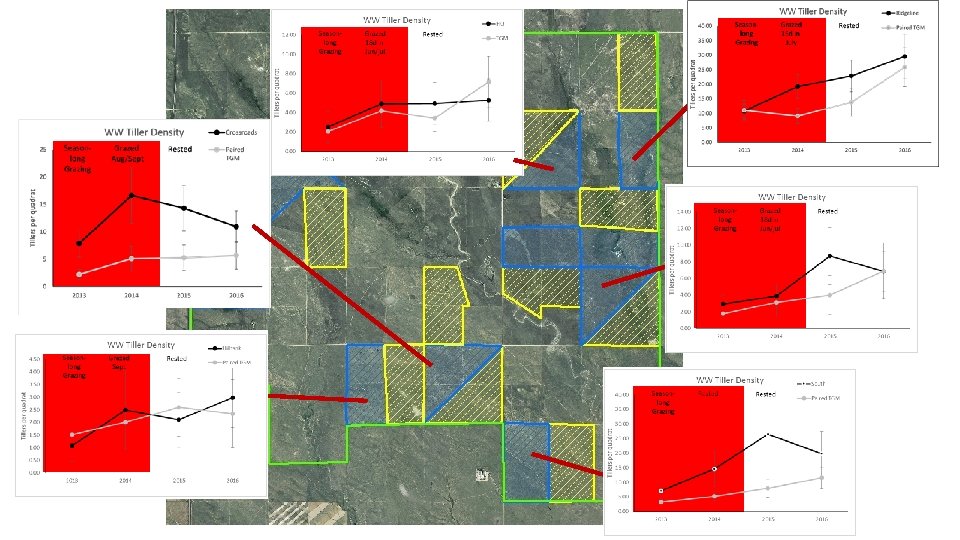

WW tiller densities did not increase more in Change in WW abundance averaged across 6 AGM pasturesrested. AGM in 2015 6 paired TGM pastures vs. TGM pastures How fast did they increase relative to 2013 density? WW Rate of Increase (2016 density divided by 2013 density per pasture; thick black line Is mean ROI; thin line is median); no statistical difference between grazing treatments How much did they increase relative to 2013 density? WW Net Increase (2016 Density minus 2013 Density per pasture; thick black line Is mean change); no statistical difference between grazing treatments

Residual Forage Biomass, October 2016
 2015 2016")
Residual Heterogeneity (Total Biomass) 2015 2016
 2015 2016")
Residual Heterogeneity (Forage Biomass) 2015 2016

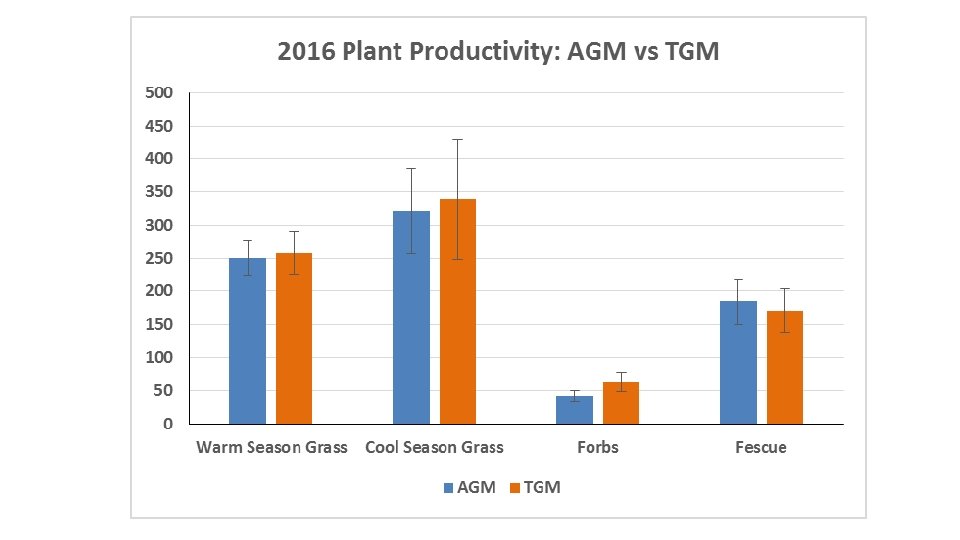
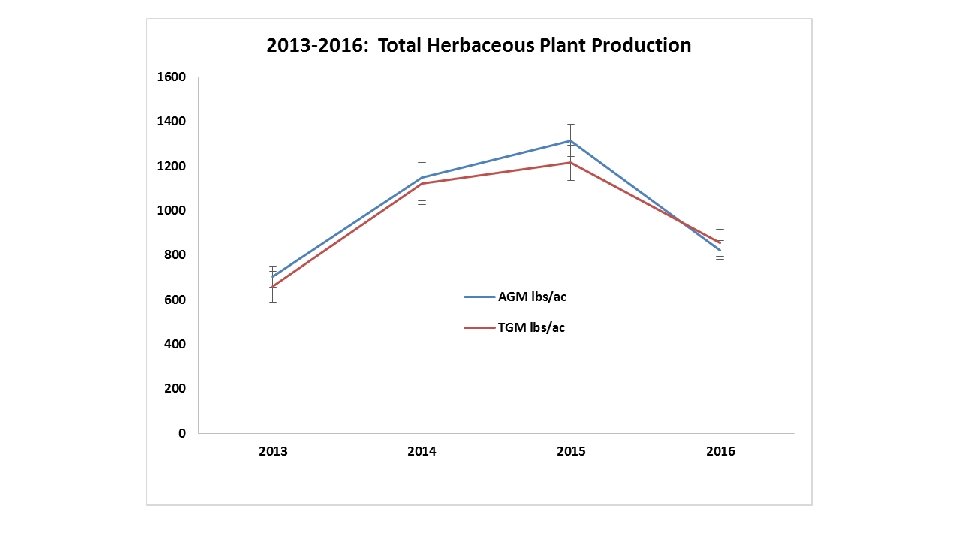
Vegetation Monitoring Summary • Substantial six-weeks fescue growth in the spring • Average of 565 lbs/ac forage production (excluding fescue) during May – August • Total forage production and cool-season grass production similar between AGM and TGM pastures • Changes in western wheatgrass abundance (2013 -2016) similar between AGM and TGM; not affected by resting pastures • Rested pastures have, on average, 170 lbs/ac more residual forage than paired TGM pastures
- Slides: 12