2016 Biennial Assessment of Ohio River Water Quality

2016 Biennial Assessment of Ohio River Water Quality Conditions 305 B REPORT 2010 -2014

Weight of Evidence Approach �Recommended by the Technical Committee and approved by the Commission, October 2011. �Weight of evidence utilized in the 2016 assessments. �Weight of evidence had effects on aquatic life use, mercury fish consumption, and public water supply assessments.

2014 Assessment Summary Aquatic Life States PA 0. 0 -40. 2 OH-WV 40. 2 -317. 1 OH-KY 317. 1 -491. 3 IN-KY 491. 3 -848. 0 IL-KY 848. 0 -981. 0 TOTAL 981. 0 0 0 0 Number Miles Use is Impaired Fish Contact Public Water Consumption Recreation Supply for PCBs & for Mercury Dioxin 40. 2 0 242. 2 0 276. 9 0 65. 0 0 174. 2 0 243. 6 0 356. 7 0 40. 6 0 133. 0 0 631. 6 0 981. 0 0

Aquatic Life Use Assessment �“Weight-of-Evidence Approach” relies on biological assessments including fish and macroinvertebrate indices. �First assessment including macroinvertebrate index. �Criteria violations > 10% indicate impairment. �Aquatic life criteria exceeded for: � Total iron (states’ criteria) � Dissolved oxygen � Temperature � 305 b workgroup recommended against using DO & Temperature data that are collected only during worst-case summer months. �Bioassessments indicate full support river-wide.
 Biological Data 2015 2010 = Avg. Pool Fish Condition = Avg. Pool")
2016 305(b) Biological Data 2015 2010 = Avg. Pool Fish Condition = Avg. Pool Macro Condition

Aquatic Life Water Criteria Violations July 2008 – June 2013 Mile Point Site. Name 84. 2 Pike Island 126. 4 Hannibal 161. 8 Willow Island 203. 9 Belleville 279. 2 R. C. Byrd 341 Greenup 436. 2 Meldahl Anderson 477. 5 Ferry 531. 5 Markland 600. 6 Louisville 606. 8 Mc. Alpine 720. 7 Cannelton 776 Newburgh 846 J. T. Myers 918. 5 Smithland 938. 9 L&D 52 WQC Applied Max Result (ug/L) Parameter Count of Violations # of Events % Violations WV (1500 ug/L) WV (1500 ug/L) KY (1000 ug/L) Fe (ug/L) Fe (ug/L) 2 2 3 6 1 14 15 3, 297 3, 030 4, 690 2, 191 1, 649 7, 576 5, 984 30 30 30 29 30 7% 7% 10% 21% 3% 48% 50% KY (1000 ug/L) KY (1000 ug/L) KY (1000 ug/L) Fe (ug/L) Fe (ug/L) Fe (ug/L) 5 15 6 14 14 15 15 15 18 5, 292 6, 780 7, 132 9, 427 5, 035 8, 877 14, 327 4, 790 6, 407 9 30 9 28 30 30 30 56% 50% 67% 50% 47% 50% 50% 60%

Contact Recreation Use Assessment �Assessment includes: � Bacteria data from 15 historical river-wide longitudinal surveys. � Contact recreation data from the past 5 years collected seasonally in the 6 largest CSO communities. � Vast majority of river is assessed based on historical longitudinal surveys. �States’ criteria used for assessment. �Criteria violations > 10% indicate Partial Support. > 25% indicate Not Supporting. �Approximately 2/3 of river impaired for contact recreation use: Consistent with past assessments.

Public Water Supply Use Assessment �Impairment based on finished water MCL violations caused by Ohio River water quality. �Accessed USEPA data base of MCL violations and water utility surveys. �Human health criteria violations in > 10% of samples indicates impairment. � 6 utilities had MCL violations for trihalomethanes, one for HAA 5’s, two for Fecal coliform. �Attributed to treatment issues, not Ohio River water quality. �Entire river assessed as fully supporting public water supply use.

Intake Closures No Nonroutine Treatment No No No West View Robinson Moon Beaver Valley (NOVA) Midland East Liv Buckeye Toronto 5 8. 6 11. 7 PA PA PA 29 PA 36 40. 2 74. 1 59. 2 PA OH OH OH No No Arcelor Mittal 61. 7 WV No No Weirton Steubenville Follansbee (H. H. ) Wheeling New Martin Sistersville Huntington Ashland Ironton 62. 5 65. 3 WV OH 70. 8 WV 86. 8 121. 9 137. 2 304 319. 7 327 WV WV KY OH MCL Violations TTHM (6) TTHM No No TTHM (5)

Intake Closures Nonroutine Treatment Russell Portsmouth Maysville Cincinnati N. KY Louisville Evansville Henderson Mt Vernon Morganfield 327. 6 350. 8 407. 8 462. 9 600 791. 5 803 829. 3 842. 5 KY OH KY KY IN KY Sturgis 871. 4 KY Paducah (WTP) 935. 5 KY No No Paducah (USEC) 945. 9 KY No No 978 IL Cairo MCL Violations TTHM (4) No No Yes Yes No No Turb Coliform TTHM (7), HAA 5, Coliform TTHM

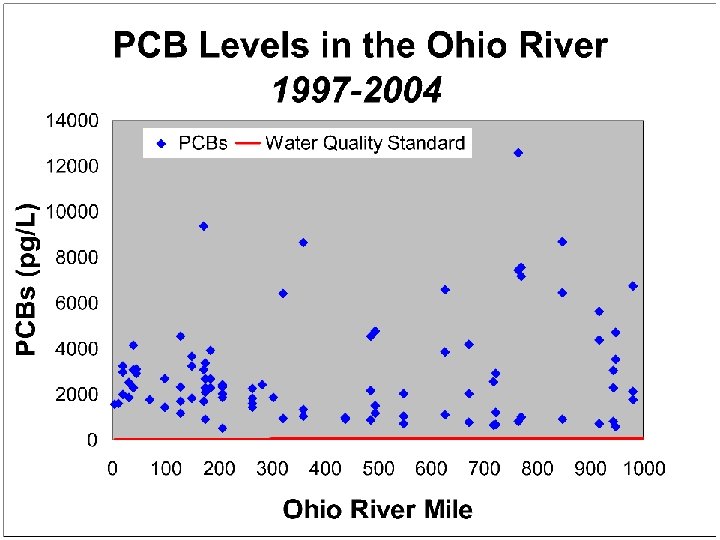
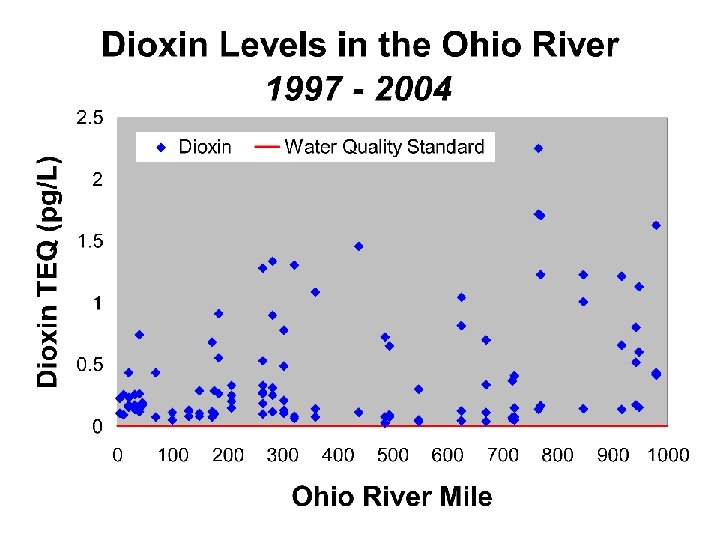
Fish Consumption Use Assessment �The entire Ohio River is designated as partially supporting for PCBs and dioxin. �ORSANCO directed by TEC to use US EPA’s approach for determining impairment based on methylmercury fish tissue data. �Collected data necessary to use EPA’s methodology. �Violations of mercury water quality criterion in > 10% of samples indicates impairment. �Using “WOE Approach”, entire river Full Support for fish consumption based on Methylmercury.

Total Mercury Water Violations Mile Pt. Site. Name 84. 2 Pike Island 126. 4 Hannibal 161. 8 Willow Island 341 Greenup 436. 2 Meldahl 477. 5 And. Ferry 531. 5 Markland 600. 6 Louisville 606. 8 Mc. Alpine 776 Newburgh 846 J. T. Myers 918. 5 Smithland 938. 9 L&D 52 Count of Hg Violations 1 1 1 3 3 2 4 6 2 4 Max Result, ng/L 12. 5 13. 6 19. 1 16. 5 17. 6 13. 4 19. 4 20. 6 26. 1 17. 8 40. 6 15. 2 18. 0 # of Events % Violations 30 3% 30 10% 29 3% 9 11% 30 10% 9 33% 28 7% 30 13% 30 20% 29 7% 29 14%

Averaging Data Across Trophic Levels Cavg = 3. 8 * C 2 + 8. 0 * C 3 + 5. 7 * C 4 (3. 8 + 8. 0 + 5. 7) Where: C 2 = average mercury concentration for trophic level 2 C 3 = average mercury concentration for trophic level 3 C 4 = average mercury concentration for trophic level 4 **Calculation is based on apportioning the 17. 5 grams/day national default consumption rate for freshwater fish by trophic level 5. 7 grams/day of TL 4 fish 8. 0 grams/day of TL 3 fish 3. 8 grams/day of TL 2 fish Guidance for Implementing the January 2001 Methylmercury Water Quality Criterion – US EPA

Fish Consumption-Weighted Methylmercury Fish Tissue Pool Emsworth Dashields Montgomery New Cumb. Pike Island Hannibal Willow Island Belleville Racine RC Byrd Greenup Meldahl Markland Mc. Alpine Cannelton Newburgh JT Myers Smithland Olmsted Open Water # Samples 7 8 6 4 4 10 18 11 9 6 10 8 15 14 6 9 11 14 11 5 Max. Me. Hg Conc. , ppm 0. 27 0. 23 0. 17 0. 28 0. 64 0. 29 0. 44 0. 24 0. 36 0. 27 0. 49 0. 45 0. 37 0. 29 0. 86 0. 67 0. 49 N > 0. 3 ppm 0 0 0 3 1 0 3 0 2 0 5 1 1 0 4 6 2 1 Me. Hg Concumption. Weighted Avg. Concentration (ppm) 0. 120 0. 160 0. 125 0. 186 0. 146 0. 246 0. 141 0. 168 0. 211 0. 179 0. 176 0. 177 0. 221 0. 191 0. 181 0. 136 0. 246 0. 281 0. 187 0. 145
 Need consideration by TEC for Approval of Assessments. 2) Bacteria, PCBs")
TEC Considerations 1) Need consideration by TEC for Approval of Assessments. 2) Bacteria, PCBs & Dioxin data/assessments are old. 3) Continue collection of Methylmercury in fish tissue.
- Slides: 17