2015 English Indices of Deprivation South Devon and

")

 is a")

 level Neighbourhood (LSOA) The deprivation indices are")


 LSOAs • 42,")
 LSOAs • 49, 500 (18%)")
 LSOAs • 66, 600 (24%)")

 Rate of employment support allowance claimants (16 -64")
 Annual Survey of Hours and Earnings, Median Annual pay")
 LSOAs • 51,")


 LSOAs Resident")
 LSOAs • 42, 100 (15%)")
 LSOAs")
 LSOAs • 88, 500")
 LSOAs • 40,")
 LSOAs •")


- Slides: 30
2015 English Indices of Deprivation – South Devon and Torbay CCG Contact: statistics@torbay. gov. uk Torbay Public Health
Overview • Background • How is the model built? • Clinical Commissioning Group (CCG) level deprivation • Neighbourhood level deprivation • Change overtime
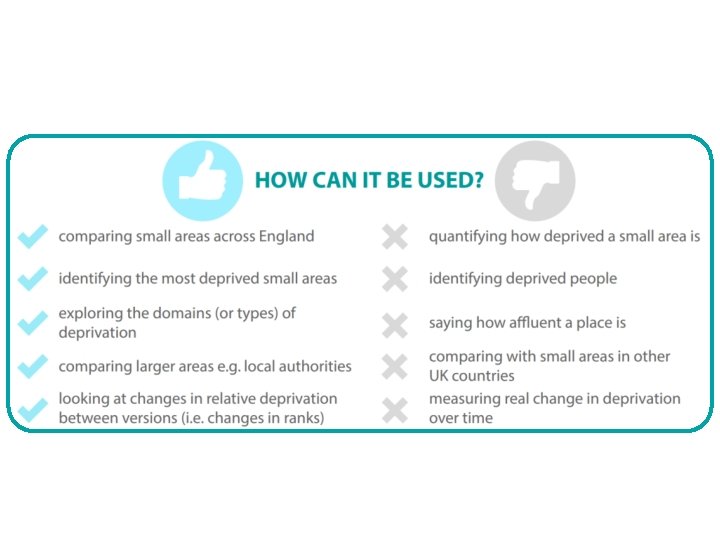
Background • It’s the governments official measure of multiple deprivation • The Indices of Deprivation 2015 provide a set of relative measures of deprivation for small areas (Lower-layer Super Output Areas) across England, based on seven different domains • The 2015 indices are the 4 th release at small area • A range of summary measures are available for higherlevel geographies including local authorities, local enterprise partnerships, and clinical commissioning groups
How is the model built? • The Index of Multiple Deprivation (IMD) is a weighted model across 7 domains • Income and Employment contribute almost half (45%) of the overall model
• There are 37 indicators that are used within overall IMD and the domains • Most of the data is taken from 2012/13
SUMMARIES TWO LEVELS Clinical Commissioning Group (CCG) level Neighbourhood (LSOA) The deprivation indices are published at different levels; the CCG level is presented first, followed by the neighbourhood…
How does South Devon & Torbay CCG compare? • South Devon and Torbay CCG rank as: – 88 out of 209 Clinical Commissioning Group (Rank of 209) Health IMD - Rank of Deprivation average rank and Disability Lincolnshire East 49 51 Great Yarmouth and Waveney 52 59 ** South Devon and Torbay ** 88 93 Wyre Forest 96 122 North East Essex 99 88 Eastbourne, Hailsham and Seaford 123 120 North Derbyshire 132 98 South Worcestershire 139 146 Fylde & Wyre 141 67 West Cheshire 154 108 South Eastern Hampshire 165 137 Right. Care comparable CCGs
Relative CCG Position Interpreting the dials: • The dial represents the 209 CCGs in England. • The dial segments represent CCGs by decile. • E. g. the red segments show the CCGs that rank amongst the 10% most deprived in England. • The orange pin marks SD&T CCGs position. • The grey pin marks Wyre Forest CCG position (Right. Care comparator – nearest IMD neighbour).
Relative CCG Position
Neighbourhood level – CCG IMD Release Resident population in top 20% most deprived 2004 23, 2007 26, 200 2010 31, 100 2015 47, 100
Neighbourhood level - CCG IMD Release 2015 Resident population in top 20% most deprived 47, 100 28 of 31 LSOAs across South Devon and Torbay in Top 20% most deprived are in Torbay
Index of Multiple Deprivation Areas in top 20% • 31 (20) LSOAs • 42, 100 (15%) • Average • SD&T = 41. 6 years • England = 35. 5 years • Lowest rank • 219 (Roundham) • 6 areas in top 1, 000
Income Deprivation Areas in top 20% • 33 (22) LSOAs • 49, 500 (18%) • Average • SD&T = 41. 3 years • England = 35. 5 years • Lowest rank • 708 (Roundham) • 2 areas in top 1, 000
Employment Deprivation Areas in top 20% • 44 (43) LSOAs • 66, 600 (24%) • Average • SD&T = 43. 1 years • England = 36. 5 years • Lowest rank • 233 (Roundham) • 8 areas in top 1, 000
Absolute v relative change There have been absolute improvements in some data, however faster and larger improvements have taken place elsewhere; e. g. • Child poverty – absolute improvement, but relatively high levels remain • Annual gross pay – absolute improvement, but relatively low compared to other areas Further examples are presented on the following slide…
Additional income and employment context (CCG) Rate of employment support allowance claimants (16 -64 years) – support for people who are unable to work due to ill health or disability Rate of jobseekers allowance claimants (16 -64 years) – support for people who are unemployed but looking for employment Source: Department of Work and Pensions, Nomis
Additional Income and Employment (Torbay) Annual Survey of Hours and Earnings, Median Annual pay – gross Source: ONS 2014 - 3 rd lowest in England Proportion of resident population aged 16 -64 claiming Jobseeker's Allowance Source: NOMIS Aug 2015 - highest in Region Workplace based GVA per head NUTS 3 at current basic prices Source: ONS table 3. 2 2013 - 5 th lowest in England Insolvency statistics: Debt relief orders rate of new cases per 10, 000 adult popn Source: gov. uk 2012 - highest rate in England
Health Deprivation and Disability Areas in top 20% • 35 (16) LSOAs • 51, 500 (19%) • Average • SD&T = 42. 7 years • England = 36. 8 years • Lowest rank • 613 (Tormohun) • 3 areas in top 1, 000
Underlying Health indicators
Underlying Health indicators
Education, Skills and Training Deprivation Areas in top 20% • 19 (20) LSOAs Resident • 27, 600 (10%) • Average • SD&T = 39. 9 years • England = 36. 3 years • Lowest rank • 854 (Watcombe) • 1 area in top 1, 000
Crime Deprivation Areas in top 20% • 28 (18) LSOAs • 42, 100 (15%) • Average • SD&T = 42. 3 years • England = 35. 6 years • Lowest rank • 19 (Wellswood) • 7 areas in top 1, 000
Barriers to Housing and Services Deprivation Areas in top 20% • 23 (30) LSOAs • 36, 800 (14%) • Average • SD&T = 45. 8 years • England = 37. 8 years • Lowest rank • 168 (Moorland) • 4 areas in top 1, 000
Living Environment Deprivation Areas in top 20% • 57 (53) LSOAs • 88, 500 (33%) • Average • SD&T = • England = 36. 8 years • Lowest rank • 223 (Ellacombe) • 13 areas in top 1, 000
Income Deprivation Affecting Children Areas in top 20% • 28 (16) LSOAs • 40, 600 (15%) • Average • SD&T = 40. 8 years • England = 35. 2 years • Lowest rank • 1, 076 (Watcombe) • 0 areas in top 1, 000
Income Deprivation Affecting Older People Areas in top 20% • 25 (20) LSOAs • 37, 100 (14%) • Average • SD&T = 40. 4 years • England = 34. 6 years • Lowest rank • 1, 128 (Watcombe) • 0 areas in top 1, 000
Change in count of CCG LSOAs in top 20% most Deprived Interpreting the chart • The darker circles represent the latest data; the lighter previous releases • The numbers at the bottom of the chart represent the count of areas in the top 20% most deprived in South Devon and Torbay over time • The red circles indicate what is driving the increase in multiple deprivation This shows that we have observed an increase in areas in top 20% most deprived
Widening inequalities in the CCG 2 communities that were ranked as in the 10+% to 20% most deprived in 2010 are now ranked in the top 10% most deprived in 2015 – these changes are shown in red ‘The poor are getting poorer’ 5 communities that were ranked as in the 60+% to 70% most deprived in 2010 are now ranked in the 70+% to 80% most deprived in 2015 – these changes are shown in green ‘The rich are getting richer’
Main Messages • South Devon and Torbay CCG is generally about average in terms of relative deprivation. • Increasing population living in top 20% most deprived – particularly in Torbay. • Living environment, health and disability and employment deprivation are the biggest contributors to overall deprivation. • There has been a widening gap in relative levels of deprivation across the communities of South Devon and Torbay.