2015 2016 FORMULATION CHECK SAMPLE PROGRAM OVERVIEW Ping


- Slides: 22
2015 -2016 FORMULATION CHECK SAMPLE PROGRAM OVERVIEW Ping Wan Office of Indiana State Chemist wanp@purdue. edu 1
PROGRAM BACKGROUND § The only proficiency testing program featuring pesticide formulation samples. § Hosted by Office of Indiana State Chemist since 2000. § Current membership involves 89 Laboratories. § Annual fee: $200 U. S domestic $250 international 2
PROGRAM OUTLINE § Four to six active ingredients annually. § A wide range of pesticide ingredients and product types. § Samples subdivided from commercial products. § Participants are encouraged to use their in-house methods. However, copies of registrant methods are provided in courtesy of U. S. EPA, Office of Pesticide Programs in Ft. Meade, MD. 3
2016 AAPCO CHECK SAMPLE PROGRAM PARTICIPATION 89 Labs Participating § § § 36 Labs from US Regulatory or Government Agencies 5 Labs from U. S. Private Industry 48 International Labs 50 40 US Gov. 30 US Ind. 20 Internation al 10 0 # paricipating 4
2008 -2016 PARTICIPATION TREND � � Stable participation from U. S. Regulatory labs 42 ………. . 36 Lost a few labs from U. S. Private Industry 12 ………. . 5 60 50 40 30 U. S Regulatory U. S. Industry 20 International � Strong international demand: 17 ………. . 48 10 0 2008 2009 2010 2011 2012 2013 2014 2015 2016 5
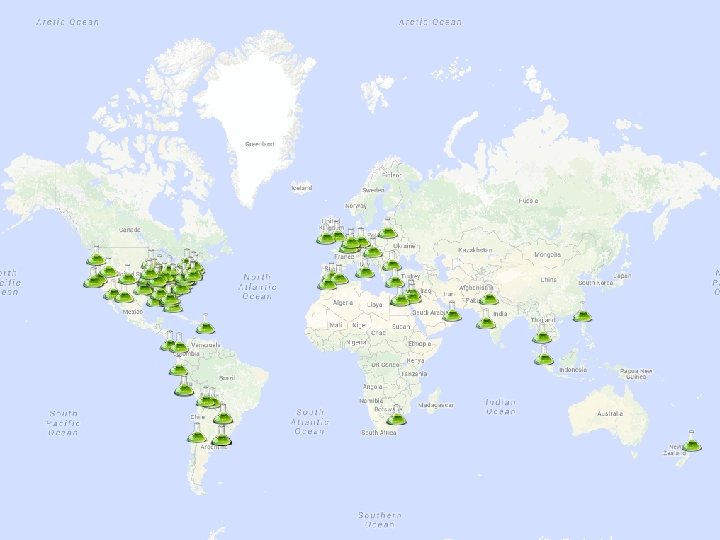
2016 PARTICIPANTS FROM US REGULATORY OR GOVERNMENT AGENCIES
2016 TESTING SAMPLES Sample 2016 -1 Bonide Dura. Turf Insect & Grub Control with Imidacloprid and Lambda-Cyhalothrin v Sample 2016 -2 Glyphosate 4 Plus Herbicide v Sample 2016 -3 Weedone LV 4 Solventless Broadleaf Herbicide v 8
2015 TESTING SAMPLES Sample 2015 -1 Quali-Pro fungicide with Propiconazole v Sample 2015 -2 Delta. Dust Insecticide with Deltamethrin v Sample 2015 -3 Sedge Ender Herbicide with Sulfentrazone and Prodiamine v 9
AAPCO Check Sample # Active Ingredient Product # of Participating Labs # of Labs using GC # of Labs using LC Significant Difference Between LC and GC? 1 Percent of Results Failing the Sample 2 2015 -1 Transparent Amber Liquid Propiconazole 62 38 26 No 7. 46% 2015 -2 White Dust Deltamethrin 65 23 43 No 39. 39% 2015 -3 Opaque Yellow Liquid Sulfentrazone 52 15 37 No 13. 46% Prodiamine 46 33 13 No 21. 74% AAPCO Check Sample # Analyte and Label Claim Minimum Result Maximum Result Grand Average # of Outliers 3 Average Excluding Outliers Grand %CV Excluding Outliers Homogeneity Test Average Homogeneity Test %CV 2015 -1 Propiconazole (14. 3%) 11. 65 15. 34 14. 18 2 14. 24 4. 73 3. 90 14. 40 1. 7 2015 -2 Deltamethrin (0. 05%) 0. 020 0. 114 0. 040 5 0. 039 26. 80 11. 45 0. 036 8. 1 Sulfentrazone (1. 36%) 0. 989 1. 683 1. 328 4 1. 328 8. 77 5. 61 1. 297 2. 8 Prodiamine (2. 73%) 1. 965 3. 315 2. 626 4 2. 650 8. 42 5. 13 2. 688 1. 1 2015 -3 10
AAPCO 2015 -1 Propiconazole Lab Data Summary 17. 50 GC-FID GC-MS LC-PDA LC-MS 16. 50 14. 50 13. 50 12. 50 11. 50 10. 50 1 2 3 5 6 8 10 14 15 16 17 18 20 GC 20 LC 21 22 23 24 25 26 27 31 32 34 35 37 38 39 40 41 42 44 45 47 50 54 55 58 59 63 67 68 69 70 GC 70 LC 71 73 74 76 78 79 80 82 83 85 87 88 89 90 91 94 95 96 99 102 103 104 % Propiconazole Found 15. 50 Lab Number Median Lower Horwitz Upper Horwitz Xm - 2 MADE Xm + 2 MADE Two-Day Average 11
41 -6. 0 67 -4. 0 71 -3. 0 3 21 Modificed Z-Score -2. 0 -1. 0 47 94 102 79 70 GC 50 1 42 25 37 45 40 32 87 15 91 16 38 54 63 73 74 58 35 22 10 31 20 GC 2. 0 1. 0 39 103 68 78 23 8 18 34 82 59 70 LC 6 85 95 104 99 27 80 24 5 44 76 96 55 83 69 17 2 20 LC 26 89 14 88 90 AAPCO 2015 -1 Propiconazole Z-Score 3. 0 0. 0 -5. 0 Lab Number 12
AAPCO 2015 -2 Deltamethrin Lab Data Summary GC/FID LC/MS LC/PDA GC/MS GCECD 0. 110 0. 070 0. 050 0. 030 0. 010 1 2 3 5 6 8 10 14 15 16 17 18 20 21 22 23 24 25 26 27 31 32 35 37 38 39 40 41 42 44 45 47 50 54 55 58 59 63 67 70 71 73 74 76 77 78 79 80 81 82 83 85 86 87 88 89 90 91 95 96 99 GC 99 LC 102 103 104 % Deltamethrin Found 0. 090 Lab Number Two-Day Average Median Lower Horwitz Upper Horwitz Xm - 2 MADE Xm + 2 MADE 13
88 -10. 0 85 20 50 31 74 76 96 89 37 86 95 87 40 26 6 83 54 55 41 99 GC 103 63 80 102 104 77 8 58 27 17 Modified Z-Score 5. 0 2 18 99 LC 3 38 90 82 70 78 47 16 25 35 73 79 91 59 39 22 32 23 14 24 10 81 45 21 67 42 44 5 15 1 71 AAPCO 2015 -2 Deltamethrin Z-Score 25. 0 20. 0 15. 0 10. 0 -5. 0 Lab Number 14
GC-FID LC-MS LC-PDA AAPCO 2015 -3 Sulfentrazone Lab Data Summary 1. 75 1. 65 1. 45 1. 35 1. 25 1. 15 1. 05 0. 95 1 2 3 5 6 8 10 14 15 16 17 18 20 21 22 23 24 25 26 27 31 32 35 37 38 39 40 41 42 44 45 47 50 53 59 63 67 69 70 71 73 77 79 82 83 87 88 91 95 96 103 104 % Sulfentrazone Found 1. 55 Lab Number Two-Day Average Median Lower Horwitz Upper Horwitz Xm - 2 MADE Xm + 2 MADE 15
-6. 0 -8. 0 77 41 -4. 0 3 -2. 0 8 31 21 14 87 18 35 42 24 82 50 20 63 83 22 59 39 40 27 96 70 73 79 38 45 53 103 6 32 17 10 2 91 5 26 Modified Z-Score 2. 0 16 25 69 95 1 44 37 23 47 104 67 15 88 6. 0 71 AAPCO 2015 -3 Sulfentrazone Z-Score 8. 0 4. 0 0. 0 Lab Number 16
AAPCO 2015 -3 Prodiamine Lab Data Summary GC-FID LC-MS LC-PDA GC-MS 3. 40 3. 20 2. 80 2. 60 2. 40 2. 20 103 91 96 88 87 79 73 71 70 69 67 63 59 47 50 45 44 42 40 41 39 38 37 35 32 31 27 26 25 24 23 22 21 20 18 17 16 14 15 8 10 5 6 3 1. 80 2 2. 00 1 % Prodiamine Found 3. 00 Lab Number Two-Day Average Median Lower Horwitz Upper Horwitz Xm - 2 MADE Xm + 2 MADE 17
88 -6. 0 -8. 0 31 41 71 17 21 8 20 5 3 -2. 0 50 40 37 2 96 32 44 87 16 45 63 42 10 2. 0 25 47 1 91 24 67 103 15 22 59 69 79 14 70 35 18 23 38 6 73 39 Modified Z-Score 26 6. 0 27 AAPCO 2015 -3 Prodiamine Z-Score 8. 0 4. 0 0. 0 -4. 0 Lab Number 18
Lab Method Number Ref Extractant Sample Preparation Internal Standard Oven Temperature Injector Type and Temperature Detector Column 17 In House 1: 1 Acetone: Hexane Dilute, Shake None Gradients: Initial temp. 50°C Final temp. 320°C Splitless: 240°C MSD VF-5 MS, 30 m × 0. 25 mm × 0. 25µm Many In House Acetone Dilute, Sonicate, Filter. Dicyclohexyl Phthalate, 2, 4, 6 Tribromobiphenyl, Dioctyl Phthalate Isothermal: 285°C or Gradient: Initial temp. 60 – 150°C Final temp. 260 – 320°C Splitless: 250280°C or Split: Ratio: 2: 1 to 50: 1 Temp. 250 or 300°C FID MSD PE 1, 15 m × 0. 25 mm × 1. 0µm ZB-MR-1, 30 m × 0. 25 mm × 0. 25µm DB-5 MS, 30 m × 0. 32 mm × 0. 25µm DB-5, 30 m × 0. 53 mm × 1. 5µm HP-5, 30 m × 0. 32 mm × 0. 25µm HP-50, 15 m × 0. 53 mm × 1. 0µm Rtx-5, 30 m × 0. 25 mm × 0. 25µm Rtx-5 w/ IG, 30 m × 0. 32 mm × 0. 25µm Rtx-CLP, 30 m × 0. 53 mm × 0. 42µm 42 In House Acetone/Ethyl Acetate Dilute, Sonicate None Gradient: Initial temp. 160°C Final temp. 280°C Splitless: 220°C FID Rtx-5, 30 m × 0. 53 mm × 0. 5µm 5, 35 In House Acetonitrile Dilute, Sonicate None Gradient: Initial temp. 180°C Final temp. 260 – 320°C Splitless: 140°C or Split: Ratio: 5: 1 Temp. 230°C FID DB-1701 P, 30 m × 0. 53 mm × 1. 0µm Rxi-1 MS, 30 m × 0. 32 mm × 0. 25µm 27, 67, 96 In House Ethyl Acetate Dilute, Sonicate, Filter Chrysene D 12 Gradient: Initial temp. 55 – 80°C Final temp. 280 – 315°C Splitless: 250°C or Split: Ratio: 5: 1 or 15: 1 Temp. 45 or 250°C FID DB-5 MS, 30 m × 0. 25 mm × 0. 25µm Rtx-5 MS, 30 m × 0. 25 mm × 0. 25µm HP-5 MS, 30 m × 0. 25 mm × 0. 25µm 19
STATISTICAL ANALYSIS Data was compiled from each of participating labs and analyzed according to the following criteria: Robust Mean v Robust Estimate of Standard Deviation v Z-score v Outlier Determination v 20
ROBUST MEAN AND ESTIMATE OF STANDARD DEVIATION v A robust estimator of the mean was used in order to deal with outlying data points without removing them from the sample set. The robust estimator of the mean used was the median. v The robust estimate of the standard deviation used was the MADE value. 21
Z-SCORE AND OUTLIERS Modified Z-score for each laboratory was calculated as follows: Outlier: Zi < -3. 5 or Zi > 3. 5 22