
2013 Pearson Jobs and Unemployment 22 CHECKPOINTS 2013

© 2013 Pearson
Jobs and Unemployment 22 CHECKPOINTS © 2013 Pearson
Click on the button to go to the problem Checkpoint 22. 1 Checkpoint 22. 2 Checkpoint 22. 3 Problem 1 Clicker version Problem 1 Problem 2 Clicker version Problem 2 In the news 1 In the news 2 In the news
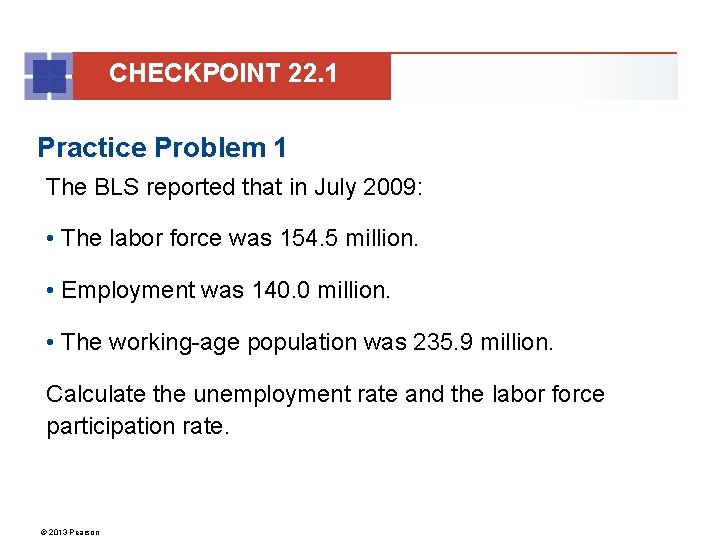
CHECKPOINT 22. 1 Practice Problem 1 The BLS reported that in July 2009: • The labor force was 154. 5 million. • Employment was 140. 0 million. • The working-age population was 235. 9 million. Calculate the unemployment rate and the labor force participation rate. © 2013 Pearson
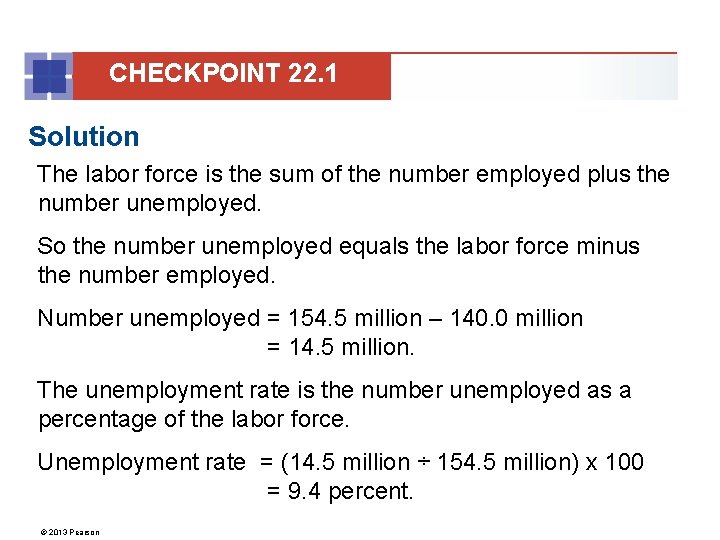
CHECKPOINT 22. 1 Solution The labor force is the sum of the number employed plus the number unemployed. So the number unemployed equals the labor force minus the number employed. Number unemployed = 154. 5 million – 140. 0 million = 14. 5 million. The unemployment rate is the number unemployed as a percentage of the labor force. Unemployment rate = (14. 5 million ÷ 154. 5 million) x 100 = 9. 4 percent. © 2013 Pearson
CHECKPOINT 22. 1 The labor force participation rate is the percentage of the working-age population who are in the labor force. That is, labor force participation rate equals (154. 5 million ÷ 235. 9 million) x 100. Labor force participation rate is 65. 5 percent. © 2013 Pearson
CHECKPOINT 22. 1 Practice Problem 2 The BLS reported that in July 2009, the labor force was 154. 5 million, employment was 140. 0 million, and the working-age population was 235. 9 million. The BLS also reported that 24 percent of all employment in July 2009 was part time and that 9. 1 million people worked part time for economic reasons. How many people worked part time for noneconomic reasons? © 2013 Pearson
CHECKPOINT 22. 1 Solution Part-time workers are divided into two groups: part time for economic reasons and part time for noneconomic reasons. Employment was 140 million. Part-time employment was 24 percent of 140 million, which equals 33. 6 million. Given that 9. 1 million people worked part time for economic reasons, 33. 6 million minus 9. 1 million, or 24. 5 million people worked part time for noneconomic reasons. © 2013 Pearson
CHECKPOINT 22. 1 In the news Summar 2011 youth labour market From April to July 2011, the number of employed youth 16 to 24 years old rose by 1. 7 million to 18. 6 million. Unemployment of youth increased from 3. 4 million to 4. 1 million. In July, the youth labor force grew by 2. 4 million to a total of 22. 7 million and the youth population was 38 million. Source: BLS Press Release, August 24, 2011 How did the youth unemployment rate change from April to July? Calculate the youth labor force participation rate in July. © 2013 Pearson
CHECKPOINT 22. 1 Solution Unemployment rate = (Unemployment ÷ Labor force) x 100 The April labor force equals the July labor force (22. 7 million) minus the growth of 2. 4 million from April to July. That is, the April labor force was 20. 3 million. In April, 3. 4 million youths were unemployed, so the April unemployment rate was (3. 4 ÷ 20. 3) x 100, or 16. 7 percent. In July, 4. 1 million youths were unemployed and the labor force was 22. 7 million, so the unemployment rate was 18. 1 percent. © 2013 Pearson
CHECKPOINT 22. 1 From April to July, the unemployment rate rose from 16. 7 percent to 18. 1 percent. The labor force participation rate equals the labor force (22. 7 million) as a percentage of the population (38 million), which was 59. 7 percent. © 2013 Pearson
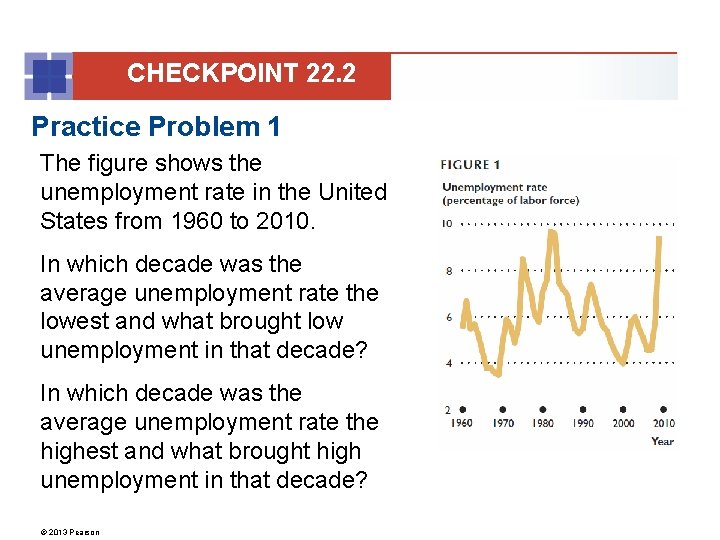
CHECKPOINT 22. 2 Practice Problem 1 The figure shows the unemployment rate in the United States from 1960 to 2010. In which decade was the average unemployment rate the lowest and what brought low unemployment in that decade? In which decade was the average unemployment rate the highest and what brought high unemployment in that decade? © 2013 Pearson
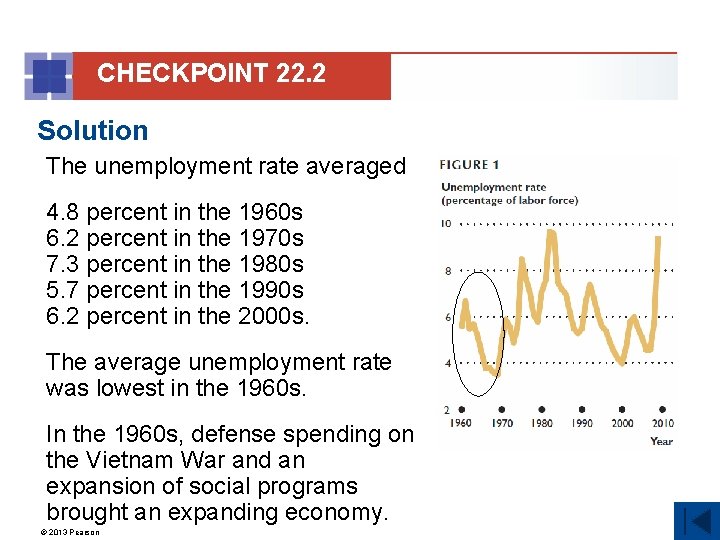
CHECKPOINT 22. 2 Solution The unemployment rate averaged 4. 8 percent in the 1960 s 6. 2 percent in the 1970 s 7. 3 percent in the 1980 s 5. 7 percent in the 1990 s 6. 2 percent in the 2000 s. The average unemployment rate was lowest in the 1960 s. In the 1960 s, defense spending on the Vietnam War and an expansion of social programs brought an expanding economy. © 2013 Pearson
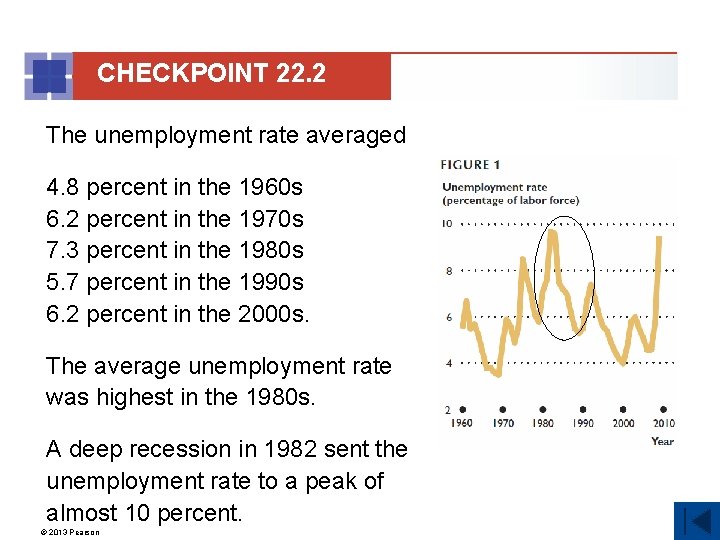
CHECKPOINT 22. 2 The unemployment rate averaged 4. 8 percent in the 1960 s 6. 2 percent in the 1970 s 7. 3 percent in the 1980 s 5. 7 percent in the 1990 s 6. 2 percent in the 2000 s. The average unemployment rate was highest in the 1980 s. A deep recession in 1982 sent the unemployment rate to a peak of almost 10 percent. © 2013 Pearson
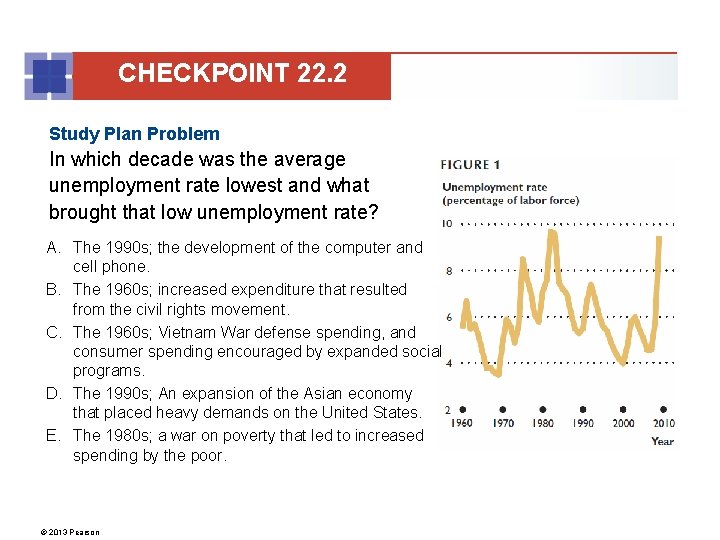
CHECKPOINT 22. 2 Study Plan Problem In which decade was the average unemployment rate lowest and what brought that low unemployment rate? A. The 1990 s; the development of the computer and cell phone. B. The 1960 s; increased expenditure that resulted from the civil rights movement. C. The 1960 s; Vietnam War defense spending, and consumer spending encouraged by expanded social programs. D. The 1990 s; An expansion of the Asian economy that placed heavy demands on the United States. E. The 1980 s; a war on poverty that led to increased spending by the poor. © 2013 Pearson U. S. unemployment rate
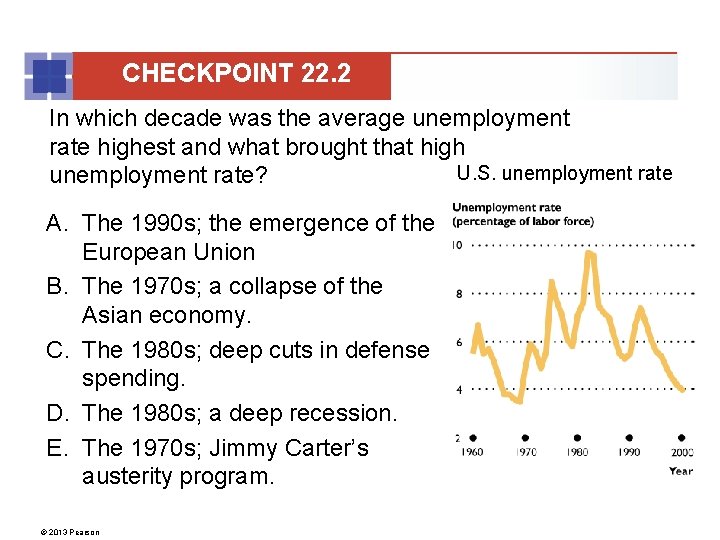
CHECKPOINT 22. 2 In which decade was the average unemployment rate highest and what brought that high U. S. unemployment rate? A. The 1990 s; the emergence of the European Union B. The 1970 s; a collapse of the Asian economy. C. The 1980 s; deep cuts in defense spending. D. The 1980 s; a deep recession. E. The 1970 s; Jimmy Carter’s austerity program. © 2013 Pearson
CHECKPOINT 22. 2 Practice Problem 2 Describe the trends in the participation rates of men and women and all workers. Why did these trends occur? © 2013 Pearson
CHECKPOINT 22. 2 Solution The participation rate of women increased because • Better-educated women earn more. • More white-collar jobs with flexible work hours were created. • People have more time for paid employment. • Families increasingly needed two incomes to balance their budgets. The participation rate of men decreased because more men remained in school and some men took early retirement. The overall participation rate increased. © 2013 Pearson
CHECKPOINT 22. 2 Study Plan Problem The labor force participation rate of women increased between 1967 and 2007 because A. technological change created more white-collar jobs that women found attractive. B. technological change in the home increased the time available for paid employment. C. families wanted a second income to balance tight budgets. D. more women completed college and could earn a higher wage rate. E. all of the above. © 2013 Pearson
CHECKPOINT 22. 2 The labor force participation rate of men decreased between 1967 and 2007 because ____ A. with enough wealth, some older men decided to retire early. B. some men lost their jobs at an age at which finding a new job was difficult, so they withdrew from the labor force. C. some younger men decided to remain in full-time education. D. all of the above © 2013 Pearson
CHECKPOINT 22. 2 In the news For young people, a jobless summer In July 2009, the youth unemployment rate hit 18. 5%—the highest level since the BLS started recording youth labor statistics. The proportion of young people working was 51. 4%, another historic low for the month of July. Source: The Wall Street Journal, August 27, 2009 1. Compare the changes in the labor force participation rate during the recessions in Table 1 (on next slide). During which recession did the labor force participation rate drop the most? © 2013 Pearson
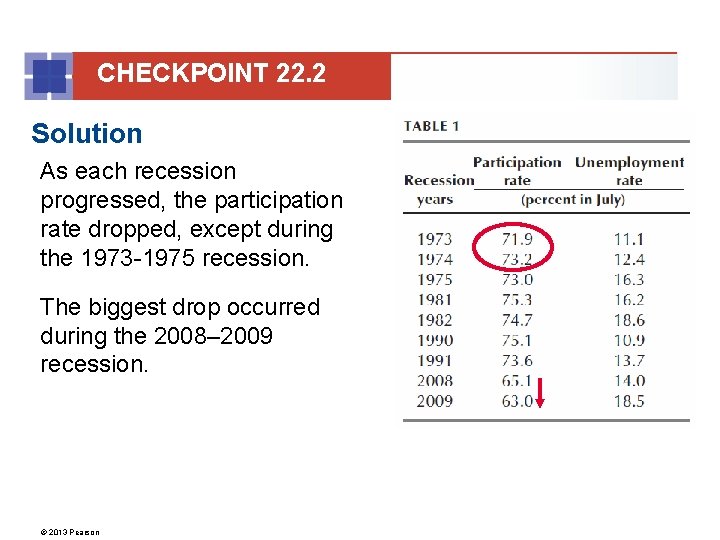
CHECKPOINT 22. 2 Solution As each recession progressed, the participation rate dropped, except during the 1973 -1975 recession. The biggest drop occurred during the 2008– 2009 recession. © 2013 Pearson
CHECKPOINT 22. 2 In the news For young people, a jobless summer July, the peak for youth summer jobs, saw the youth unemployment rate hit 18. 5% in July 2009, the highest level since the BLS started recording youth labor statistics in 1948. The participation rate of young people was 51. 4%, another historic low for the month of July. Source: The Wall Street Journal, August 27, 2009 2. Compare the changes in the unemployment rate during the recessions in Table 1 (on next slide). During which recession did the unemployment rate rise the most? © 2013 Pearson
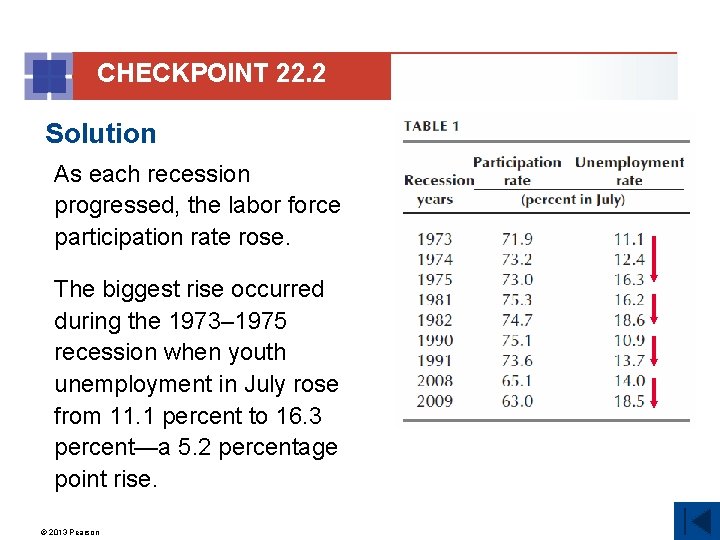
CHECKPOINT 22. 2 Solution As each recession progressed, the labor force participation rate rose. The biggest rise occurred during the 1973– 1975 recession when youth unemployment in July rose from 11. 1 percent to 16. 3 percent—a 5. 2 percentage point rise. © 2013 Pearson
CHECKPOINT 22. 3 Practice Problem 1 Recovery won’t improve unemployment Despite some optimism about the seeds of recovery, the Congressional Budget Office (CBO) sees joblessness rising. The CBO sees unemployment peaking at 10. 4% next year from an average of 9. 3% this year, before it falls to 9. 1% in 2011. Source: Fortune, August 25, 2009 As a recession begins, firms quickly make layoffs. Is this rise in unemployment mostly a rise in frictional, structural, or cyclical unemployment? © 2013 Pearson
CHECKPOINT 22. 3 Solution Before the recession began, the U. S. unemployment rate was about 6 percent. When a recession starts, firms are quick to lay off workers. Most of the rise in unemployment is cyclical—related to the state of the economy. The unemployment rate rises quickly as the number of layoffs increases. © 2013 Pearson
CHECKPOINT 22. 3 Practice Problem 2 Recovery won’t improve unemployment Despite some optimism about the seeds of recovery, the Congressional Budget Office (CBO) sees joblessness rising. The CBO sees unemployment peaking at 10. 4% next year from an average of 9. 3% this year, before it falls to 9. 1% in 2011. Source: Fortune, August 25, 2009 Why does unemployment continue to rise as an expansion begins? © 2013 Pearson
CHECKPOINT 22. 3 Solution Before the recession began, the U. S. unemployment rate was about 6 percent. The unemployment rate is a lagging indicator of the business cycle. When an expansion begins, firms start hiring. Unemployed workers get jobs, but the labor force increases as marginally attached workers start to look for jobs. In the early stages of an expansion, the number of marginally attached workers looking for jobs exceeds the number of people hired and unemployment increases. © 2013 Pearson
CHECKPOINT 22. 3 In the news Bof. A cutbacks may hit 40, 000 Bank of America officials have discussed eliminating about 40, 000 positions during the first wave of a restructuring. The numbers could change, but the restructuring would reduce the bank’s workforce over a period of years. Source: The Wall Street Journal, September 9, 2011 Postal Service targets 220, 000 job cuts The U. S. Postal Service plans to reduce its workforce by 220, 000 jobs to remedy its dire financial situation. The Postal Service, financed mostly by postage, has been struggling as a result of the economic slowdown. Source: The Wall Street Journal, September 9, 2011 © 2013 Pearson

CHECKPOINT 22. 3 Practice Problem 3 What type of unemployment will arise from the cut in employment in each of these cases? Explain your answer. © 2013 Pearson
CHECKPOINT 22. 3 Solution Bank of America is reducing its workforce as it restructures its organization in response to changing technology. Because online banking has grown, the bank will close many branches. Cuts in its workforce will create structural unemployment. The U. S. Postal Service is cutting its workforce in response to a downturn in economic activity. Cuts in its workforce will create cyclical unemployment. © 2013 Pearson
- Slides: 31