2012 WATER QUALITY BC KAREN LANCOUR National Bio
 KAREN LANCOUR National Bio Rules Committee Chairman Joyce Bock Clinton")
2012 WATER QUALITY (B&C) KAREN LANCOUR National Bio Rules Committee Chairman Joyce Bock Clinton River Watershed Council Volunteer

Event Rules – 2012 DISCLAIMER This presentation was prepared using draft rules. There may be some changes in the final copy of the rules. The rules which will be in your Coaches Manual and Student Manuals will be the official rules.

Event Rules – 2012 • BE SURE TO CHECK THE 2012 EVENT RULES FOR EVENT PARAMETERS AND TOPICS FOR EACH COMPETITION LEVEL

TRAINING MATERIALS • • • Training Power Point – content overview Training Handout – content information Sample Tournament – sample problems with key Event Supervisor Guide – prep tips, setup needs, and scoring tips Internet Resources & Training Materials – on the Science Olympiad website at www. soinc. org under Event Information A Biology-Earth Science CD and a Water Quality CD are available from SO store at www. soinc. org

EVENT COMPONENTS • Ecology Content – 2012 – Part 1 – Freshwater Ecology – Part 2 – Identify Macro-flora and fauna – Part 3 – Water Monitoring and Analysis • Process skills in data, graph and diagram analysis Process skills • Event parameters – check the event parameters in the rules for resources allowed.

Part 1: Freshwater Ecology Areas such as: – – – Freshwater Ecology Aquatic Food Chains and Webs Population Dynamics Community Interactions Nutrient Recycling Water Cycle Aquatic Chemistry and its implications for life Potable Water Treatment Waste Water Treatment Watershed Resource Management Issues Sedimentation Pollution Exotic/invasive/harmful species

General Principles of Freshwater Ecology ECOLOGY – how organisms interact with one another ECOLOGY and with their environment ENVIRONMENT – living and non-living components ENVIRONMENT • ABIOTIC – non-living component or physical factors as soil, rainfall, sunlight, temperatures • BIOTIC – living component are other organisms.

ECOLOGICAL ORGANIZATION • INDIVIDUAL – individual organisms INDIVIDUAL • POPULATION – organisms of same species in POPULATION same area (biotic factors) • COMMUNITY – several populations in same COMMUNITY area (biotic factors) • ECOSYSTEM – community plus abiotic factors ECOSYSTEM • BIOSPHERE – all ecosystems on earth BIOSPHERE

Aquatic Ecosystems Lotic ecosystems – flowing water Streams Rivers Lentic ecosystems – still water Ponds Lakes Wetlands

Watershed A watershed or drainage basin is an area of land where water from rain and melting snow or ice drains downhill into a body of water, such as a river, lake, reservoir, estuary, wetland, sea or ocean.

ECOLOGY OF INDIVIDUALS • Homeostasis – delicate balance • Components – Physiological Ecology – Temperature and Water Balance – Light and Biological Cycles – Physiological Ecology and Conservation

ECOLOGY OF POPULATIONS • • Properties of populations Patterns of distribution and density Intraspecific competition Population dynamics Growth and regulation Altering population growth Human impact

ECOLOGY OF COMMUNITIES • Closed vs. Open communities – Closed – sharp boundaries – Open – Lack boundaries • Species abundance and diversity • Trophic Structure of Communities – Food chains – Food web – Trophic pyramid

Food Chain algae mayflies stoneflies trout humans • • • Producer 1 st order Consumer or Herbivore 2 nd order Consumer or 1 st order Carnivore 3 rd order Consumer or 2 nd order Carnivore 4 th order Consumer or 3 rd order Carnivore Decomposers – consume dead and decaying matter as bacteria

Food Web

INTERACTIONS AMONG SPECIES • Interactions • Interspecific competition • Predation • Exploitation • Symbiosis

Types of Species Interactions Neutral – two species do not interact Mutualism – both benefit Commensalism – one benefits, other neutral Parasitism – one benefits, one harmed but not killed • Predation – one benefits, other killed • •

ECOLOGY OF ECOSYSTEMS • Energy Flow – Energy Flow Pyramids – Bio-mass Pyramids • Community Succession and Stability • Nutrient Recycling – nutrient cycles
 • Energy flow – one")
Energy vs Nutrient • Nutrients – cyclic (Biogeochemical Cycles) • Energy flow – one way

Ecologic Pyramids Ecological pyramid - a graph representing trophic level numbers within an ecosystem. The primary producer level is at the base of the pyramid with the consumer levels above. Numbers pyramid - compares the number of individuals in each trophic level. May be inverted due to size of individuals Biomass pyramid - compares the total dry weight of the organisms in each trophic level. Energy pyramid - compares the total amount of energy available in each trophic level. This energy is usually measured in kilocalories.

Ecological Pyramids

Biogeochemical Cycles recycles nutrients • Hydrologic Cycle • Phosphorus Cycle • Nitrogen Cycle • Carbon Cycle

Nitrogen Cycle

Phosphorus Cycle

Carbon Cycle
 Cycle")
Hydrologic (Water) Cycle

Potable Water Treatment

Sewage Treatment

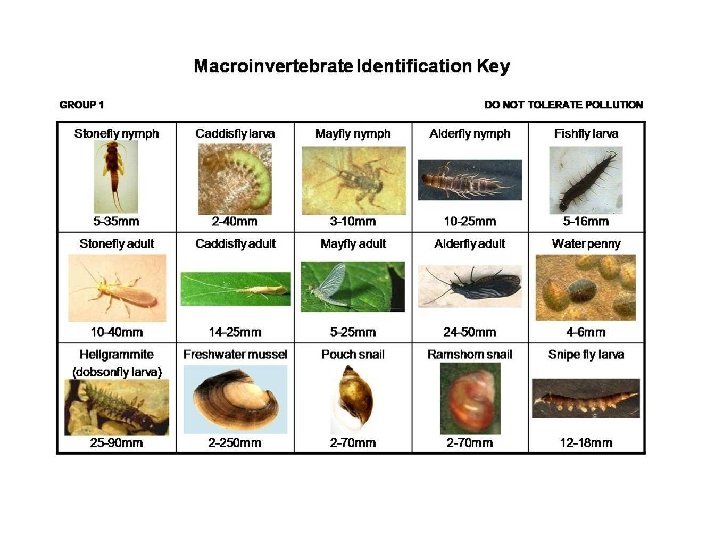
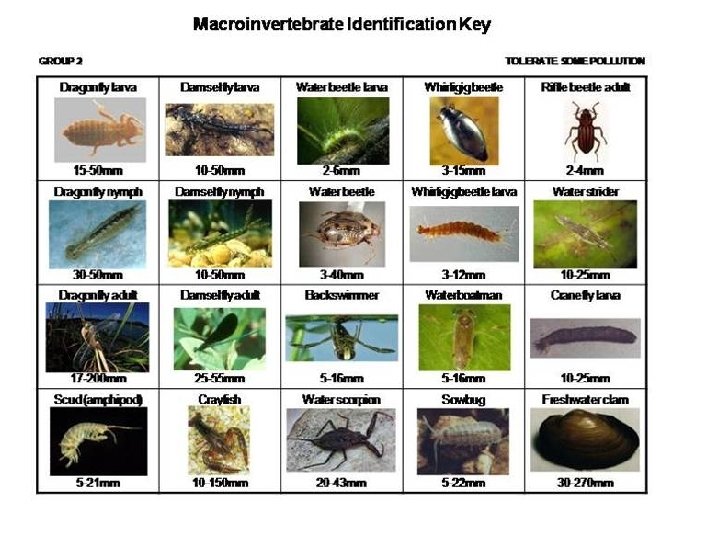
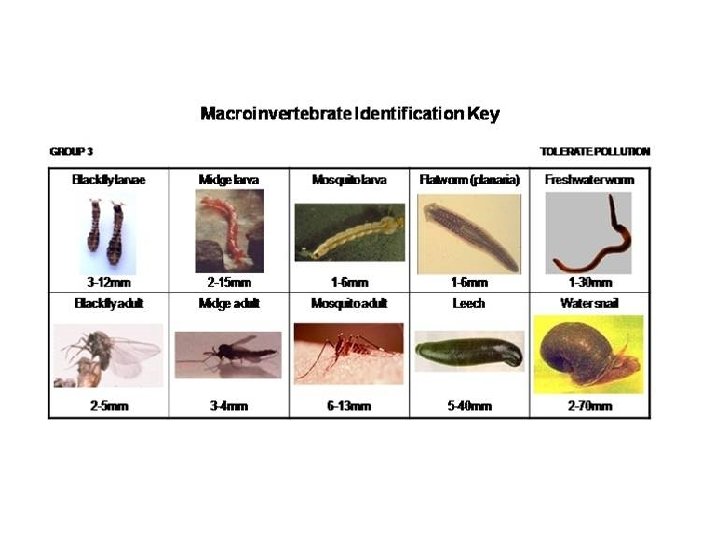
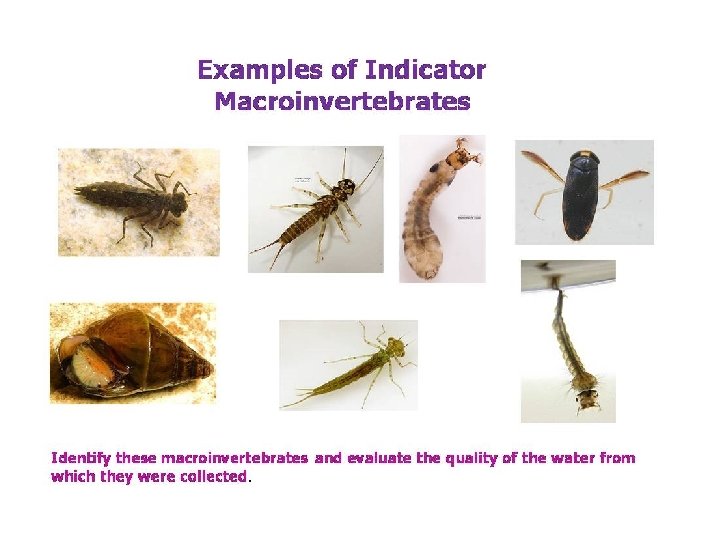
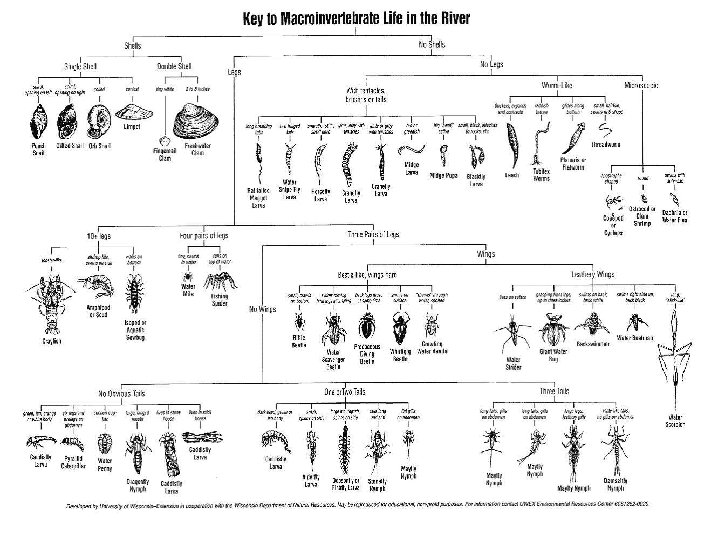
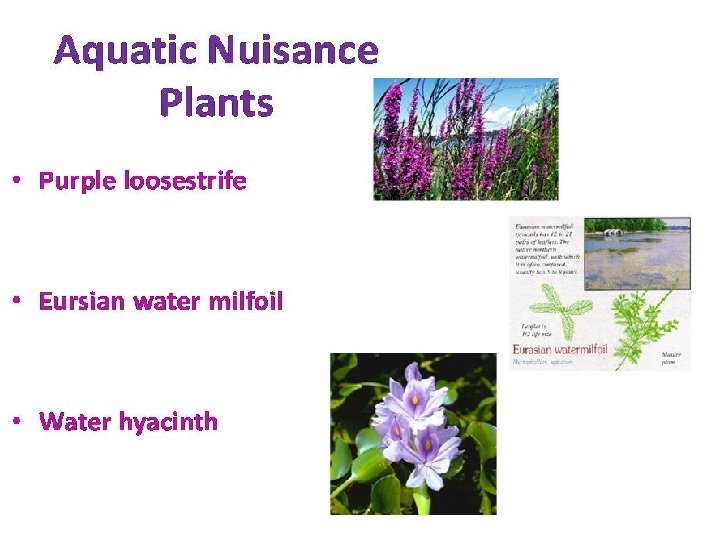
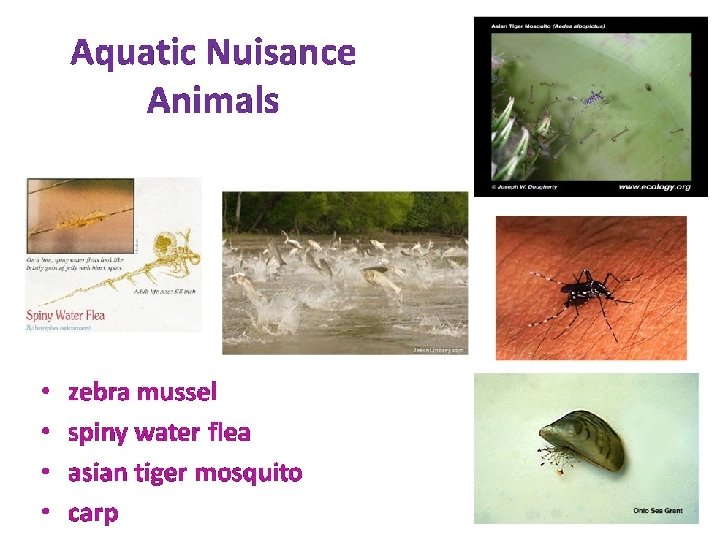
Part 2: Macro-flora and Fauna • Identify macroinvertebrates • Identify aquatic nuisance plants by their common name • Relate organisms to water and wetland quality

Indicator Species FOR Division C ONLY students will also be expected to know the general ecology, life cycles, and feeding habitats of all listed organisms Class 1 -pollution sensitive Class 2 -moderately sen. Class 3 -moderately tolerant Class 4 -pollution tol. Class 5 Air Br. Mayfly Caddisfly Stonefly Dobsonfly Gilled Snails Water Penny Riffle Beetle Water Scorpion Aquatic Sowbug Damselfly Dragonfly Scuds Crane Fly Water Mite Midge Blackfly Flatworm Leeches Air Breathing Snail Deer/Horse Fly Tubifex Mosquito Blood Midge Back Swimmer Water Boatman Predacious Diving Beetle Whirligig Beetle Water Strider Aquatic Nuisance Plants: Purple Loosestrife, Eurasian Water Milfoil and Water Hyacinth. Aquatic Nuisance Animals: Zebra Mussel; Spiny Water Flea , Asian Tiger Mosquito, and Carp Giant Water Bug

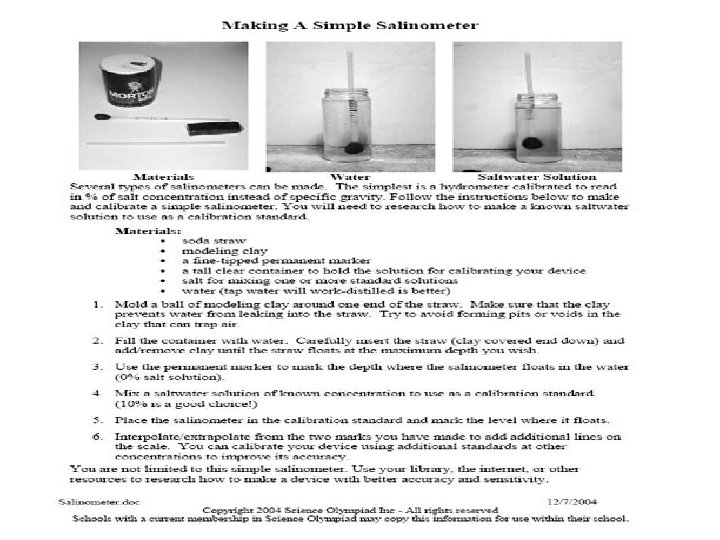
Part 3: Water Monitoring • Understand interpret data related to testing procedures and purposes for water testing (No actual testing) • Build and demonstrate a salinometer capable of testing saltwater (1 -10%)

Chemical Analysis • • • Salinity - only actual testing with salinometer p. H Phosphates Dissolved oxygen Temperature Nitrates Fecal Coliform Total solids Biochemical oxygen demand Their relationship to one another

Salinomter – Hydrometer • Salinometers / Hydrometers • Hydrometer calibrated to read in % of salt concentration • Materials – § soda straw § modeling clay § a fine-tipped permanent marker § a tall clear container to hold the solution for calibrating your device § salt for mixing one or more standard solutions § water (tap water will work-distilled is better)

Sample Analysis Using the picture below, explain all of the possible human caused problems that can occur. In addition, what types of chemical testing would you perform to confirm your suspicions?
- Slides: 42