20100427 data 1 MPR data Courtesy of Dr


")


 Low RH, likely strato O 3 25")


 37")


- Slides: 65
2010/04/27 data 1
MPR data, Courtesy of Dr. Kevin Knupp 2
Cloud 318 No data 302 3
Note this high Almost cutoff low 4
NAM RH, pressure-time cross section above HSV 12 Z 4/26 ~ 00 Z 4/30, 100 -1000 hpa Note the starting time lat: 34. 73, long: -86. 65 http: //nomads. ncdc. noaa. gov/ 5
NAM wind speed above HSV 60 m/s=216 km/hour The direction of the axis is north-south. Subtropical jet 6
Nov. 4, 2010 case 7
11/3 11/5 11/4 11/6 8
9
10
1. Comparison of the CMAQ ozone simulation and the lidar measurement for a STE event CMAQ O 3 The CMAQ model is able to capture most of the tropospheric ozone variability caused by this STE event [manuscript in prep. , Arastoo et al. ] and simulates extremely well the subsiding tongueshaped ozone layer. Lidar O 3 Sonde
12
Low PBL O 3 due to the precipitation on 11/3 and 4, 298 There high RH looks wrong Also, these should be much lower (<5%), possibly interfered by the high RH at lower alt. 13
No high surface ozone, here the high index (e. g. , later than 11/9) is due to PM, not ozone (check ‘ozone peak and ‘Particle peak’) 14
11/3 11/5 300 hpa 12 Z http: //www. spc. nssl. noaa. gov/obswx/maps 11/4 11/6 15
16
17
18
19
RH and isotachs 20
Note the very broad low RH, different with other cases 21
http: //cimss. ssec. wisc. edu/mesoscale_winds/archive/05 Nov 10/ 22
Apr. 5, 2011 case 23
3/31 GOME Apr. 2 ozonesonde 4/1 GOME tropopause 24
Sonde 4/2 sonde 4/5 sonde (lower tropopause) Low RH, likely strato O 3 25
3/26 sonde 4/2 sonde 3/26 RH has problem. 4/5 sonde 4/9 sonde 26
27
Guess Sunrise ~6: 30 LT Sunset ~19: 15 LT Also strato O 3 FT-to-PBL transport after sunset EPA Daily surface max 11 increase is a evidence of STE influence on surface? 52 ppbv 63 ppbv 28
GOME total ozone 4/5 GOME 4/6 GOME 29
OMI http: //toms. gsfc. nasa. gov/ozone_v 8. html OMI can be also downloaded here http: //www. temis. nl/protocols/o 3 col_menu_omi. php? Year=2011&Month=04&Day=03 30
31
4/3 4/5 300 hpa 12 Z 4/4 4/6 32
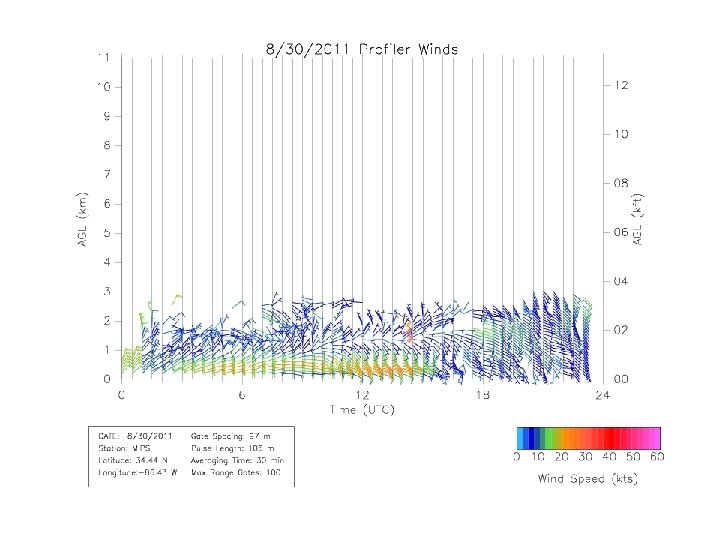
500 -hpa contour 4/5 12: 00 UTC 4/6 12: 00 UTC 33
34
4/5 12 Z 35
Profiler showing the jet 36
Profiler (no 4/7 data) 37
38
39
Cold front pass STE air SI May reach ground 298 Rain 40
41
4/4 4/6 4/5 Rain 4/7 42
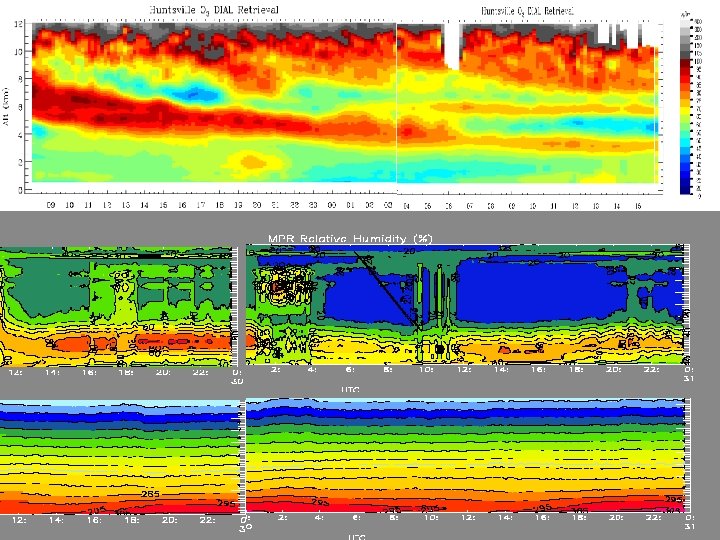
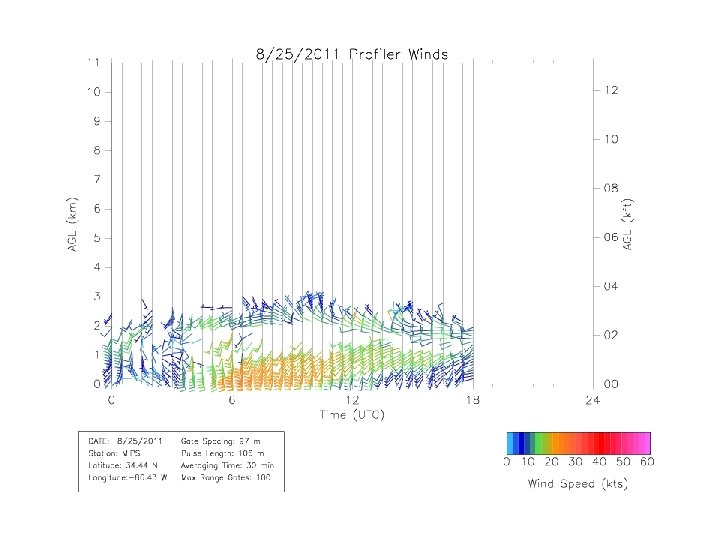
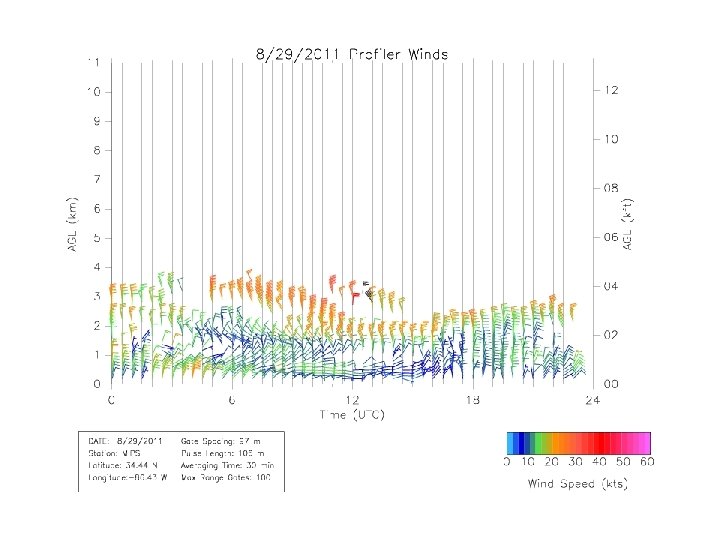
2011 8/29 STE 43
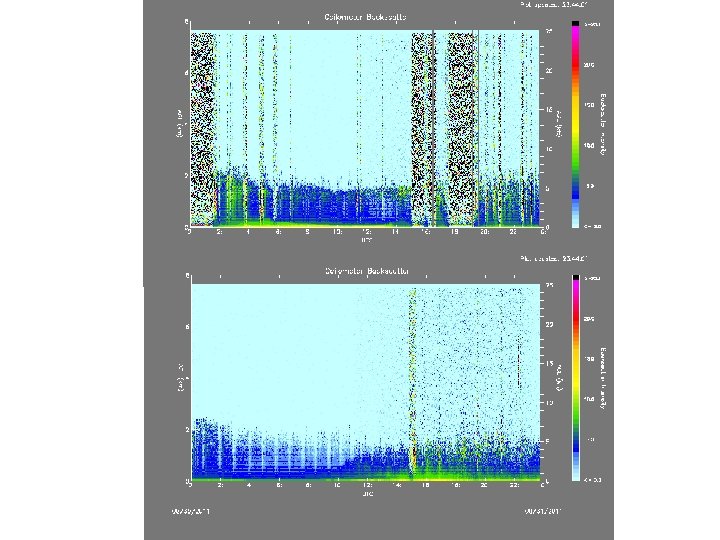
8/20 and 8/27 sonde Note there is no ceilometer data for 8/25 26 ozone curtain.
Should be summer, not autumn The summer theta for STT is higher, averagely peaked at 315~330 K, see Wernli 2002. 326 314 318
Low tropopause, STE before the lidar observation 49
2011/9/30 53
54
55
2012/1/4 data 56
57
Low WV, SI 58
2012/4/6 -7 data 59
318 302 60
Intrusion is here 61
2012/4/23 -25 data 62
Note, very likely the MPR is not able to retrieve the low tropopause, also based on the 10/04/27 case 63
2012/5/10 data 64
have 5/11 data A little close to summer, so tropopause theta is high 318 65