2010 NASCSP Mid Winter Conference February 26 2010

2010 NASCSP Mid Winter Conference February 26, 2010

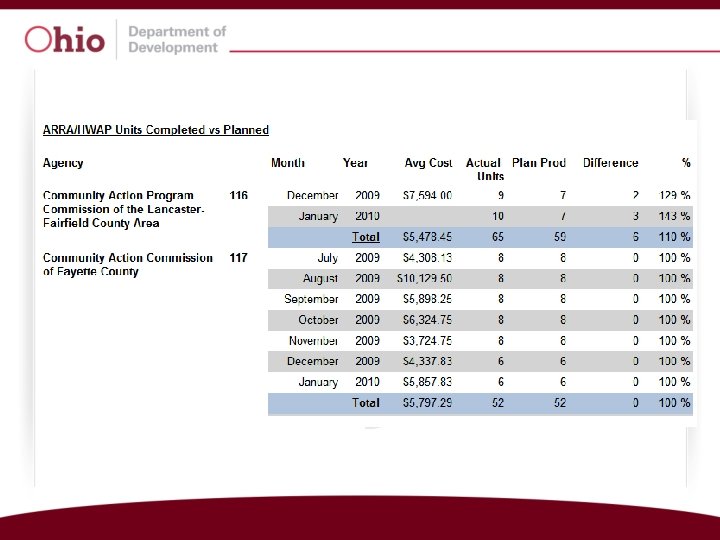
ARRA Unit Goals • We use Share. Point as an Intranet site to track HWAP activity

Statewide HWAP ARRA Production July August September October November December 958 units completed 1088 units completed 1185 units completed 1140 units completed 1226 units completed 1124 units completed Total Units Completed = 6721 (98%) Planned Units for the Period = 6841

Single, Mobile, Multi Breakout Of the 6721 units completed Single Family - 3752 Mobile Homes - 1712 Multi-Family - 1257

Current Average Cost per Unit Impact on Production Correcting the first 21 month ARRA production with the current average cost per unit yields the following: Current Average Cost per Unit = $5226. 31 @ $6500/unit First 80% ARRA = 24, 517 units @ $5226. 31/unit 30, 492 units State Wide Average Monthly Production Since July 09 = 1153 units • 1153 units x 21 months = 24, 213 units • 30, 492 – 6721 = 23, 771 units to be completed in 14 months • 23, 771 / 14 = 1698 units / month

PY 2011 Production Scenarios @ $6500/unit 4 -1 -2011 to 3 -31 -2012 Scenario #1 Total PY 11 Formula Units with no additional HHS • 19 m HHS pass thru from PY 10 • 41 m total DOE Formula PY 09, 10 & 11 6601 units Scenario #2 Total PY 11 Formula Units with 14 m HHS (7. 5%) • 33 m HHS (14 m + 19 m from PY 10) • 41 m total DOE Formula PY 09, 10 & 11 8249 units Scenario #3 Total PY 11 Formula Units with 28 m HHS (15%) • 47 m HHS (28 m + 19 m from PY 10) • 41 m total DOE Formula PY 09, 10 & 11 9897 units Units for the Second Wave of ARRA (Final 20%) 7662 units

Total Formula and ARRA Units for PY 2011 4 -1 -2011 to 3 -31 -2012 Scenario #1 + Final 20% ARRA 6601+7662 = 14, 263 units Scenario #2 + Final 20% ARRA 8249+7662 = 15, 911 units Scenario #3 + Final 20% ARRA 9897+7662 = 17, 559 units State Wide Average Monthly Production Since July 09 = 1153 units • 1153 units x 12 months = 13, 836 units per year

Current Average Cost per Unit Impact on PY 2011 Production Correcting the PY 11 production scenarios with the current average cost per unit yields the following: Current Average Cost per Unit = $5226. 31 @ $6500/unit @ $5226. 31/unit Scenario #1 = 14, 263 units 17, 739 units (1479/month) Scenario #2 = 15, 911 units 19, 789 units (1649/month) Scenario #3 = 17, 559 units 21, 838 units (1820/month)

What are we Doing • Quarterly HWAP provider meetings • Getting the message out that we need to continue ramping up to meet our production goals and spend the money • Giving the providers tools to calculate production based on their average unit cost • Keeping the lines of communication open so we can help providers resolve issues • Monitoring and T&TA
- Slides: 10