
2008 Elementary School Feeder Pattern Committee Appoquinimink School


- Slides: 18
2008 Elementary School Feeder Pattern Committee Appoquinimink School District May 13, 2008
Schedule of Reports April 8: May 13: Board Report Board First Reading: Town Meetings: May 27: Townsend Elementary (6: 30 p) May 28: New Covenant Presbyterian Church (1125 Jamison Corner Road, 10: 00 a) May 28: Cedar Lane Elementary (6: 30 p) June 10: May 13, 2008 Board Second Reading: 2
Members Parents: Dr. Nemish Mehta (OBL) Kris Baxter (CLE) Karen Hopkins (SLE) Jeffory Gibeault (BME*) Michele Frayler (TES) Building Administrators: Lorraine Lybarger/Shevena Cale Donna K. /Rebecca Feathers Sharon Pepukayi/Cyndi Clay Don Davis Lucia Weathers District Administration: Gregg Tulowitzky (chairperson) Data Support: Chuck Longfellow, Sandy Joswick, Andy Woitko University of Delaware: John Laznik, Center for Applied Demography and Survey Research May 13, 2008 3
Factors to Consider • Balanced enrollment in grade-level schools, anticipating growth • Students would remain with others from their community to attend the school nearest their community • Equitable distribution of students based on “socio-economic” status (Free/Reduced Lunch) • Equitable distribution of students based on ethnicity May 13, 2008 4
Dangers To Avoid (if possible) • Moving one border community back and forth between schools in successive redistricting plans. (within 5 years) • Students assigned to a school and would drive by a same grade-level school. May 13, 2008 5
Services Utilized • Technology Management and Design (Department of Education, Don Berry) • Arc. GIS Software (University of Delaware, John Laznik) • e. School (DOE) • Trapeze Redistricting Software (Tulowitzky) May 13, 2008 6
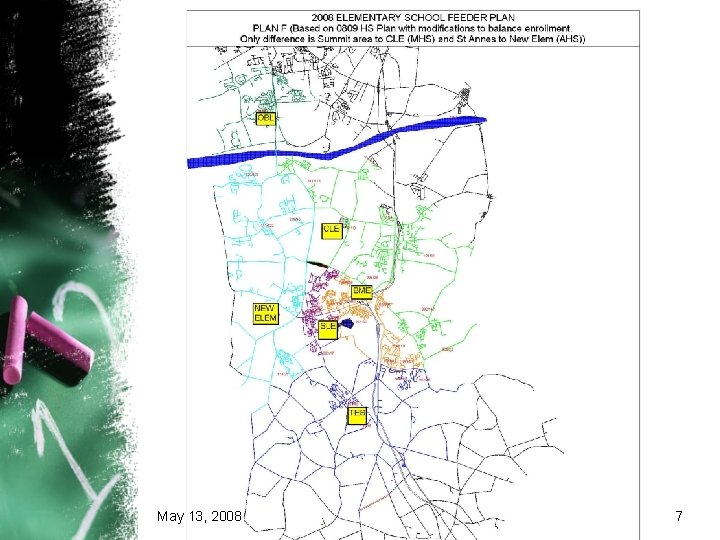
May 13, 2008 7
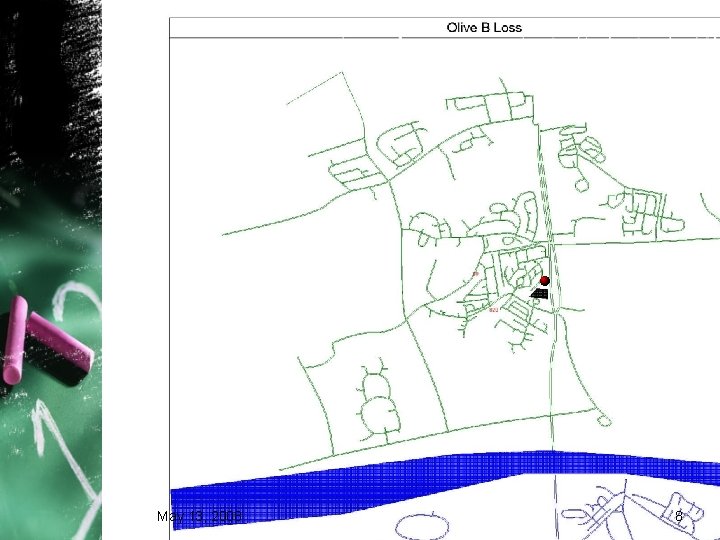
May 13, 2008 8
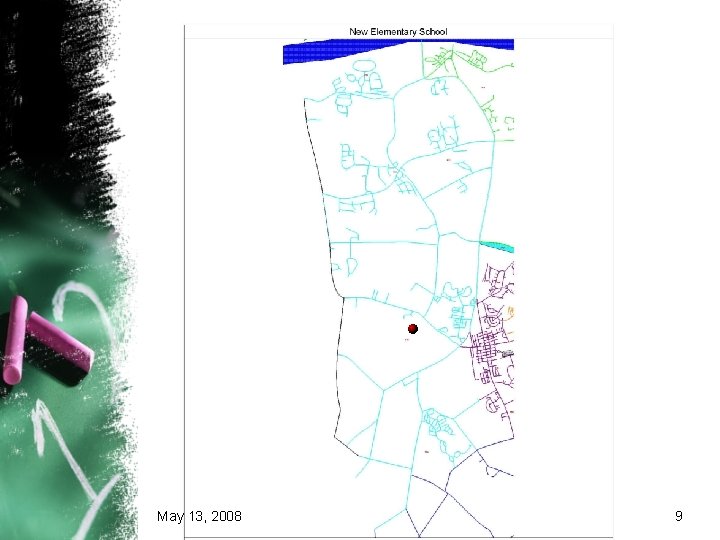
May 13, 2008 9
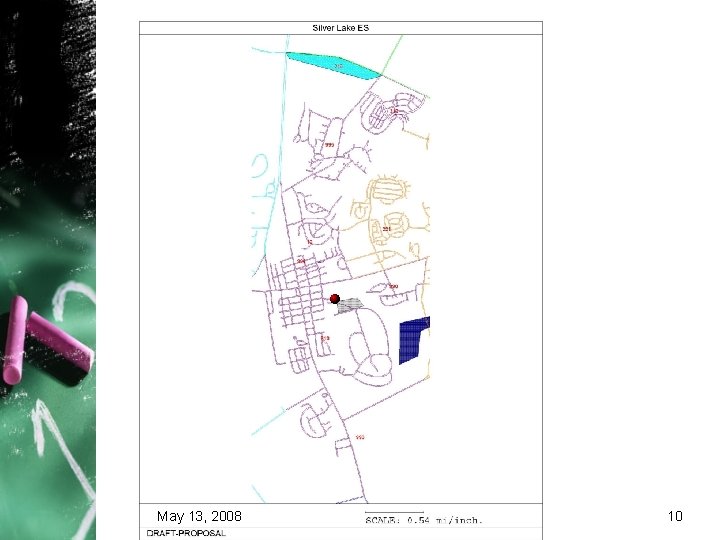
May 13, 2008 10
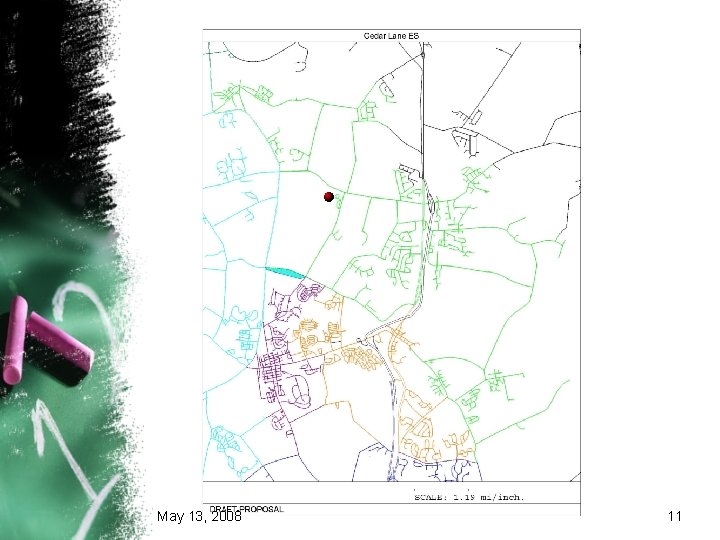
May 13, 2008 11
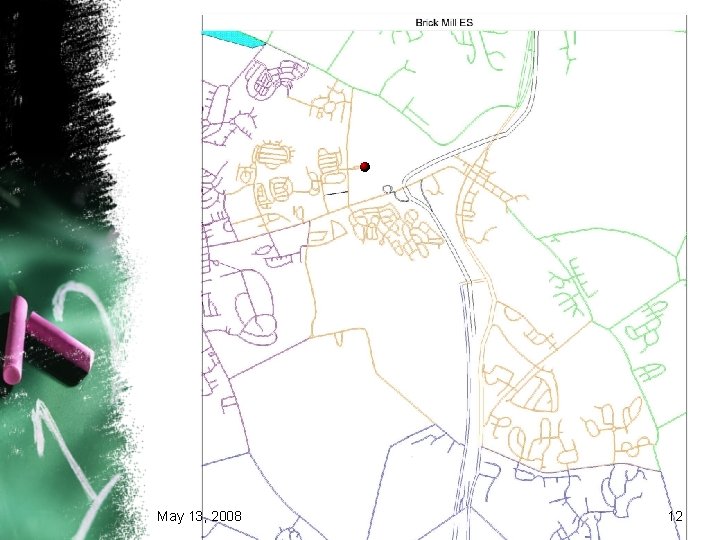
May 13, 2008 12
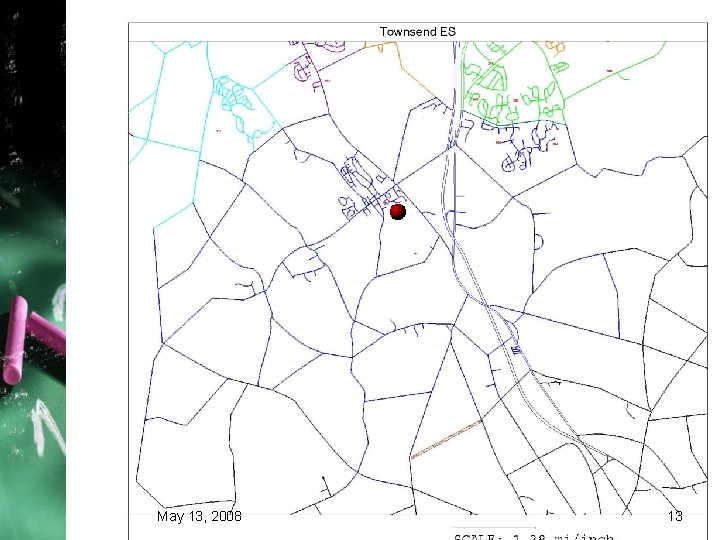
May 13, 2008 13
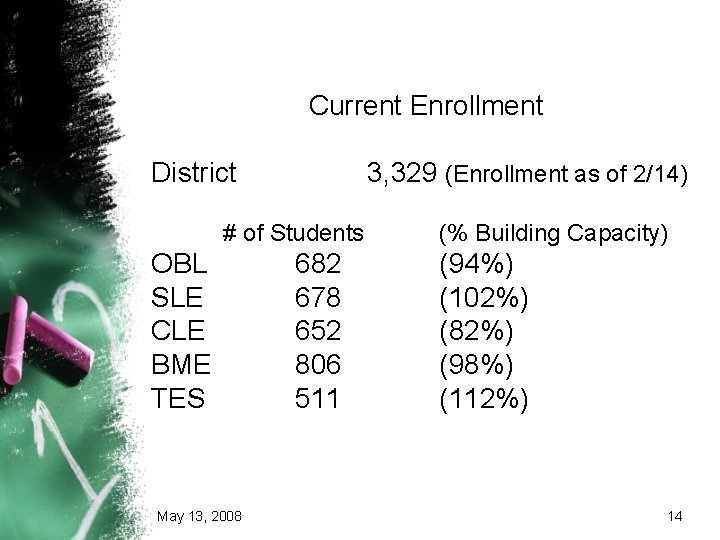
Current Enrollment District 3, 329 (Enrollment as of 2/14) # of Students OBL SLE CLE BME TES May 13, 2008 682 678 652 806 511 (% Building Capacity) (94%) (102%) (82%) (98%) (112%) 14
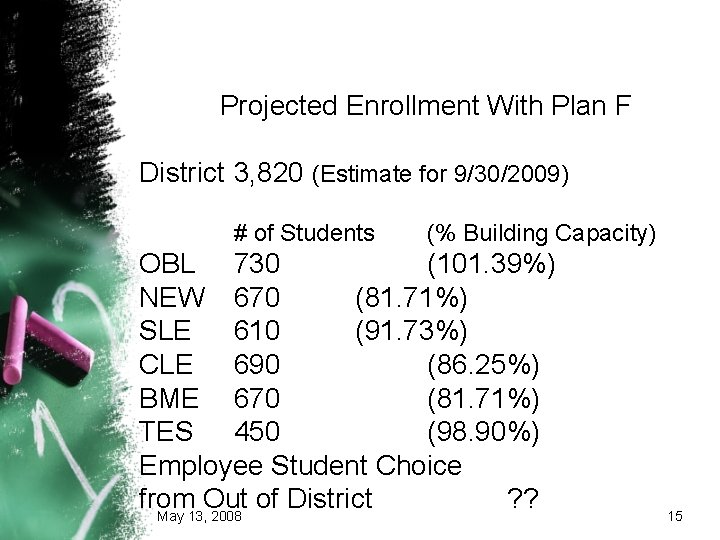
Projected Enrollment With Plan F District 3, 820 (Estimate for 9/30/2009) # of Students (% Building Capacity) OBL 730 (101. 39%) NEW 670 (81. 71%) SLE 610 (91. 73%) CLE 690 (86. 25%) BME 670 (81. 71%) TES 450 (98. 90%) Employee Student Choice from Out of District ? ? May 13, 2008 15
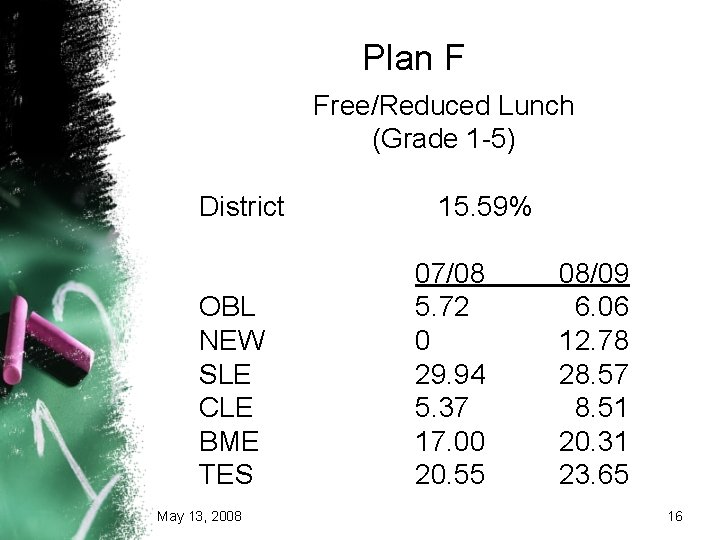
Plan F Free/Reduced Lunch (Grade 1 -5) District OBL NEW SLE CLE BME TES May 13, 2008 15. 59% 07/08 5. 72 0 29. 94 5. 37 17. 00 20. 55 08/09 6. 06 12. 78 28. 57 8. 51 20. 31 23. 65 16
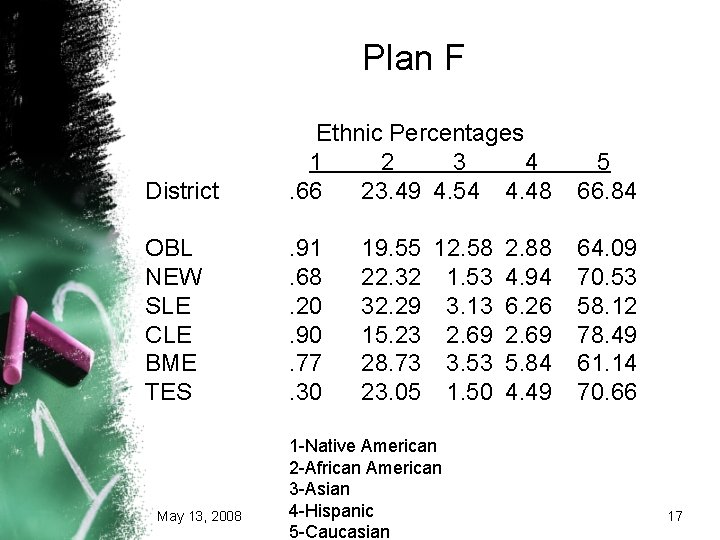
Plan F District Ethnic Percentages 1 2 3 4. 66 23. 49 4. 54 4. 48 5 66. 84 OBL NEW SLE CLE BME TES . 91. 68. 20. 90. 77. 30 64. 09 70. 53 58. 12 78. 49 61. 14 70. 66 May 13, 2008 19. 55 12. 58 2. 88 22. 32 1. 53 4. 94 32. 29 3. 13 6. 26 15. 23 2. 69 28. 73 3. 53 5. 84 23. 05 1. 50 4. 49 1 -Native American 2 -African American 3 -Asian 4 -Hispanic 5 -Caucasian 17
Questions? ? May 13, 2008