2006 General Plan Supplemental to Frequently Asked Questions
")

 153, 233")
 n Regional Housing Needs Assessment n n n 2003")

 $60, 800 Median Housing Cost (2004) $565, 000")
 n Very Low <50% of the County’s")
 n Pajaro, Castroville, Boronda, Chualar, Fort Ord")

 n n 1, 306, 929 Ac")

 n Concurrency/Fair Share n All infrastructure (e. g. sewer,")

 n LOS C n Carmel Valley and Cachagua n Stable")
- Slides: 15
2006 General Plan Supplemental to Frequently Asked Questions (FAQs)
2006 GP FRAMEWORK General Plan n n Mandatory Elements n n Optional Elements n n Land Use, Circulation, Conservation/Open Space, Safety (Noise), Public Services Agriculture, Economic Development Housing Element n 2003 -2008 (Adopted November 2003) Planning Areas n n Area Plans n n Master Plans n n Cachagua, Central Salinas Valley, Greater Monterey Peninsula, Great Salinas, North County, South County, Toro Carmel Valley, Fort Ord Agricultural Winery Corridor Plan n Toro, Central Salinas, South County
POPULATION/HOUSING OVERVIEW YEAR POPULATION HOUSING UNITS COUNTY CITIES 1970 94, 217 (38%) 153, 233 (62%)* 25, 551 (34%) 50, 243* (66%) 1980 84, 497 (29. 1%) 205, 947 (70. 9%) 30, 551 (30%) 73, 006* (70%) 1990 94, 254 (26. 5%) 261, 406 (74. 5%) 35, 169 (29%) 86, 005*(71%) 2000 100, 252 (25%) 301, 504 (75%) 37, 139 (28. 2%) 94, 569 (71. 8%) COUNTY CITIES 2030 -AMBAG TOTAL 135, 375 (22. 5%) 467, 356 (77. 5%) 48, 670 (26%) 138, 331 (74%) 2030 -CHANGE +35, 123 people +165, 852 people +11, 531 units +43, 762 units PROJECTION * Census for these periods does not include separate numbers for cities of Sand City or Del Rey Oaks.
HOUSING NEEDS ASSESSMENT (Through 2008) n Regional Housing Needs Assessment n n n 2003 -2008 RHNA Allocation n 3, 925 units Target 2, 511 adjusted to account for projects approved between allocation and approval date. n 145 Market Rate n 2, 366 Below Market-rate Last 20 Years Below Market-rate n n Established by AMBAG 5 -Year Planning Periods (cycles) 1, 300 units created Special Needs (2003 Housing Element) n n n Overcrowded (4, 179 units/12. 4%) Elderly (8, 525/25%) Disabled (28, 856 persons) Single Parent (11, 224 households) Farmworker (72, 258 -128, 584 in peak season) Homeless (2, 681 -3, 461 daily)
HOUSING STRATEGY 2002 -2008 Planning Cycle Adopted Housing Element 2009 -2014 Planning Cycle 2015 -2020 Planning Cycle 2021 -2026 Planning Cycle RHNA Estimate 2006 General Plan Regional Housing Needs Assessment (RHNA) 2, 511 units (adjusted from 3, 925 total): - 821 very low income - 608 low income - 937 moderate income - 145 above moderate income Estimate 3, 900 additional units for 2009 -2014 planning cycle Estimate 3, 900 additional units for 2015 -2020 planning cycle Estimate 3, 900 additional units for 2021 -2026 planning cycle 15, 625 units Total 2006 General Plan (GPU) Target Locations to meet RHNA Community Areas= Rural Centers= Vacant Lots= Total= Fort Ord - East Garrison I Rancho San Juan Castroville Boronda Rural Centers (affordable projects) Some Vacant Lots Fort Ord – East Garrison II Pajaro Chualar (350 acres) San Lucas Rural Centers (affordable projects) Some Vacant Lots Part of Rural Centers Some Vacant Lots Remaining Rural Centers Some Vacant Lots Total is average between AMBAG and RHNA projections. 8, 431 1, 693 3, 469 13, 593*
AFFODABLE HOUSING LIMITS/NEEDS Median Income (2004) $60, 800 Median Housing Cost (2004) $565, 000 QUALIFYING INCOME Affordable Housing Costs / Rent (3 Bedroom) Family of 2 (2004) 2002 RHNA Housing Element * Very Low $104, 211/$760 $30, 400 $24, 300 963 821 20+ du/Ac Low $145, 861/$912 $48, 650 $38, 900 813 608 15 -20 du/Ac Moderate $267, 554/$1, 216 $72, 950 $58, 350 1, 028 937 10 -15 du/Ac Workforce I $340, 341/$2, 127 $85, 100 $68, 100 n/a 5 -10 du/Ac Workforce II $437, 725/$2, 736 $109, 450 $87, 550 n/a Upper Income n/a n/a 1, 121 145 3, 925 2, 511* * Adjusted RHNA to account for projects approved between allocation and approval of Housing Element HOUSING NEEDS Housing Cost by Design/Density (du/Ac) 1 -5 du/Ac
AFFORDABLE HOUSING STANDARDS n Inclusionary (State Standard) n Very Low <50% of the County’s median income n Low n 51 -80% of the County’s median income n Moderate n 81 -120% of the County’s median income n Workforce (County Standard) n Workforce I n 121 -150% of the County’s median income n Workforce II n 151 -180% of the County’s median income n
AFFORDABLE HOUSING REQUIREMENTS/POLICY Redevelopment Areas (State Law) n Pajaro, Castroville, Boronda, Chualar, Fort Ord n Resale restriction for minimum 45 years n Rental Restriction for 55 years n County Ordinance n n Minimum 20% Inclusionary Permanent Deed Restriction Community Areas n LU-2. 22; Diversity of Housing Types n LU-2. 25; Affordable Housing consistent with density criteria in Policy H-6. 1 of the Housing Element n n Rural Centers n Policy LU-2. 12 = 35% n n n Also note HE Policies H-3. b, H-4. 2, H-4. 3 25% Inclusionary 10% Workforce Outside Community Areas and Rural Centers n Policy LU-2. 12 - 50% n n 30% Inclusionary 20% Workforce
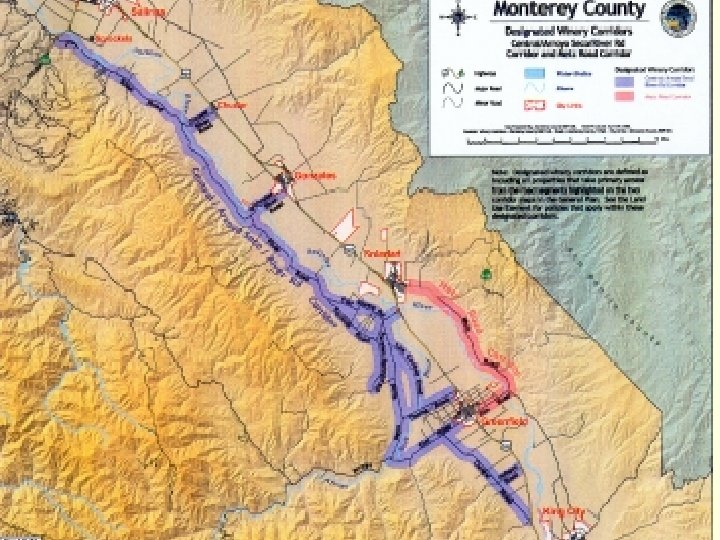
WINERY CORRIDOR Segments of Corridor: n River Road/Arroyo Seco/Central Avenue n Metz Road n Jolon Road n AWCP Components n Artisan Wineries (40) n Lot Size (5 -10 Ac) n n n Comply with Zoning density Design Guidelines Review Process Infrastructure Financing RIVER ROAD & METZ ROAD Chualar Gonzales Soledad Greenfield King City JOLON ROAD
AGRICULTURE n Agricultural Lands in Monterey County (2005) n n 1, 306, 929 Ac (61. 6%) Ag Land Protections n Williamson Act Contract (2005) n Ag Conservation Easements n n n 12, 252 acres (Mont Co Ag Conservancy) Conversion n n Since 1982 (past 27 years) - 1, 150 acres of Ag land converted to non-Ag uses Since 1992 (past 17 years) - 6, 084 acres of Ag land converted to non-Ag uses n n Most conversion resulted from changes to city boundaries (sphere of influence, annexation). GP 2006 (next 25 years) - anticipates conversion of 5, 497 acres (2% of prime farmland) n n 728, 336 acres Large portion is related to City sphere amendments and annexations. 2006 GP Policy n n Ag Buffers Promote Ability to Retain and Expand Ag Industry n n n Routine and On-Going Ag Operations Agricultural Winery Corridor Improve Regional Transportation System WILLIAMSON ACT LANDS
1982 CITIES Farmlands COMMUNITY AREAS RURAL CENTERS * GENERAL LOCATION Grazing NOTE: Illustration of population center in relation to Agricultural lands.
INFRASTRUCTURE POLICIES (2006 GP ) n Concurrency/Fair Share n All infrastructure (e. g. sewer, water, drainage, etc) improvements must be constructed as part of new development. n Off-site road improvements must either be concurrent or through a fairshare payment. n Adequate Public Facilities and Service (APFS) n Stringent standards for water quality, wastewater management and groundwater protection. n Requirements regarding long term water supply that address the quality of the water and the amount of water that would be permanently available. n More stringent service standards for new development in Community Areas and Rural Centers to ensure adequate response times for police and fire departments. n Technical, Managerial, and Financial capabilities (TMF) n Proof of ability to develop and properly maintain APFS
TRAFFIC n Traffic on State Highways and local County roads can be broken into three components: n Passing through the County to destinations outside of the County. n Traveling between cities within the County n Traveling between to unincorporated portions of the County Monterey County General Plan Update Trip Generation PM Peak Hour Average Daily Unincorporated County Cities Total Year 2000 60, 900 113, 100 174, 000 507, 500 942, 500 1, 450, 000 Year 2030 88, 550 164, 450 253, 000 737, 917 1, 370, 417 2, 108, 333 Growth (2000 to 2030) 27, 650 51, 350 79, 000 230, 417 427, 917 658, 333
LEVEL OF SERVICE (LOS) n LOS C n Carmel Valley and Cachagua n Stable flow but the operation of individual users becomes affected by other vehicles. Modes delays. Major approach phases fully utilized. Backups may develop behind turning vehicles. n LOS D n County Roads n Regional Roads (TAMC) n Approach unstable flow. Operation of individual users becomes significantly affected by other vehicles. Delays may be more than one cycle during peak hours. Queues may develop but dissipate rapidly, without excessive delays. n LOS may be lower in a Community Area n Only if addressed as part of the Community Plan. 1 1 1 National Research Council, Highway Capacity Manual