2 rt MetaAnalysis of Correlated Data MetaAnalysis of


 and between studies (i) Tij ~")


 qij ~ N(yj, wj 2) yj")
 qij ~ N(yj, wj 2) yj")
 qij ~ N(yj, wj 2) yj")


")

 Si =")


![Calculating the Variance/Covariance Matrix [, 1] [, 2] [, 3] [, 4] [, 5]](https://slidetodoc.com/presentation_image_h/a6566f6b8093ae66b753cf41008faae3/image-26.jpg "Calculating the Variance/Covariance Matrix [, 1] [, 2] [, 3] [, 4] [, 5]")
-1, V, random")


")

 Variance Components:")


 robu(Hedges ~ Measurement, data=co 2 data, studynum=Paper, var. eff. size=Var)")

 Type Variable rho=0.")


- Slides: 51
2 rt Meta-Analysis of Correlated Data
Meta-Analysis of Correlated Data
Common Forms of Dependence • Multiple effects per study – Or per research group! • Multiple effect sizes using same control • Phylogenetic non-independence • Measurements of multiple responses to a common treatment • Unknown correlations…
Multiple Sample Points per Study! Study Experiment in Study Hedges D V Hedges D Ramos & Pinto 2010 1 4. 32 7. 23 Ramos & Pinto 2010 2 2. 34 6. 24 Ramos & Pinto 2010 3 3. 89 5. 54 Ellner & Vadas 2003 1 -0. 54 2. 66 Ellner & Vadas 2003 2 -4. 54 8. 34 Moria & Melian 2008 1 3. 44 9. 23
Hierarchical Models • Study-level random effect • Study-level variation in coefficients • Covariates at experiment and study level
Hierarchical Models • Random variation within study (j) and between studies (i) Tij ~ N(qij, sij 2) qij ~ N(yj, wj 2) yj ~ N(m, t 2)
Study Level Clustering
Hierarchical Partitioning of One Study Mean Variation due to w Variation due to t Grand Mean
Example: Data Set 1 1 2 3 4 5 6 7 8. . . Group Effect Variance A 0. 2 0. 10 A 0. 6 0. 15 A 0. 5 0. 05 A 0. 1 0. 06 B 0. 8 0. 08 B 0. 4 0. 05 B 0. 9 0. 04 C 0. 2 0. 09
A Two-Step Solution Tij ~ N(qij, sij 2) qij ~ N(yj, wj 2) yj ~ N(m, t 2) library(plyr) data 1_study <- ddply(data 1, . (Group), function(adf){ mod <- rma(Effect, Variance, data=adf) cbind(theta_j = coef(mod), se_theta_j = coef(summary(mod))[1, 2], omega 2 = mod$tau 2) })
A Two-Step Solution Tij ~ N(qij, sij 2) qij ~ N(yj, wj 2) yj ~ N(m, t 2) > data 1_study Group theta_j se_theta_j omega 2 1 A 0. 3312500 0. 1369306 0. 0000 2 B 0. 7005364 0. 1654476 0. 02854676 3 C 0. 6788453 0. 1987595 0. 17151248 4 D 0. 7836646 0. 2677693 0. 26470540 5 E 0. 8552760 0. 1556476 0. 14561528 yj wj
A Two-Step Solution Tij ~ N(qij, sij 2) qij ~ N(yj, wj 2) yj ~ N(m, t 2) > rma(theta_j, I(se_theta_j^2), data=data 1_study) Random-Effects Model (k = 5; tau^2 estimator: REML) tau^2 (estimated amount of total heterogeneity): 0. 0272 (SE = 0. 0414). . . estimate se zval pval ci. lb ci. ub 0. 6472 0. 1087 5. 9545 <. 0001 0. 4342 0. 8603 *** m t 2
Multiple Effects per Research Group
Solutions to Multiple Hierarchies • Multiple-Step Meta-analyses • Multi-level hierarchical model fits – Better estimator – Accommodates more complex data structures – May need to go Bayesian (don't be scared!) • Model correlation…
Common Forms of Dependence • Multiple effects per study – Or per research group! • Multiple effect sizes using same control • Phylogenetic non-independence • Measurements of multiple responses to a common treatment • Unknown correlations…
Multiple Effect Sizes with Common Control Effect of each treatment calculated using same control!
The Control Keeps Showing Up! • nc and sdc are going to be the same for all treatments • Effect sizes will covary
Calculating Covariance Formulae available or derivable for all effect sizes
A Mixed Effect Group Model • Group means, random study effect, and then everything else is error Ti ~ N(qim, si 2) where qim ~ N(mm, t 2)
A Mixed Effect Group Model • Group means, random study effect, and then everything else is error Ti ~ MVN(qi, Si) where qi ~ MVN (Xim, G 2)
What are qi and Si? qi = S i= Ti ~ MVN(qi, Si)
What about the treatment effects? Xi = Gi = m= qi ~ MVN (Xim, G 2)
What if treatments are correlated? Ti ~ MVN(qi, Si) Si =
Why does covariance matter? s 2 x-y = s 2 x + s 2 y + 2 s x, y • In asking if two treatments differ, cov helps tighten confidence intervals • High cov = more weight for a study as treatments share information
Multiple Treatments 1 2 3 4 5 6 study trt m 1 i m 2 i sdpi n 1 i n 2 i 1 1 7. 87 -1. 36 4. 2593 25 25 1 2 4. 35 -1. 36 4. 2593 22 25 2 1 9. 32 0. 98 2. 8831 38 40 3 1 8. 08 1. 17 3. 1764 50 50 4 1 7. 44 0. 45 2. 9344 30 30 4 2 5. 34 0. 45 2. 9344 30 30 Common Control! http: //www. metafor-project. org/doku. php/analyses: gleser 2009
Calculating the Variance/Covariance Matrix [, 1] [, 2] [, 3] [, 4] [, 5] [, 6] [1, ] 0. 113 0. 060 0. 000 [2, ] 0. 060 0. 098 0. 000 [3, ] 0. 000 0. 105 0. 000 [4, ] 0. 000 0. 064 0. 000 [5, ] 0. 000 0. 098 0. 055 [6, ] 0. 000 0. 055 0. 082 http: //www. metafor-project. org/doku. php/analyses: gleser 2009
Fitting a Model with a VCOV Matrix > rma. mv(yi ~ factor(trt)-1, V, random =~ 1|study, data=dat)
Comparison to No Correlation Model With correlation estimate se zval pval ci. lb ci. ub factor(trt)1 2. 3796 0. 1641 14. 4984 <. 0001 2. 0579 2. 7013 factor(trt)2 1. 5784 0. 2007 7. 8662 <. 0001 1. 1851 1. 9716 Without correlation estimate se zval pval ci. lb ci. ub factor(trt)1 2. 3759 0. 1511 15. 7196 <. 0001 2. 0797 2. 6722 factor(trt)2 1. 5177 0. 2125 7. 1405 <. 0001 1. 1011 1. 9343
Common Forms of Dependence • Multiple effects per study – Or per research group! • Multiple effect sizes using same control • Phylogenetic non-independence • Measurements of multiple responses to a common treatment • Unknown correlations…
Effect Size on Related Organisms Not Independent { Warming on Litterfall Pine Trees Redwoods Fir Trees Oak Trees
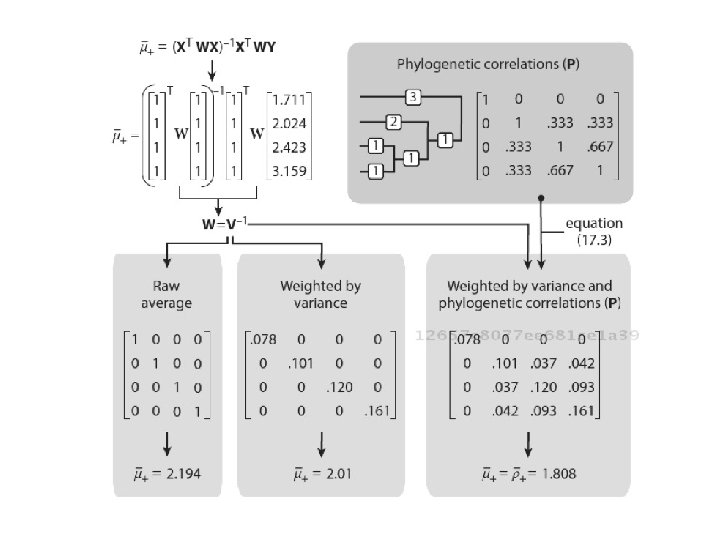
Phylogenetic Distances Determines Covariances for Weights
What about Multiple Studies of Some Species?
Common Forms of Dependence • Multiple effects per study – Or per research group! • Multiple effect sizes using same control • Phylogenetic non-independence • Measurements of multiple responses to a common treatment • Unknown correlations…
Common Treatments Treatment Response 1 Response 2 Response 3
Common Treatments CO 2 Assimilation GS Stomatal Conductance PN
Correlation Between Responses
What does Correlation between effects mean? Xi = Gi = m= qi ~ MVN (Xim, G 2)
What Do We Do? 1. Create a 'composite' measure – Average – Weighted Average 2. Estimate different coefficients directly 3. Robust Variance Estimation (RVE)
The CO 2 Effect Data 1 2 3 4 5 6 7 8 9 10 experiment Paper Measurement Hedges Var 1 121 GS -0. 4862 0. 3432 1 121 PN 0. 9817 0. 3735 2 121 GS 0. 1535 0. 3343 2 121 PN 2. 0668 0. 5113 3 121 GS 0. 0965 0. 3337 3 121 PN 2. 6101 0. 6172 4 121 GS 0. 0000 0. 2857 4 121 PN 3. 6586 0. 7638 5 168 GS -1. 5271 0. 4305 5 168 PN 1. 8355 0. 4737
Direct Estimation rma. mv(Hedges ~ Measurement, Var, random =~ Measurement|Paper, data=co 2 data, struct="HCS")
r and Different Correlation Structures • Different structures for different data • We do not always know which one is correct!
Estimates of Variance, Covariance Multivariate Meta-Analysis Model (k = 68; method: REML) Variance Components: outer factor: Paper (nlvls = 18) inner factor: Measurement (nlvls = 2) estim sqrt k. lvl fixed level tau^2. 1 4. 5098 2. 1236 34 no GS tau^2. 2 3. 5799 1. 8921 34 no PN rho 0. 4751 no
Disadvantages to Multivariate Meta-Analysis 1. Difficult to estimate with few studies 2. Additional assumptions of covariance structure 3. Often little improvement over univariate meta-analysis 4. Publication bias exacerbated if data not missing at random Jackson et al. 2011 Satist. Med.
Robust Variance Estimation • Essentially, bound weights within a group j to 1/mean varj and assume a value of r – Test sensitivity to choice of r – Correct DF for small sample sizes • Methods developed by Hedges, Tipton, and others • robumeta package in R
robumeta & RVE library(robumeta) robu(Hedges ~ Measurement, data=co 2 data, studynum=Paper, var. eff. size=Var)
RVE: Correlated Effects Model with Small-Sample Corrections Model: Hedges ~ Measurement Number of studies = 18 Number of outcomes = 68 (min = 2 , mean = 3. 78 , median = 4 , max = 10 ) Rho = 0. 8 I 2 = 85. 59992 Tau. Sq = 2. 561661 Struct="CS" only so far
Often, Choice of r Matters Little > sensitivity(co 2 mod. RVE) Type Variable rho=0. 2 rho=0. 4 rho=0. 6 rho=0. 8 rho=1 1 Estimate intercept 0. 00454 0. 00457 0. 00459 0. 00462 0. 00464 0. 00467 2 - Measurement. PN 1. 03149 1. 03139 1. 03128 1. 03118 1. 03107 1. 03097 3 Std. Err. intercept 0. 51173 0. 51179 0. 51185 0. 51192 0. 51198 0. 51204 4 - Measurement. PN 0. 61984 0. 61990 0. 61996 0. 62003 0. 62009 0. 62015 5 Tau. Sq - 2. 55334 2. 55542 2. 55750 2. 55958 2. 56166 2. 56374
Results May Differ… Multivariate Meta-Analysis Model Results: estimate se zval pval ci. lb ci. ub intrcpt -0. 0503 0. 5221 -0. 0963 0. 9233 -1. 0735 0. 9730 Measurement. PN 1. 0579 0. 5359 1. 9742 0. 0484 0. 0076 2. 1082 * Robust Variance Estimation Model Results: Estimate Std. Err t-value df P(|t|>) 95% CI. L 95% CI. U Sig 1 intercept 0. 00464 0. 512 0. 00907 16. 7 0. 993 -1. 077 1. 09 2 Measurement. PN 1. 03107 0. 620 1. 66278 16. 7 0. 115 -0. 279 2. 34
Other Sources of Unknown Correlations • Shared system types • Shared environmental events • Labs or investigators • Re-sampling experiments • Experiments repeated in a region • More…
Why Model Correlation instead of Hierarchy? • Depends on question • Analytical difficulty • Leveraging correlation to aid with missing data