2 Random Graphs The ErdsRnyi models Distinguish Equilibrium

2. Random Graphs The Erdös-Rényi models

Distinguish: – Equilibrium random networks – Nonequilibrium random networks

Equilibrium random networks A classical undirected random graph: – the total number of vertices is fixed – connect randomly chosen pairs of vertices

Nonequilibrium random network A classical random graph that grows through simultaneous addition of vertices and links – at each time step a new vertex is added – simultaneously, a pair of randomly chosen vertices is connected

Status Graph theory: – Equilibrium networks with a Poisson degree distribution Physics: – Nonequilibrium (growing networks), percolation

Statistical sense A particular observed network is only one member of a statistical ensemble of all possible realizations Random network -> Statistical ensemble possible graphs N nodes -> How should we understand the degree distribution? It determines the ensemble of the equilibrium random networks

The Erdos-Renyi model Definition: N labeled nodes connected by n links which are chosen randomly from the N(N-1)/2 possible links There are graphs with N nodes and n links

Alternative definition Binomial model: start with N nodes, every pair of nodes being connected with probability p The total number of links, n, is a random variable – E(n)=p. N(N-1)/2 Probability of generating a graph, G 0{N, n}

Growing a graph Sometimes we will study properties of the graph as p increases Assign a random number qi [0, 1] to attach links and then links appear as p is increased p> qi We are interested in the “static” properties of the graph when N-> and keeping constant p or n

N-> Definition: almost every graph has a property Q if the probability of having Q approaches 1 as N-> The main goal of Random Graph theory is to determine at what connection probability p a particular property of a graph most likely arises

Many important properties appear suddenly: – almost everygraph has the property – almost no graph has it Usually there exists a critical probability pc(N) probability that almost every graph has property Q
 grows slower than pc(N) If p(N) grows faster than pc(N)")
If p(N) grows slower than pc(N) If p(N) grows faster than pc(N)
/2 –")
Examples Larger graphs with the same p contain more links since n=p. N(N-1)/2 – Appearance of cycles can occur for smaller p in large graphs than in smaller ones [pc(N -> )->0] Average degree of the graph

Subgraphs P 1 set of nodes, E 1 set of links G 1(P 1, E 1) is a subgraph of G(P, E) if all nodes of G 1 belong to G and links too. Basic subgraphs: – cycles – trees – complete graphs
")
Evolution of the graph (p grows)

Subgraph in graph F small graph of k nodes and l links How many subgraphs like F exist in G? This expected value depends on p. If N>>k

There are no subgraphs like F If = constant => mean number of subgraphs is a finite number The critical probability
/2 We")
Tree of order k: l=k-1 Cycle of order k: l=k Complete subgraph l=k(k-1)/2 We can see how the subgraphs appear when increasing p

Mean connectivity <k>=p. N If then <k> is a constant If 0< <k> < 1 almost surely all clusters are either trees or clusters containing exactly one cycle At <k>=1 the structure changes abruptly. Cycles appear and a giant cluster develops

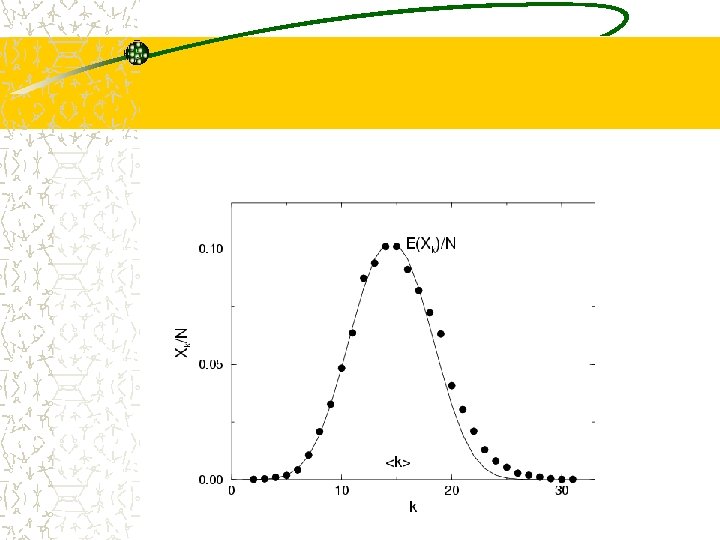
Degree distribution The degree of a node follows a binomial distribution (in a random graph with p) Probability that a given node has a connectivity k For large N, Poisson distribution

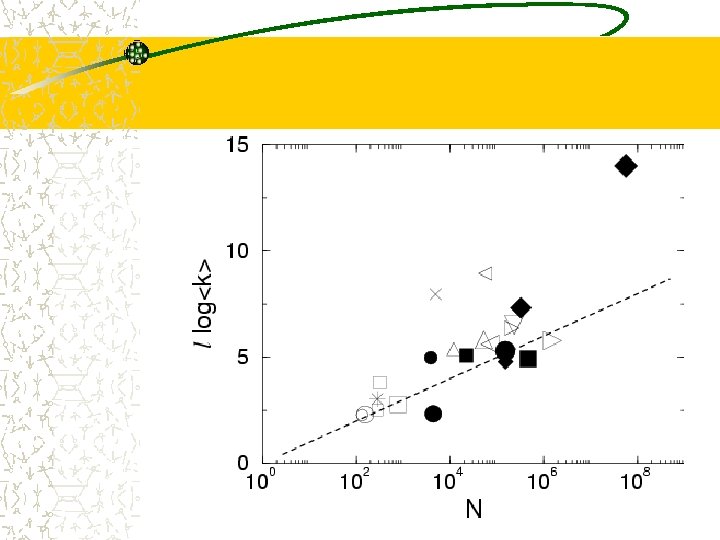
Mean short path Assume that the graph is homogeneous The number of nodes at distance l are <k>l How to reach the rest of the nodes? lrand to reach all nodes => kl=N

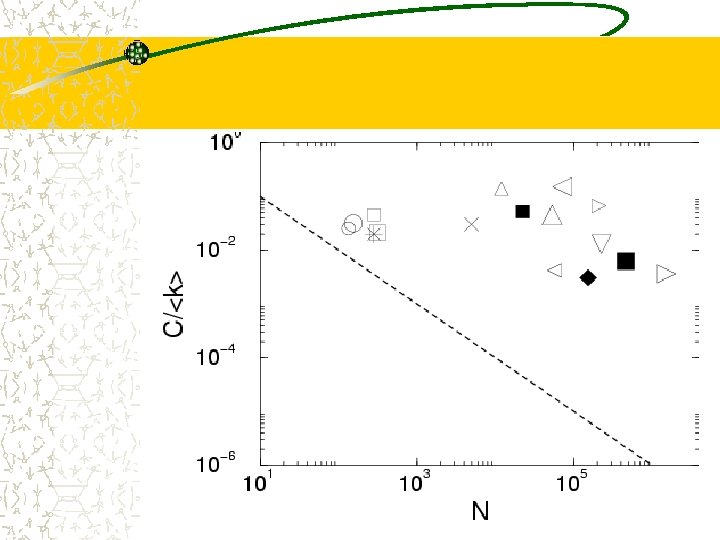
Clustering coefficient Probability that two nodes are connected (given that they are connected to a third)? while it is constant for real networks

Spectrum: random matrices If Aij real, symmetric, Nx. N uncorrelated random matrix <Aij>=0 and <Aij 2>= 2 Density of eigenvalues of Wigner’s or semicircle law (late 50’s)
 Plotting ( ) semicircel law")
Spectrum: random graph <Aij>= not 0 2 =p(1 -p) Plotting ( ) semicircel law as N increases (p constant)

In general, z<1: – semicircle law – exists an infinite cluster – 1 (principal, largest) is isolated, grows like N z<1: most of the graphs are trees (odd moment vanish). The spectral density contains the weighted sum of the spectral densities of all finite graphs

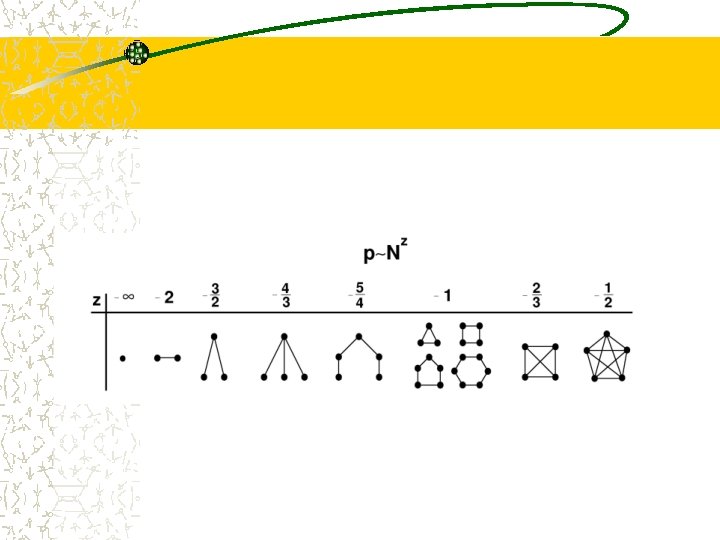
Generalized random graphs One can construct a graph introducing the degree distribution as an input How do the properties of the network change with the exponent? decreases from to 0
 The infinite cluster emerges when There exists a")
<k>=kmax- +2 (kmax <N, max degree) The infinite cluster emerges when There exists a value 0=3. 47875. . . > 0 disconnected > 0 almost surely connected
 Normalitzable for any k >2 disconnected <2")
Exponential cutoff (observed in real world networks) Normalitzable for any k >2 disconnected <2 connected

NON-RANDOM aspects of the topology of real networks

Growing networks See hand-written notes

Scaling
- Slides: 35