
2 Radiometric Properties of Light Prof Gabriel Popescu
2. Radiometric Properties of Light Prof. Gabriel Popescu Light Emission, Detection, and Statistics
2. Radiometric Properties of Light • Radiometry • Objective measure—photodetector • Cases: Unravel the properties of light in an absolute, unbiased sense • Photometry • Physiological response of the human retina—human eye • Cases: Consumer cameras, displays • What kind of quantities of an electromagnetic field are most commonly used in radiometry? Prof. Gabriel Popescu Light Emission, Detection, and Statistics
2. 1 Energy • Energy Q: Quantifies ability to perform work • Accelerating particles, heating materials, generating photoelectrons in a detector, etc • Energy is measured in Joules(J) • Energy conversion generate light • Thermal to optical: An incandescent bulb • Electrical to optical: Electrically-pumped laser • Chemical to optical: Fireflies, chemically-excited lasers • Light-matter interactions • Inelastic: An optical field exchange energy with various materials • Elastic: Light change direction of propagation (or momentum), without loss (or gain) in energy Prof. Gabriel Popescu Light Emission, Detection, and Statistics
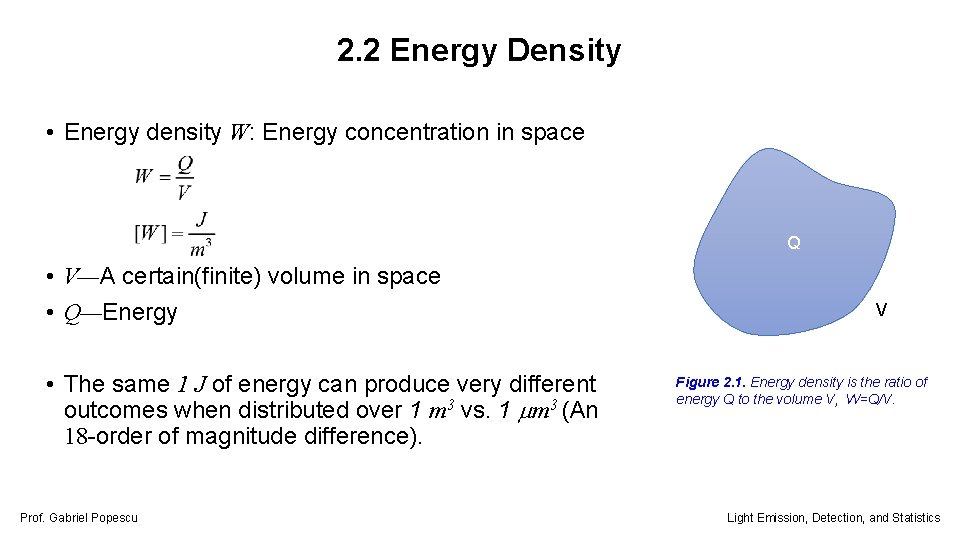
2. 2 Energy Density • Energy density W: Energy concentration in space Q • V—A certain(finite) volume in space • Q—Energy • The same 1 J of energy can produce very different outcomes when distributed over 1 m 3 vs. 1 m 3 (An 18 -order of magnitude difference). Prof. Gabriel Popescu V Figure 2. 1. Energy density is the ratio of energy Q to the volume V, W=Q/V. Light Emission, Detection, and Statistics
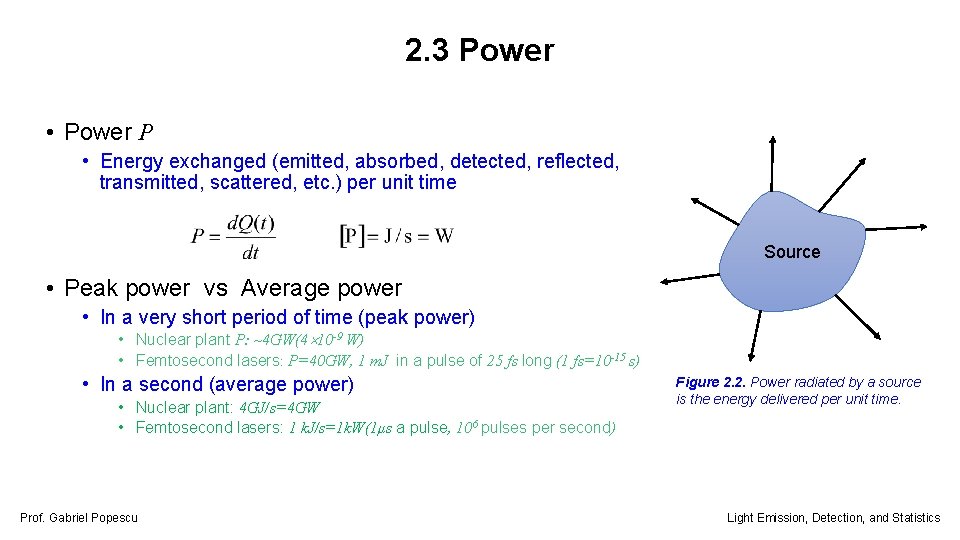
2. 3 Power • Power P • Energy exchanged (emitted, absorbed, detected, reflected, transmitted, scattered, etc. ) per unit time Source • Peak power vs Average power • In a very short period of time (peak power) • Nuclear plant P: ~4 GW(4 10 -9 W) • Femtosecond lasers: P=40 GW, 1 m. J in a pulse of 25 fs long (1 fs=10 -15 s) • In a second (average power) • Nuclear plant: 4 GJ/s=4 GW • Femtosecond lasers: 1 k. J/s=1 k. W(1μs a pulse, 106 pulses per second) Prof. Gabriel Popescu Figure 2. 2. Power radiated by a source is the energy delivered per unit time. Light Emission, Detection, and Statistics
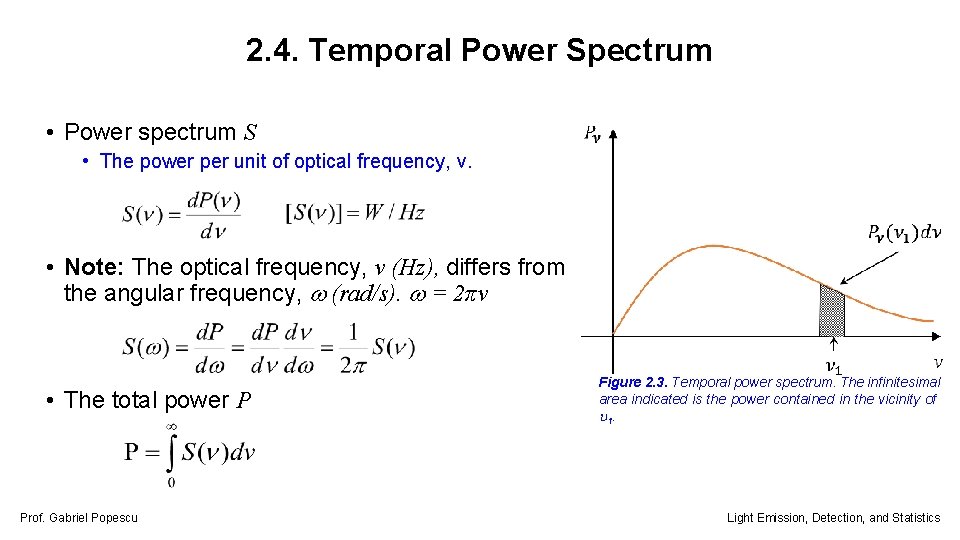
2. 4. Temporal Power Spectrum • Power spectrum S • The power per unit of optical frequency, v. • Note: The optical frequency, v (Hz), differs from the angular frequency, (rad/s). = 2πv • The total power P Prof. Gabriel Popescu Figure 2. 3. Temporal power spectrum. The infinitesimal area indicated is the power contained in the vicinity of 1. Light Emission, Detection, and Statistics
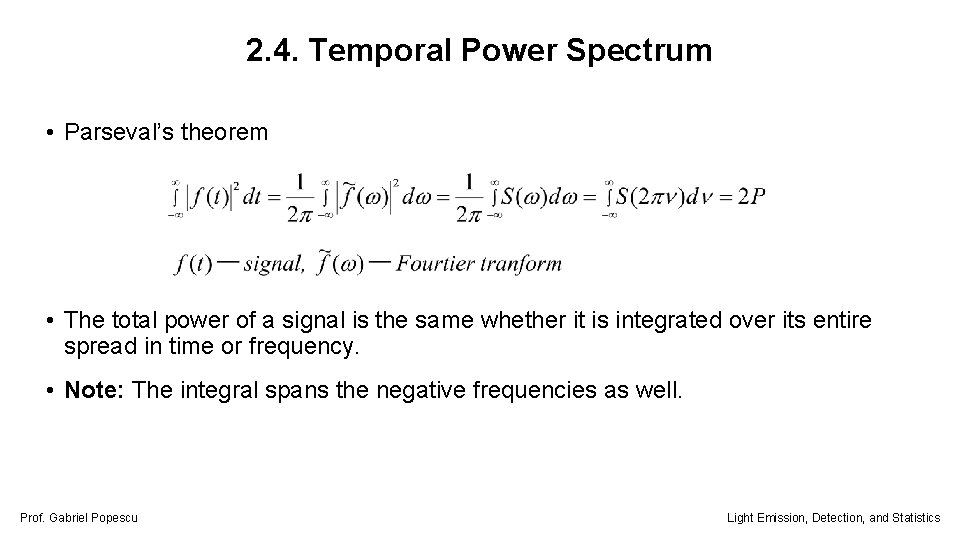
2. 4. Temporal Power Spectrum • Parseval’s theorem • The total power of a signal is the same whether it is integrated over its entire spread in time or frequency. • Note: The integral spans the negative frequencies as well. Prof. Gabriel Popescu Light Emission, Detection, and Statistics
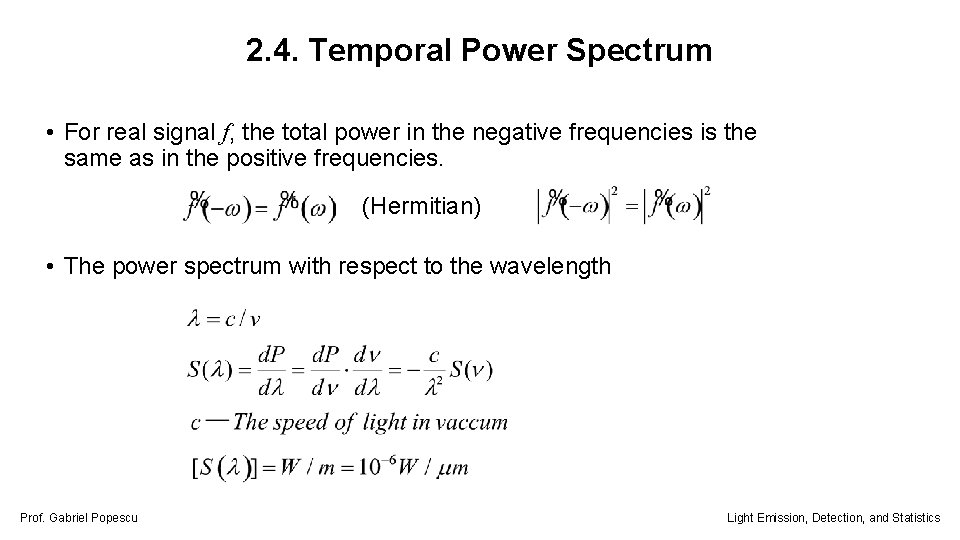
2. 4. Temporal Power Spectrum • For real signal f, the total power in the negative frequencies is the same as in the positive frequencies. (Hermitian) • The power spectrum with respect to the wavelength Prof. Gabriel Popescu Light Emission, Detection, and Statistics
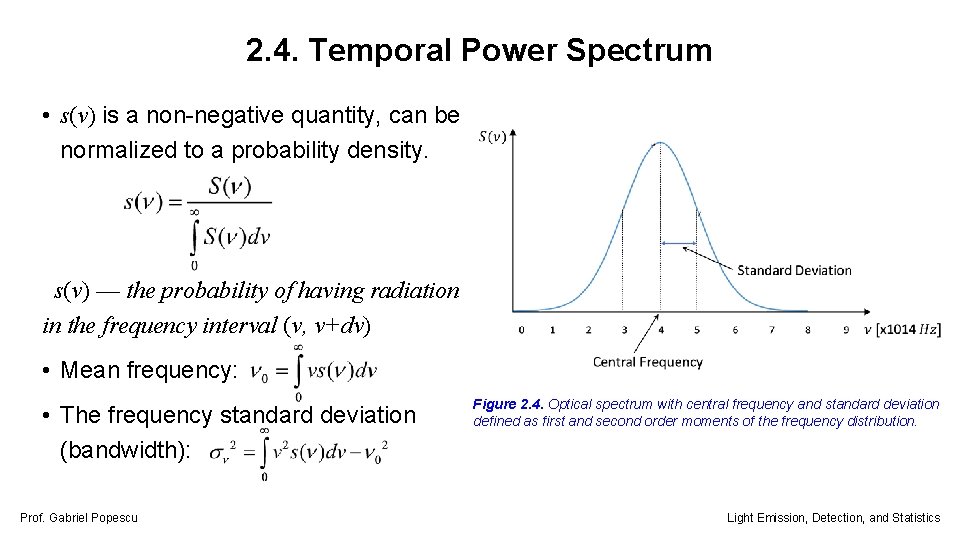
2. 4. Temporal Power Spectrum • s(v) is a non-negative quantity, can be normalized to a probability density. s(v) — the probability of having radiation in the frequency interval (v, v+dv) • Mean frequency: • The frequency standard deviation (bandwidth): Prof. Gabriel Popescu Figure 2. 4. Optical spectrum with central frequency and standard deviation defined as first and second order moments of the frequency distribution. Light Emission, Detection, and Statistics
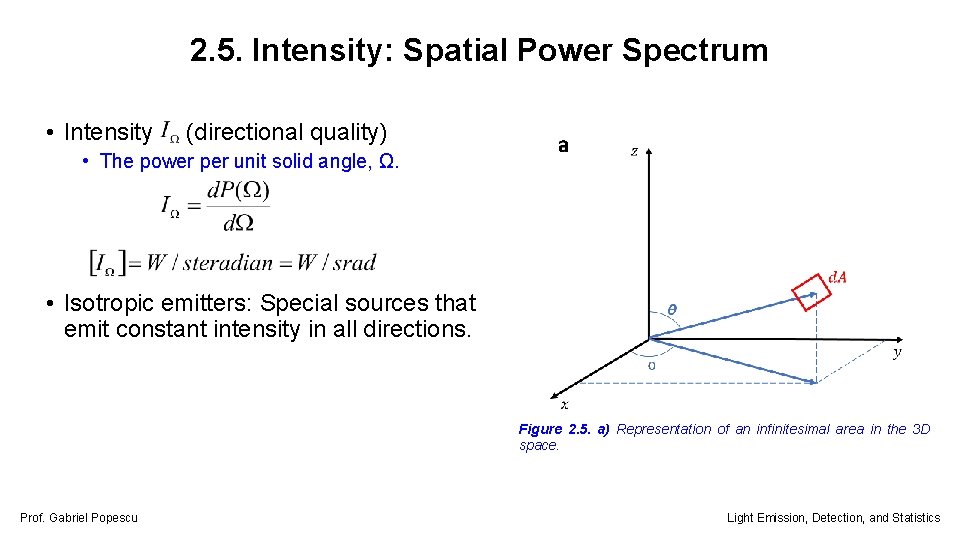
2. 5. Intensity: Spatial Power Spectrum • Intensity (directional quality) • The power per unit solid angle, Ω. • Isotropic emitters: Special sources that emit constant intensity in all directions. Figure 2. 5. a) Representation of an infinitesimal area in the 3 D space. Prof. Gabriel Popescu Light Emission, Detection, and Statistics
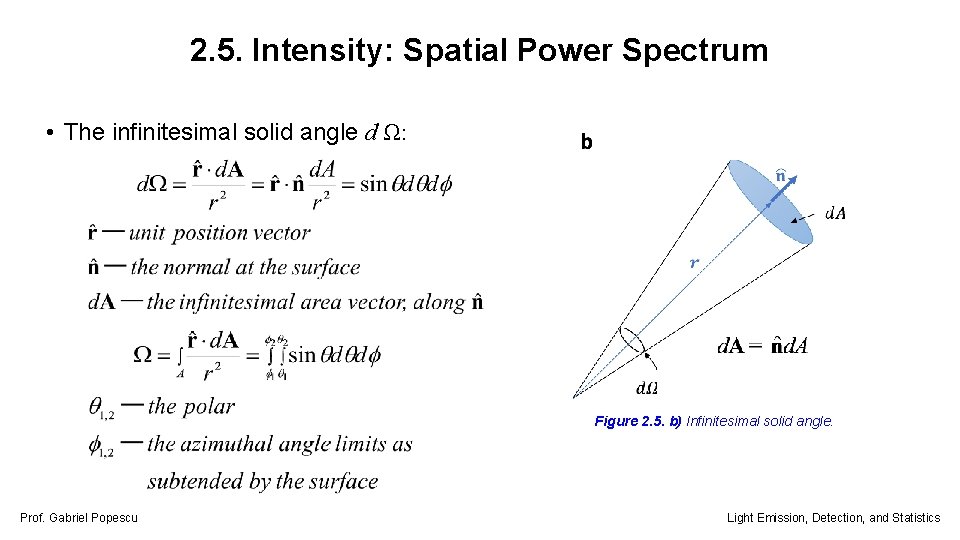
2. 5. Intensity: Spatial Power Spectrum • The infinitesimal solid angle d Ω: Figure 2. 5. b) Infinitesimal solid angle. Prof. Gabriel Popescu Light Emission, Detection, and Statistics
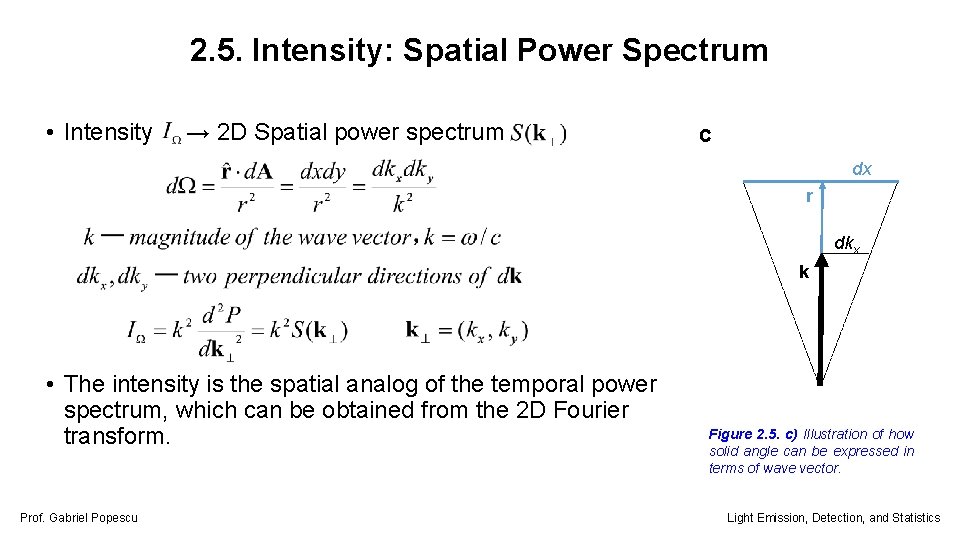
2. 5. Intensity: Spatial Power Spectrum • Intensity → 2 D Spatial power spectrum c dx r dkx k • The intensity is the spatial analog of the temporal power spectrum, which can be obtained from the 2 D Fourier transform. Prof. Gabriel Popescu Figure 2. 5. c) Illustration of how solid angle can be expressed in terms of wave vector. Light Emission, Detection, and Statistics
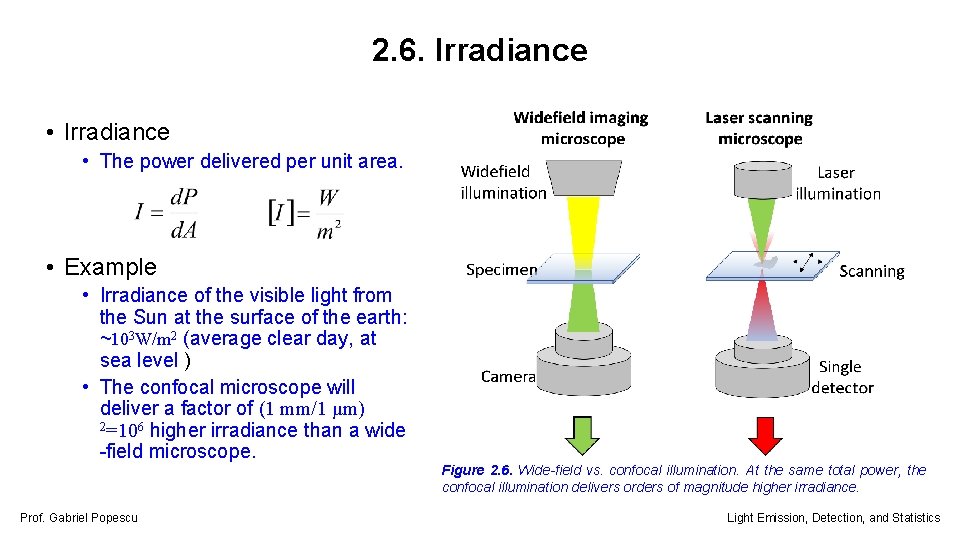
2. 6. Irradiance • The power delivered per unit area. • Example • Irradiance of the visible light from the Sun at the surface of the earth: ~103 W/m 2 (average clear day, at sea level ) • The confocal microscope will deliver a factor of (1 mm/1 μm) 2=106 higher irradiance than a wide -field microscope. Prof. Gabriel Popescu Figure 2. 6. Wide-field vs. confocal illumination. At the same total power, the confocal illumination delivers orders of magnitude higher irradiance. Light Emission, Detection, and Statistics
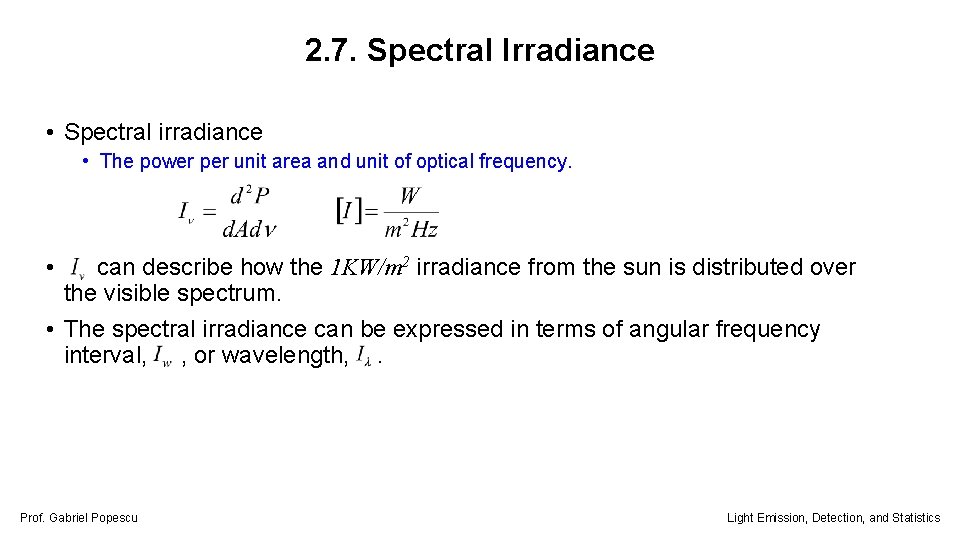
2. 7. Spectral Irradiance • Spectral irradiance • The power per unit area and unit of optical frequency. • can describe how the 1 KW/m 2 irradiance from the sun is distributed over the visible spectrum. • The spectral irradiance can be expressed in terms of angular frequency interval, , or wavelength, . Prof. Gabriel Popescu Light Emission, Detection, and Statistics
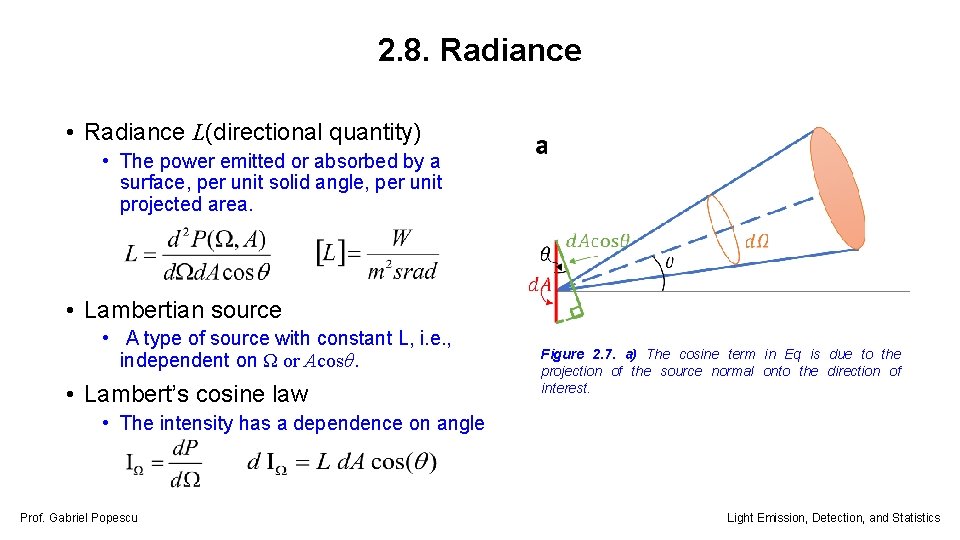
2. 8. Radiance • Radiance L(directional quantity) • The power emitted or absorbed by a surface, per unit solid angle, per unit projected area. • Lambertian source • A type of source with constant L, i. e. , independent on Ω or Acosθ. • Lambert’s cosine law Figure 2. 7. a) The cosine term in Eq is due to the projection of the source normal onto the direction of interest. • The intensity has a dependence on angle Prof. Gabriel Popescu Light Emission, Detection, and Statistics
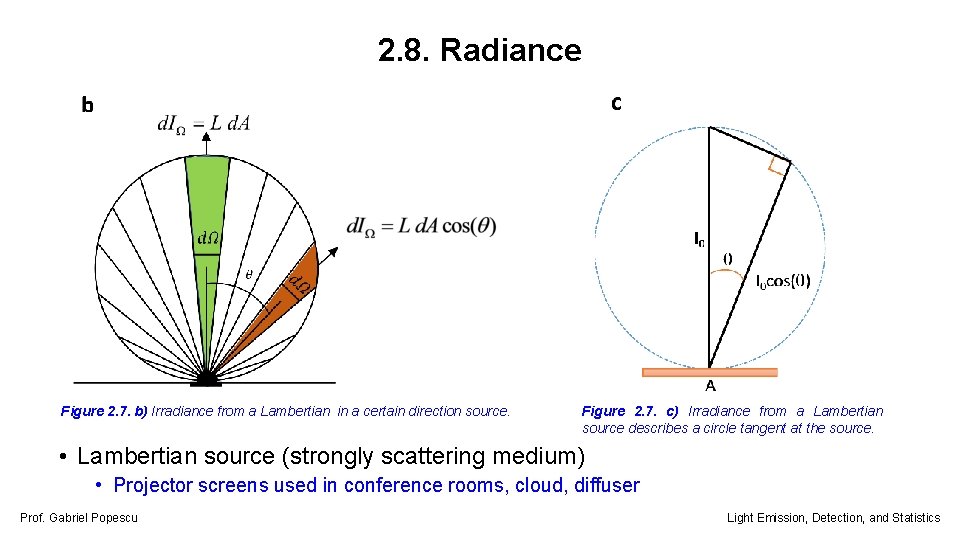
2. 8. Radiance Figure 2. 7. b) Irradiance from a Lambertian in a certain direction source. Figure 2. 7. c) Irradiance from a Lambertian source describes a circle tangent at the source. • Lambertian source (strongly scattering medium) • Projector screens used in conference rooms, cloud, diffuser Prof. Gabriel Popescu Light Emission, Detection, and Statistics
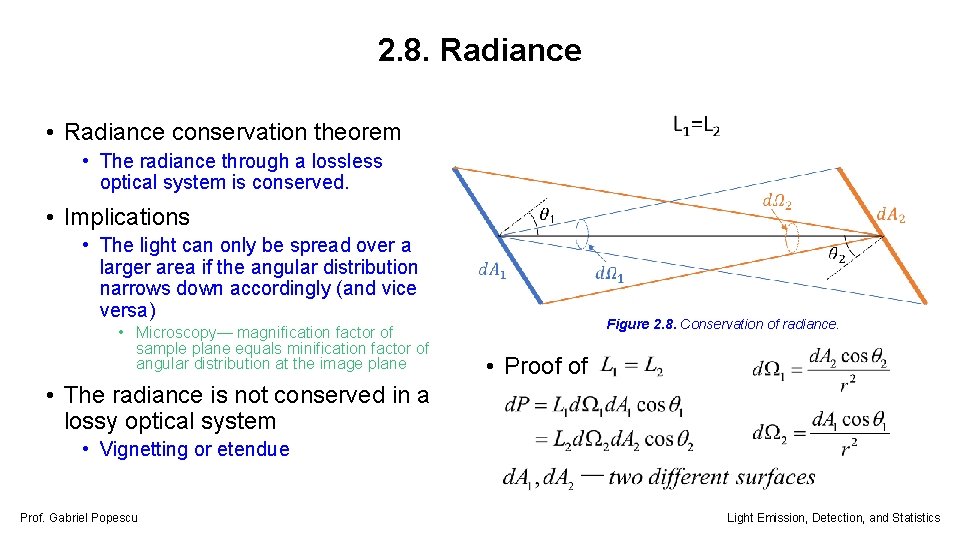
2. 8. Radiance • Radiance conservation theorem • The radiance through a lossless optical system is conserved. • Implications • The light can only be spread over a larger area if the angular distribution narrows down accordingly (and vice versa) • Microscopy— magnification factor of sample plane equals minification factor of angular distribution at the image plane Figure 2. 8. Conservation of radiance. • Proof of • The radiance is not conserved in a lossy optical system • Vignetting or etendue Prof. Gabriel Popescu Light Emission, Detection, and Statistics
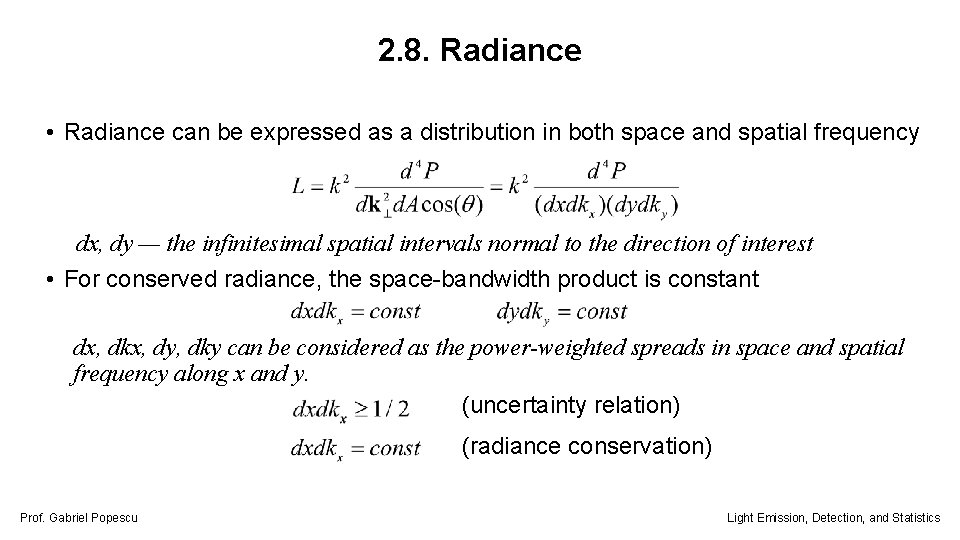
2. 8. Radiance • Radiance can be expressed as a distribution in both space and spatial frequency dx, dy — the infinitesimal spatial intervals normal to the direction of interest • For conserved radiance, the space-bandwidth product is constant dx, dkx, dy, dky can be considered as the power-weighted spreads in space and spatial frequency along x and y. (uncertainty relation) (radiance conservation) Prof. Gabriel Popescu Light Emission, Detection, and Statistics
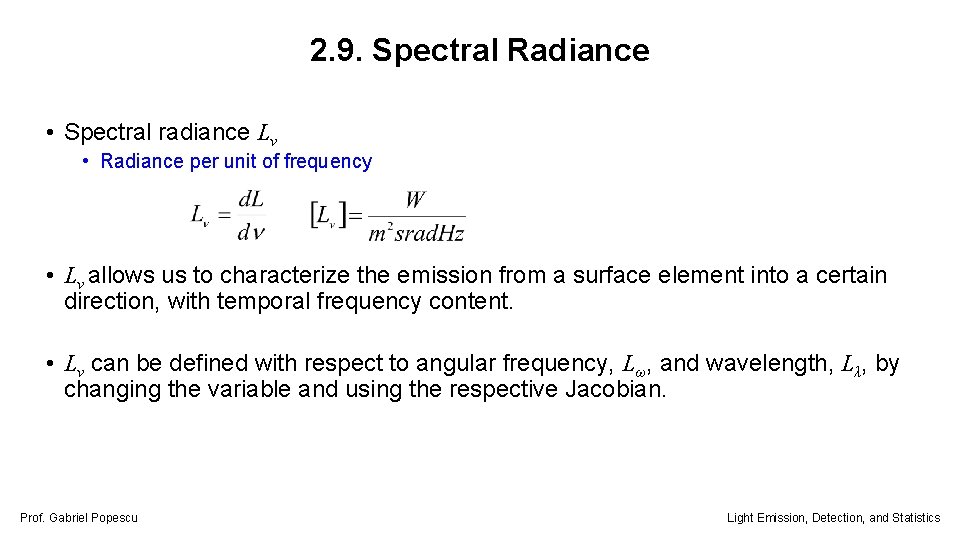
2. 9. Spectral Radiance • Spectral radiance Lv • Radiance per unit of frequency • Lv allows us to characterize the emission from a surface element into a certain direction, with temporal frequency content. • Lv can be defined with respect to angular frequency, Lω, and wavelength, Lλ, by changing the variable and using the respective Jacobian. Prof. Gabriel Popescu Light Emission, Detection, and Statistics
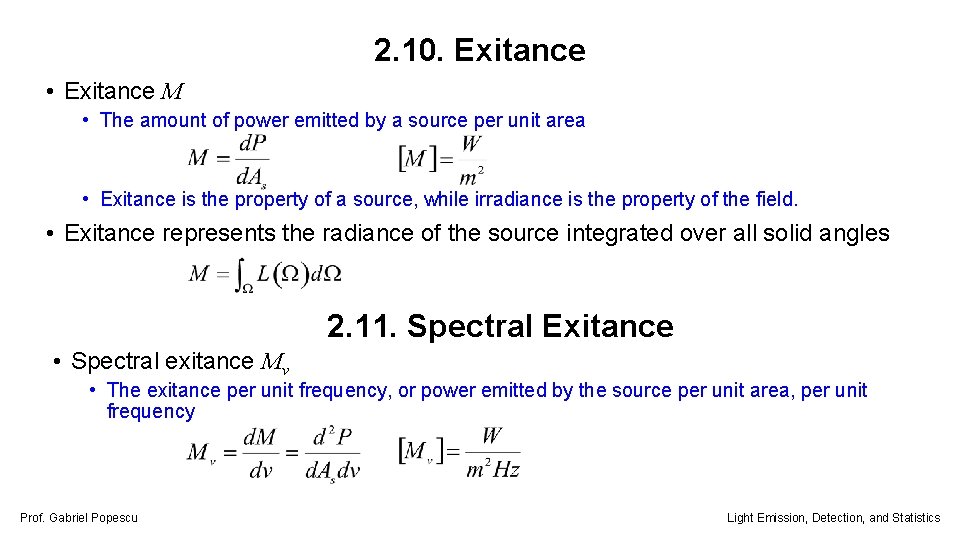
2. 10. Exitance • Exitance M • The amount of power emitted by a source per unit area • Exitance is the property of a source, while irradiance is the property of the field. • Exitance represents the radiance of the source integrated over all solid angles 2. 11. Spectral Exitance • Spectral exitance Mv • The exitance per unit frequency, or power emitted by the source per unit area, per unit frequency Prof. Gabriel Popescu Light Emission, Detection, and Statistics
3. Photon-based Radiometric Quantities Prof. Gabriel Popescu Light Emission, Detection, and Statistics
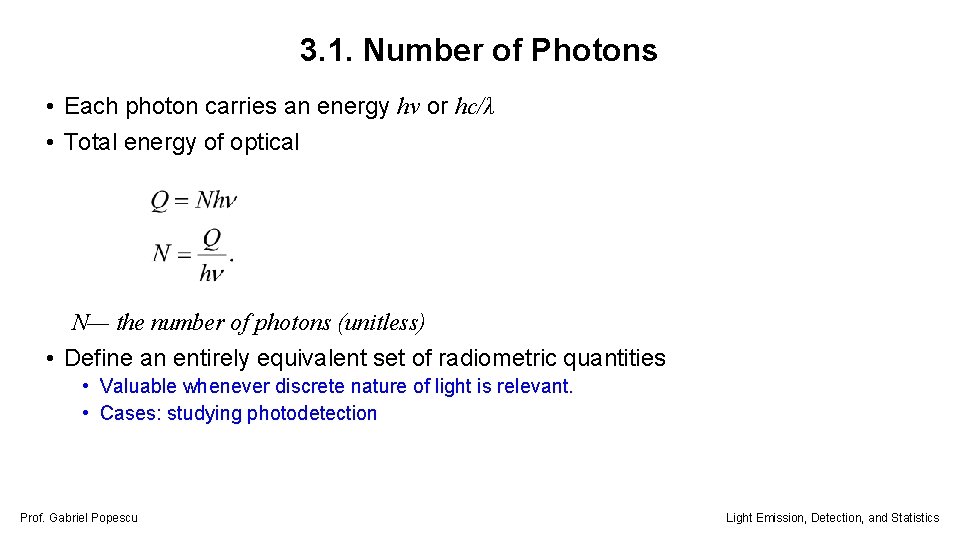
3. 1. Number of Photons • Each photon carries an energy hv or hc/λ • Total energy of optical N— the number of photons (unitless) • Define an entirely equivalent set of radiometric quantities • Valuable whenever discrete nature of light is relevant. • Cases: studying photodetection Prof. Gabriel Popescu Light Emission, Detection, and Statistics
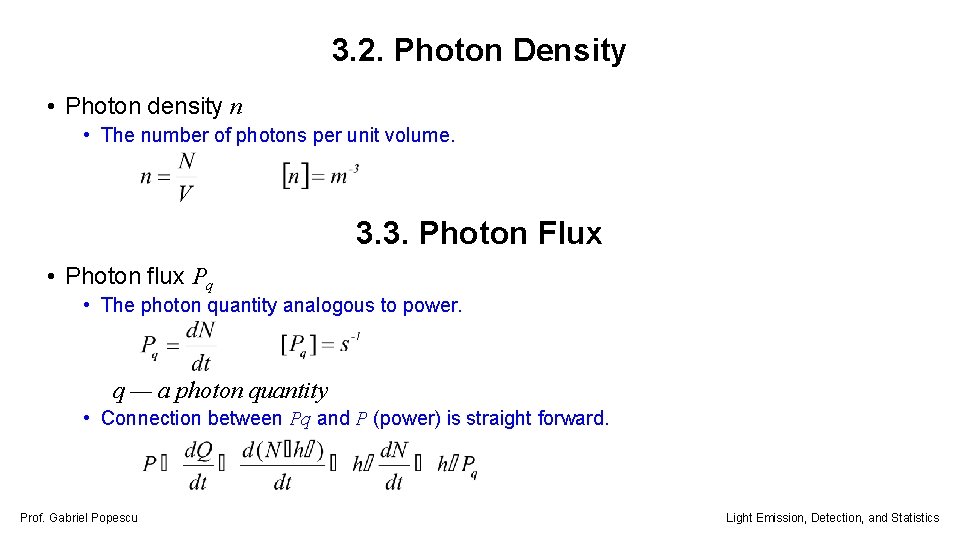
3. 2. Photon Density • Photon density n • The number of photons per unit volume. 3. 3. Photon Flux • Photon flux Pq • The photon quantity analogous to power. q — a photon quantity • Connection between Pq and P (power) is straight forward. Prof. Gabriel Popescu Light Emission, Detection, and Statistics
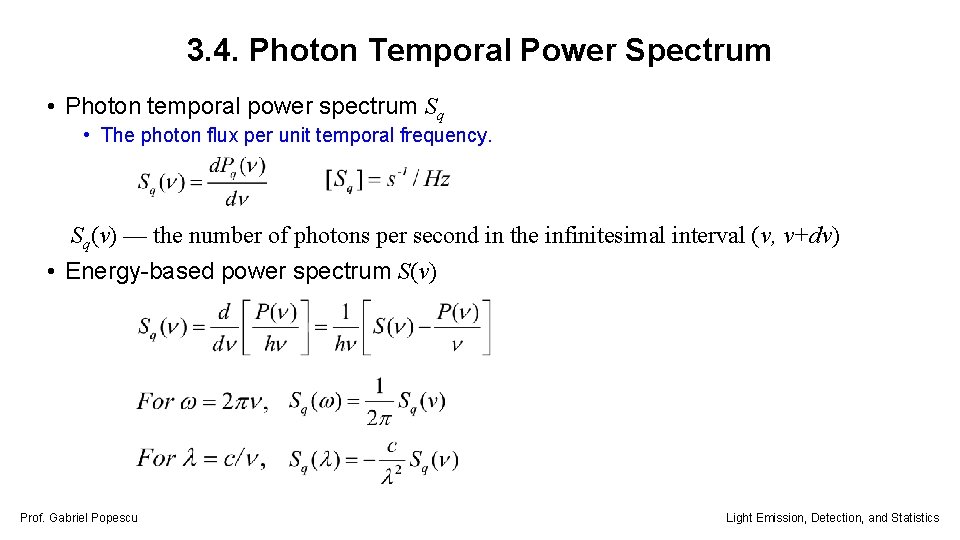
3. 4. Photon Temporal Power Spectrum • Photon temporal power spectrum Sq • The photon flux per unit temporal frequency. Sq(v) — the number of photons per second in the infinitesimal interval (v, v+dv) • Energy-based power spectrum S(v) Prof. Gabriel Popescu Light Emission, Detection, and Statistics
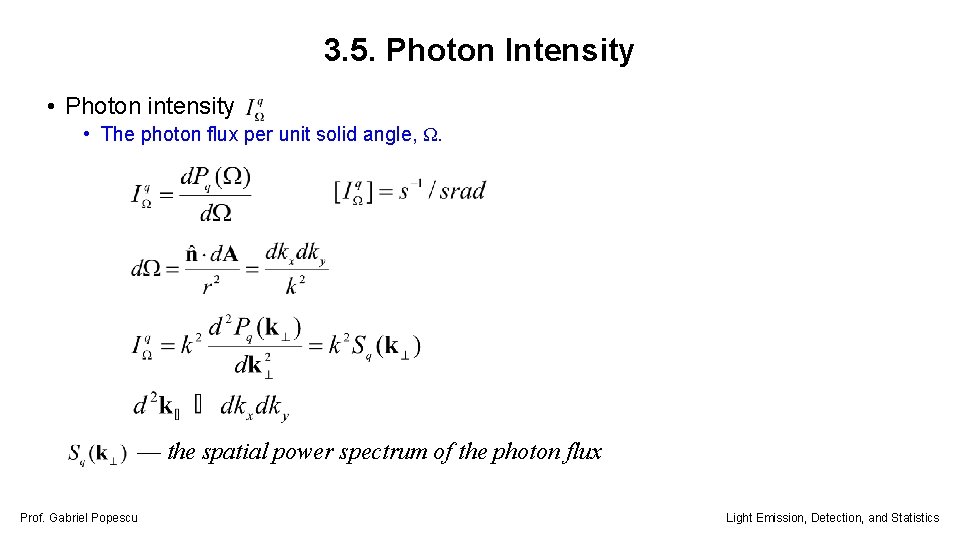
3. 5. Photon Intensity • Photon intensity • The photon flux per unit solid angle, Ω. — the spatial power spectrum of the photon flux Prof. Gabriel Popescu Light Emission, Detection, and Statistics
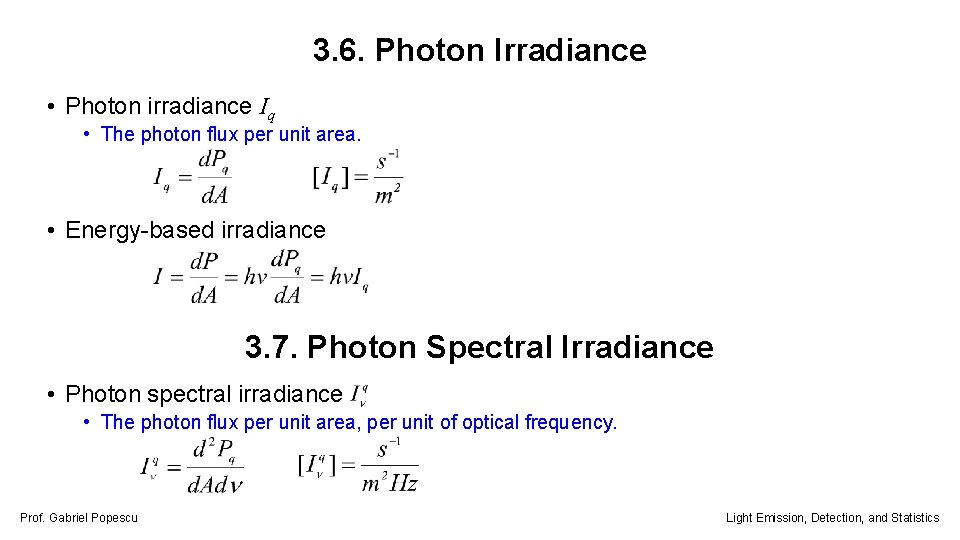
3. 6. Photon Irradiance • Photon irradiance Iq • The photon flux per unit area. • Energy-based irradiance 3. 7. Photon Spectral Irradiance • Photon spectral irradiance • The photon flux per unit area, per unit of optical frequency. Prof. Gabriel Popescu Light Emission, Detection, and Statistics
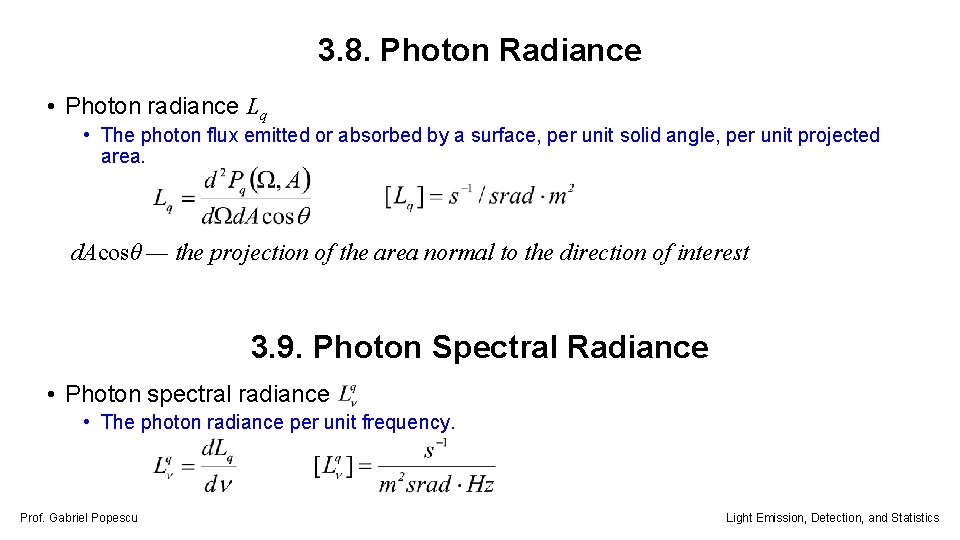
3. 8. Photon Radiance • Photon radiance Lq • The photon flux emitted or absorbed by a surface, per unit solid angle, per unit projected area. d. Acosθ — the projection of the area normal to the direction of interest 3. 9. Photon Spectral Radiance • Photon spectral radiance • The photon radiance per unit frequency. Prof. Gabriel Popescu Light Emission, Detection, and Statistics
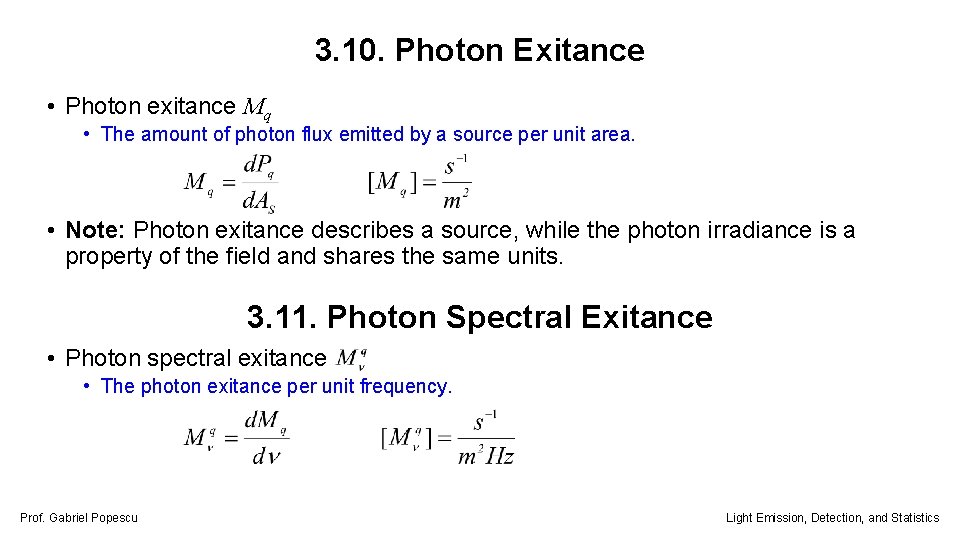
3. 10. Photon Exitance • Photon exitance Mq • The amount of photon flux emitted by a source per unit area. • Note: Photon exitance describes a source, while the photon irradiance is a property of the field and shares the same units. 3. 11. Photon Spectral Exitance • Photon spectral exitance • The photon exitance per unit frequency. Prof. Gabriel Popescu Light Emission, Detection, and Statistics
4. Photometric Properties of Light Prof. Gabriel Popescu Light Emission, Detection, and Statistics
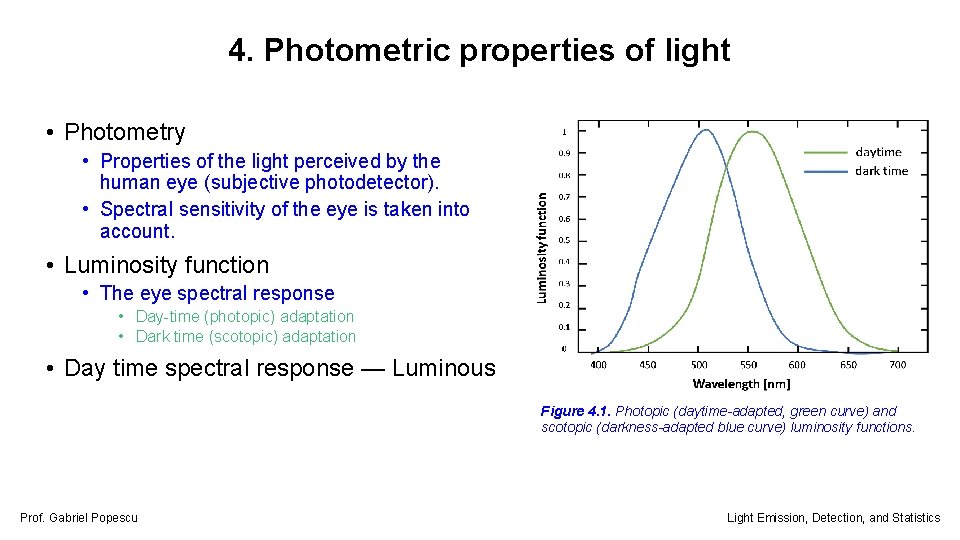
4. Photometric properties of light • Photometry • Properties of the light perceived by the human eye (subjective photodetector). • Spectral sensitivity of the eye is taken into account. • Luminosity function • The eye spectral response • Day-time (photopic) adaptation • Dark time (scotopic) adaptation • Day time spectral response — Luminous Figure 4. 1. Photopic (daytime-adapted, green curve) and scotopic (darkness-adapted blue curve) luminosity functions. Prof. Gabriel Popescu Light Emission, Detection, and Statistics
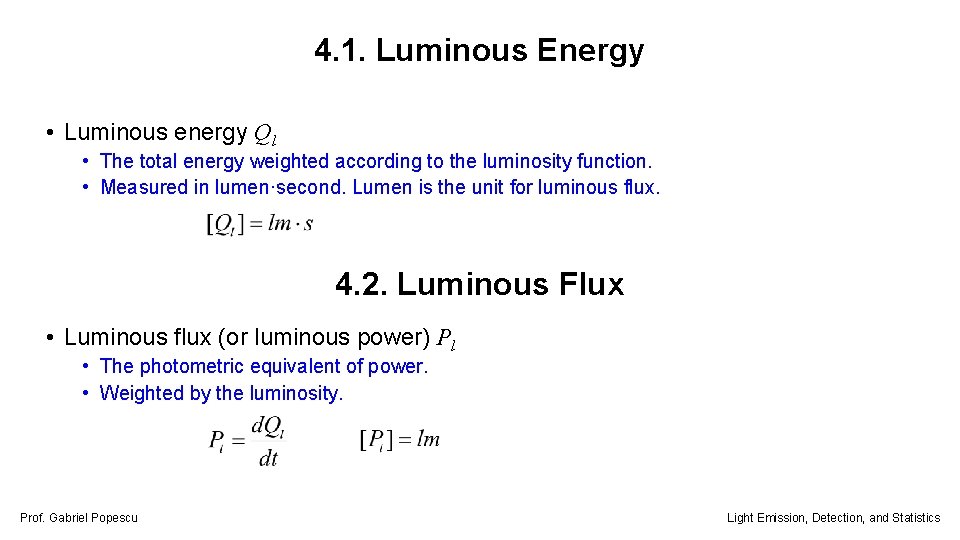
4. 1. Luminous Energy • Luminous energy Ql • The total energy weighted according to the luminosity function. • Measured in lumen·second. Lumen is the unit for luminous flux. 4. 2. Luminous Flux • Luminous flux (or luminous power) Pl • The photometric equivalent of power. • Weighted by the luminosity. Prof. Gabriel Popescu Light Emission, Detection, and Statistics
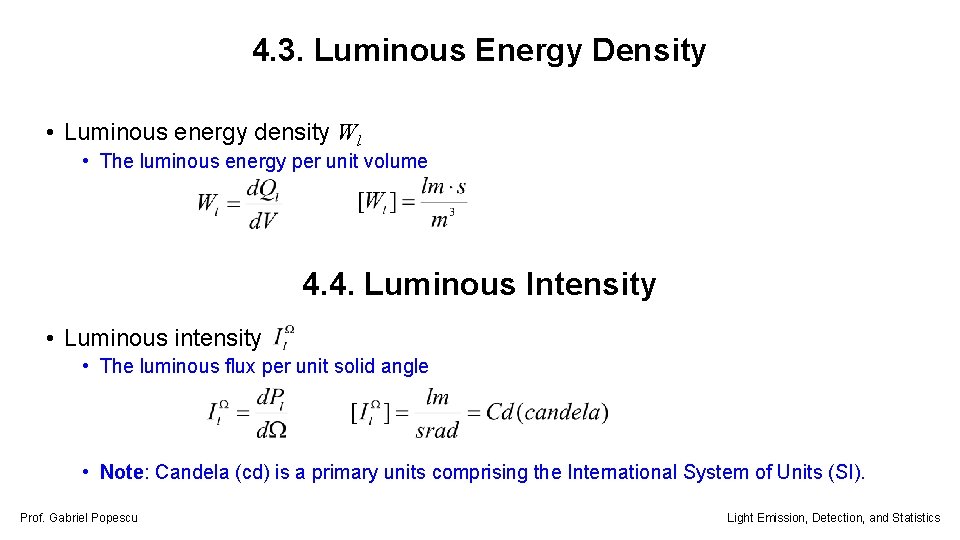
4. 3. Luminous Energy Density • Luminous energy density Wl • The luminous energy per unit volume 4. 4. Luminous Intensity • Luminous intensity • The luminous flux per unit solid angle • Note: Candela (cd) is a primary units comprising the International System of Units (SI). Prof. Gabriel Popescu Light Emission, Detection, and Statistics
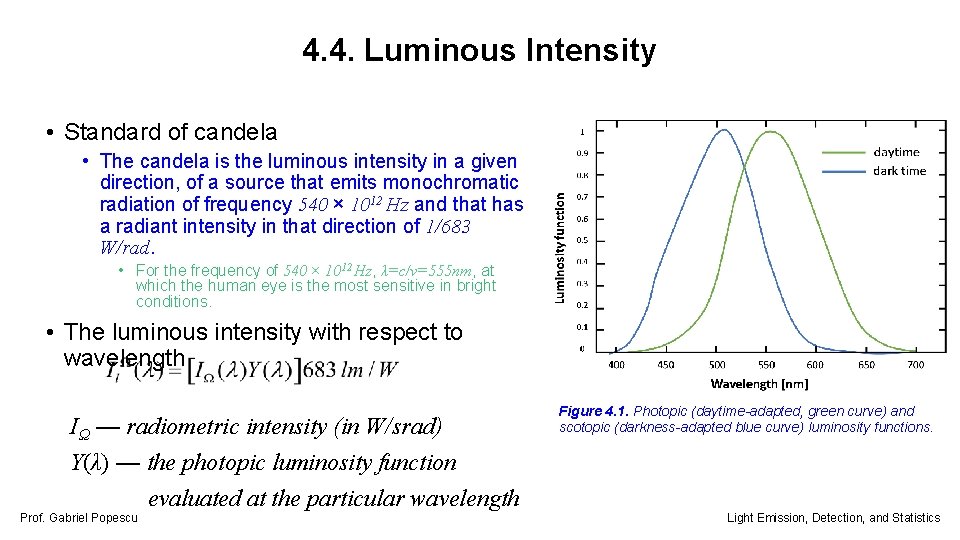
4. 4. Luminous Intensity • Standard of candela • The candela is the luminous intensity in a given direction, of a source that emits monochromatic radiation of frequency 540 × 1012 Hz and that has a radiant intensity in that direction of 1/683 W/rad. • For the frequency of 540 × 1012 Hz, λ=c/v=555 nm, at which the human eye is the most sensitive in bright conditions. • The luminous intensity with respect to wavelength IΩ — radiometric intensity (in W/srad) Y(λ) — the photopic luminosity function evaluated at the particular wavelength Prof. Gabriel Popescu Figure 4. 1. Photopic (daytime-adapted, green curve) and scotopic (darkness-adapted blue curve) luminosity functions. Light Emission, Detection, and Statistics
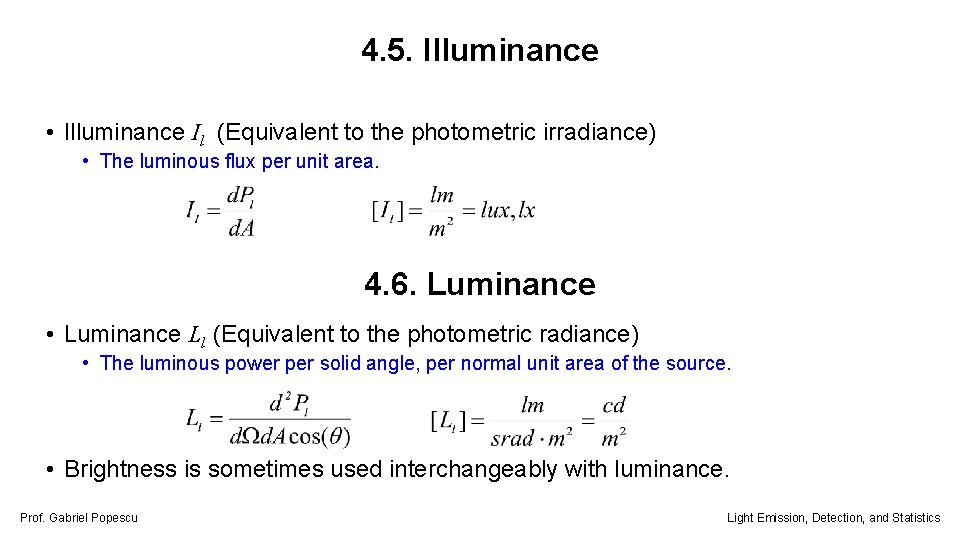
4. 5. Illuminance • Illuminance Il (Equivalent to the photometric irradiance) • The luminous flux per unit area. 4. 6. Luminance • Luminance Ll (Equivalent to the photometric radiance) • The luminous power per solid angle, per normal unit area of the source. • Brightness is sometimes used interchangeably with luminance. Prof. Gabriel Popescu Light Emission, Detection, and Statistics
- Slides: 34