2 p 15 ttest Wilcoxon test Paired ttest
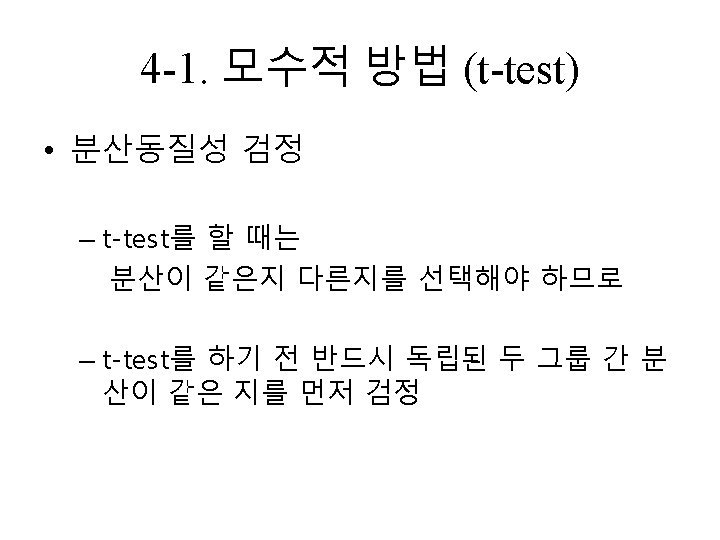
 알고 싶은 내용 모수적 방법 (정규성) 비모수적 방법")


- Slides: 49
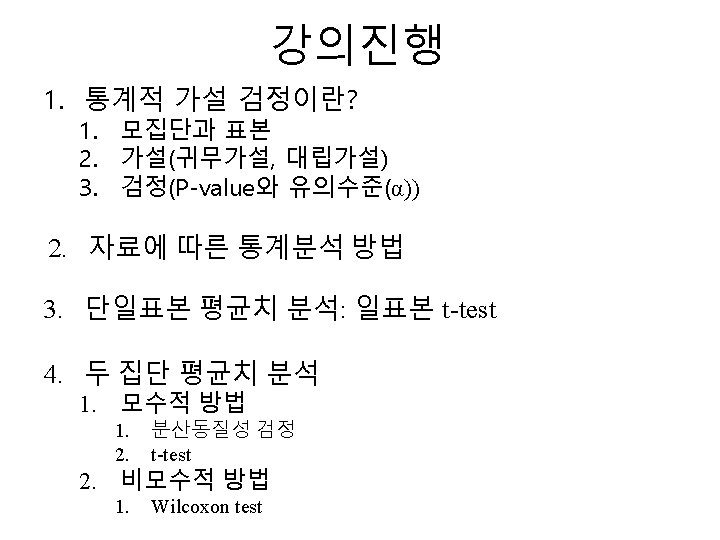
2. 자료에 따른 통계분석 방법(p. 15) 알고 싶은 내용 모수적 방법 (정규성) 비모수적 방법 (정규성아님) 독립된 두 집단의 평균 비교 t-test Wilcoxon test 짝지은 두 집단의 평균 비교 Paired t-test Paired-samples Wilcoxon test 세 집단 이상 평균 비교 ANOVA (Analysis of Variance) Kruskal-Wallis test 반복 측정된 세 집단 이상의 평균 비교 Repeated measured ANOVA Friedman rank-sum test 두 변수간의 상관관계 Pearson’s correlation Spearman’s correlation Kendall’s tau 독립(설명)변수와 연속형 종 회귀분석 (Linear 속(반응)변수와의 관계 regression analysis) 독립(설명)변수와 이분형 종 로지스틱 회귀분석 (Logistic regression analysis) 속(반응)변수와의 관계 두 집단 이상의 frequency 비교 시간에 따른 event 발생 위 험도 산출 Chi-square test (χ2 test) Fisher’s exact test 생명표(life table), Kaplan-Meier Weibull model, exponential model, Gaussian model, logistic model, lognormal model, log-logistic model Cox proportional hazard model
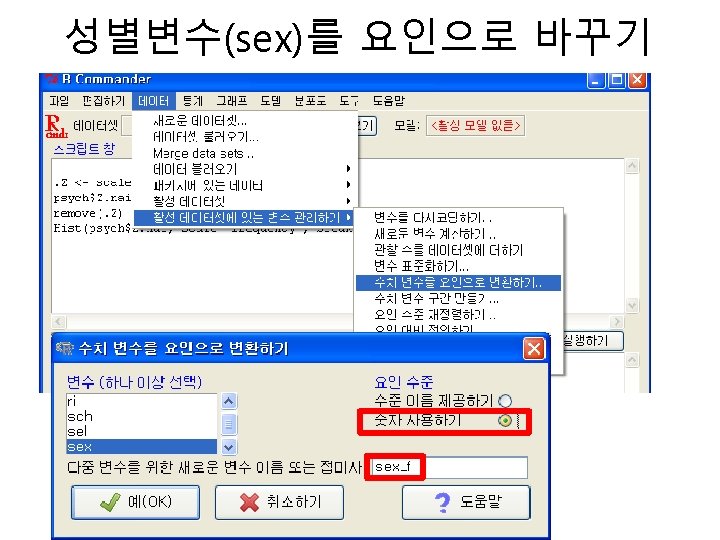
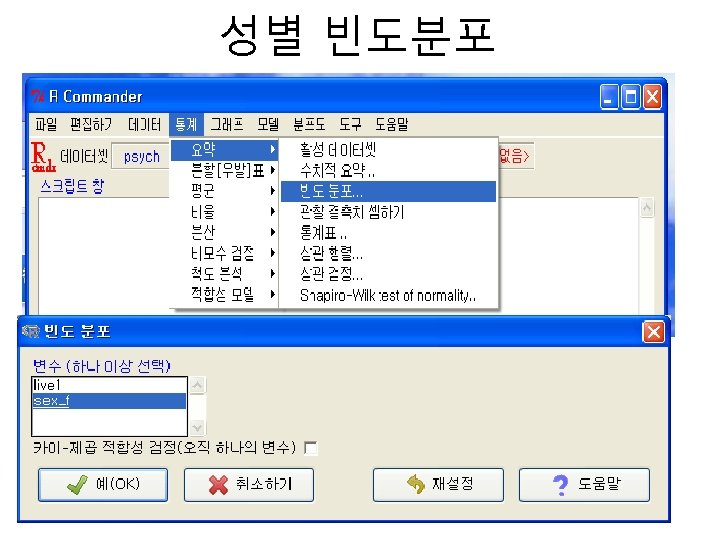
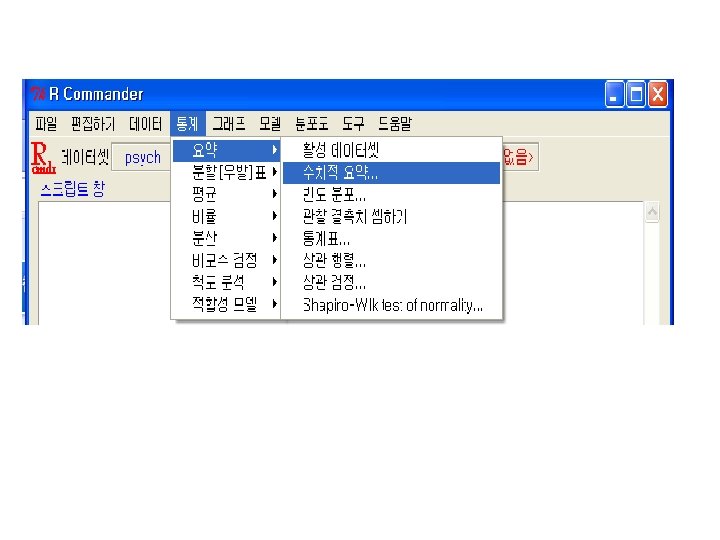
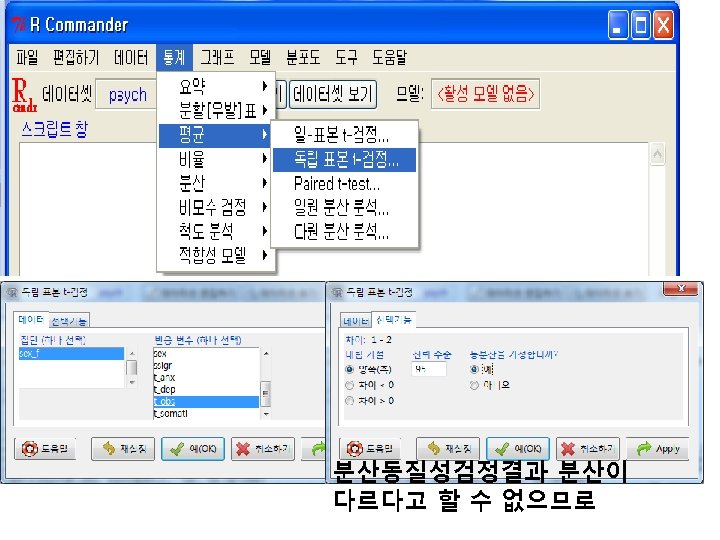
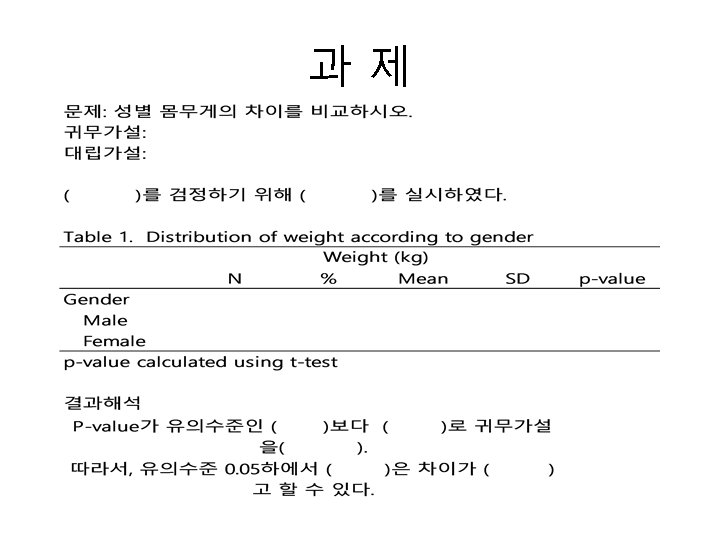
표 틀 만들고 채우기 Table 1. Distribution of standardized score of obsessive compulsive symptom according to gender Standardized score of obsessive compulsive symptom Mean SD N % All Gender Male Female p-value p-value calculated using t-test 빈도 분포 수치적 요약 반드시 먼저 성별변수(sex)를 요인으로 만든 후
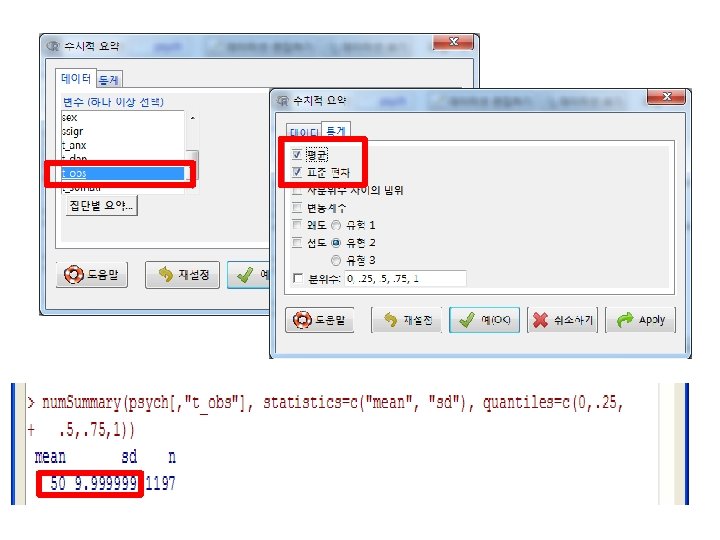
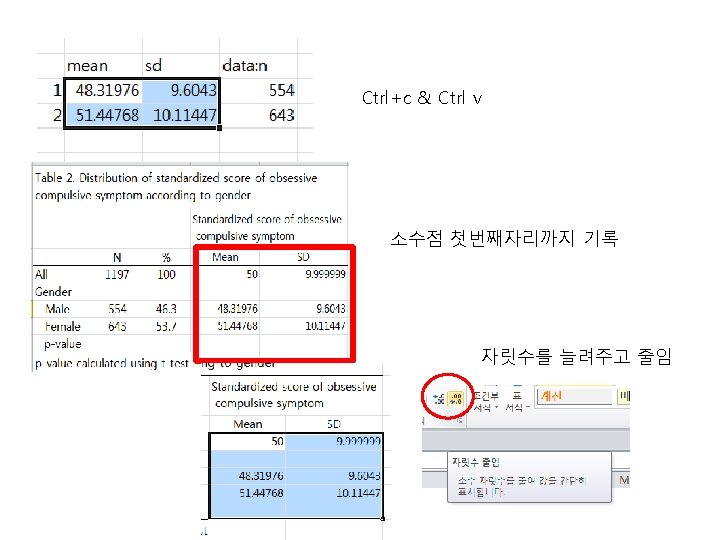
Table 2. Distribution of standardized score of obsessive compulsive symptom according to gender N All 1197 Gender Male 554 Female 643 p-value calculated using t-test Standardized score of obsessive compulsive symptom Mean SD % 100 46. 3 53. 7 수치적요약
Table 2. Distribution of standardized score of obsessive compulsive symptom according to gender N All 1197 Gender Male 554 Female 643 p-value calculated using t-test Standardized score of obsessive compulsive symptom Mean SD % 100 46. 3 53. 7 선만들기 셀들을 병합하고 싶을 때
Table 2. Distribution of standardized score of obsessive compulsive symptom according to gender N All 1197 Gender Male 554 Female 643 p-value calculated using t-test Standardized score of obsessive compulsive symptom Mean SD % 100 46. 3 53. 7
Table 2. Distribution of standardized score of obsessive compulsive symptom according to gender N All 1197 Gender Male 554 Female 643 p-value calculated using t-test Standardized score of obsessive compulsive symptom Mean SD % 100 46. 3 53. 7
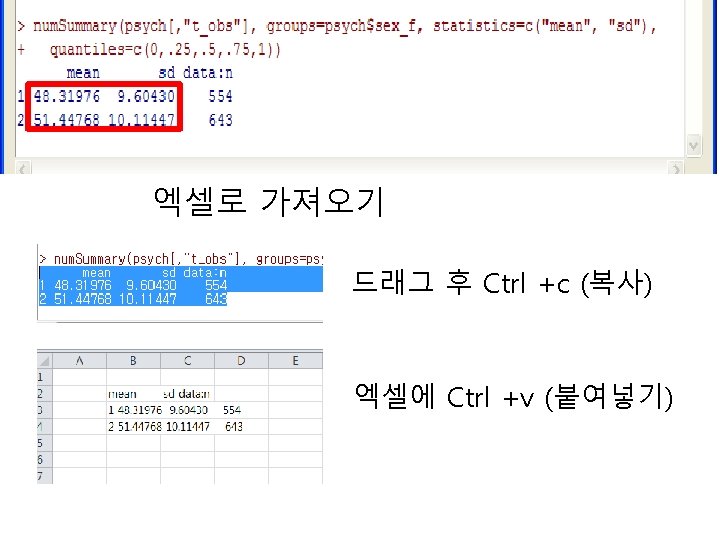
Table 2. Distribution of standardized score of obsessive compulsive symptom according to gender Standardized score of obsessive compulsive symptom N % Mean SD All 1197 50. 0 10. 0 Gender Male 554 48. 3 9. 6 Female 643 51. 4 10. 1 p-value p-value calculated using t-test
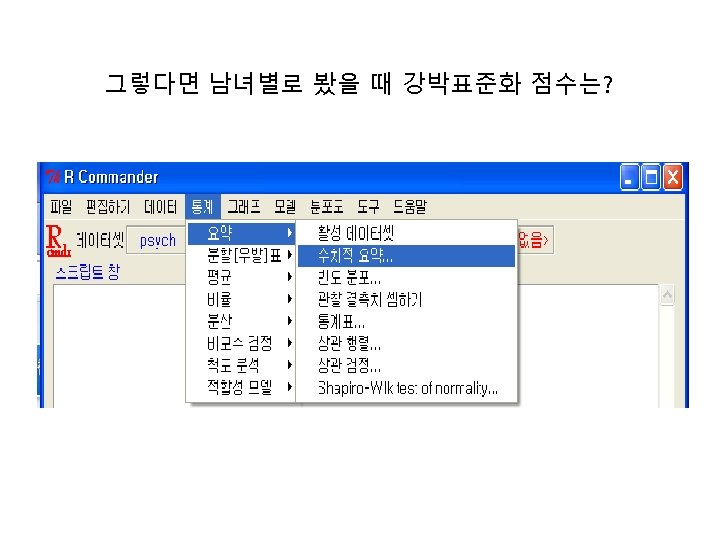
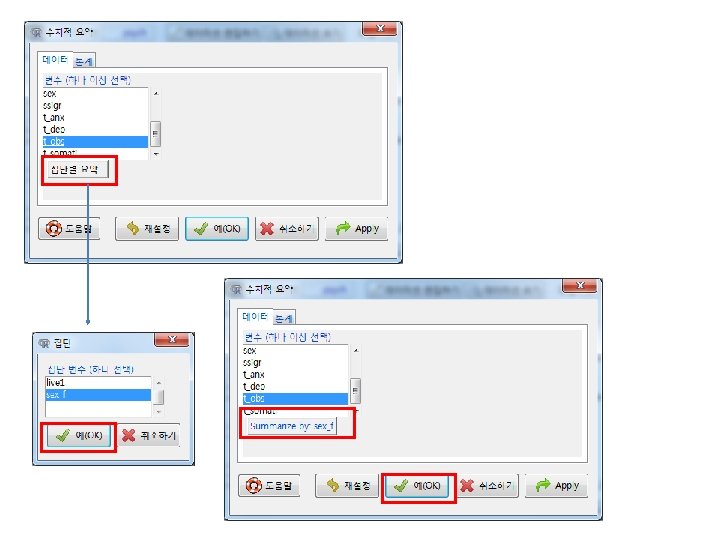
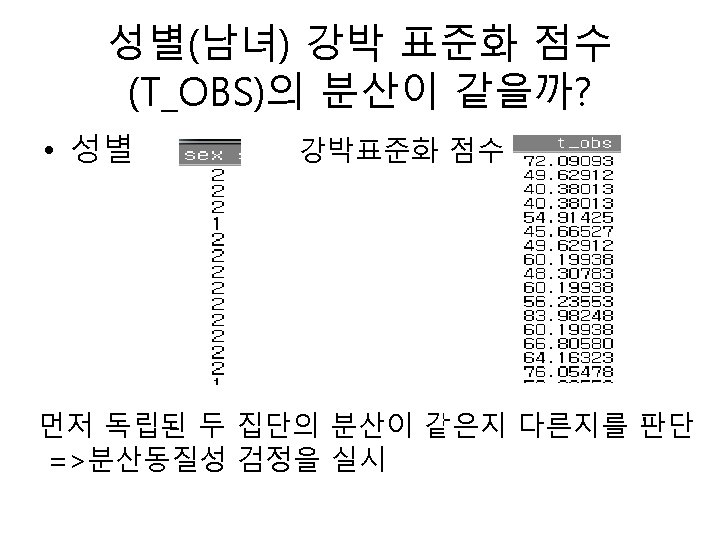
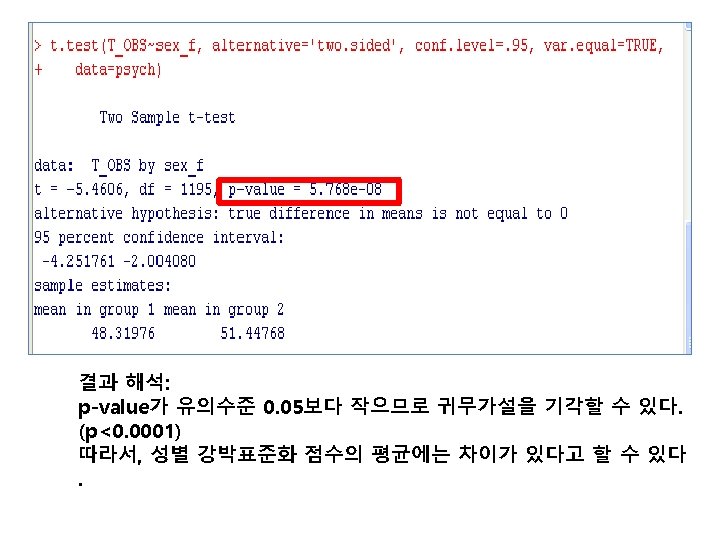
Table 2. Distribution of standardized score of obsessive compulsive symptom according to gender Standardized score of obsessive compulsive symptom N % Mean SD All 1197 50. 0 10. 0 Gender Male 554 48. 3 9. 6 Female 643 51. 4 10. 1 p-value p-value calculated using t-test 성별 t_obs 평균에 차이가 있는지 P- value 구하기~!!!
Table 2. Distribution of standardized score of obsessive compulsive symptom according to gender N All 1197 Gender Male 554 Female 643 p-value p-value calculated using t-test % 100. 0 46. 3 53. 7 Standardized score of obsessive compulsive symptom Mean SD 50. 0 10. 0 <0. 0001 48. 3 51. 4 9. 6 10. 1