2 nd regional mariculture conferenceJeju island Nutrient budget

2 nd regional mariculture conference-Jeju island Nutrient budget in marine fish cage culture system and Integrated Multitrophic Aquaculture scheme Jiang zengjie, Fang jianguang, Zhang jihong Yellow Sea Fisheries Research Institute, CAFS 2009. 06. 16

Outline Part I. Introduction of marine cage culture and IMTA Part II. A case study Part III. Discussion

Part I. General Introduction

Marine cage culture • Almost half of the food fish supplies in the world are now from aquaculture • Marine fish cage farming has proved to be a quite promising productive sector of industrial economy and has already been became the main fish culture method in coastal zone

Impacts • One of the criticisms of intensive cage is environmental impacts from the nutrient load…that is “fish pooh and pee”

The thing about nutrient… • When present in excess Becomes a pollutant • Appropriate concentrations Essential for life

What can we do to minimize nutrient loading impacts? • Ensure nutrient loading stays within the assimilative capacity of the localized ecosystem • Recover some of the ‘lost nutrients’ in harvestable biomass
 from one species are recycled to become inputs (fertilizers,")
IMTA • The by-products (wastes) from one species are recycled to become inputs (fertilizers, food) for another • Fed aquaculture (e. g. fish) is combined with inorganic extractive (e. g. seaweed) and organic extractive (e. g. shellfish) aquaculture

The overall IMTA model: Schematic overview

First… • The nutritional mass-balance model in cage culture system

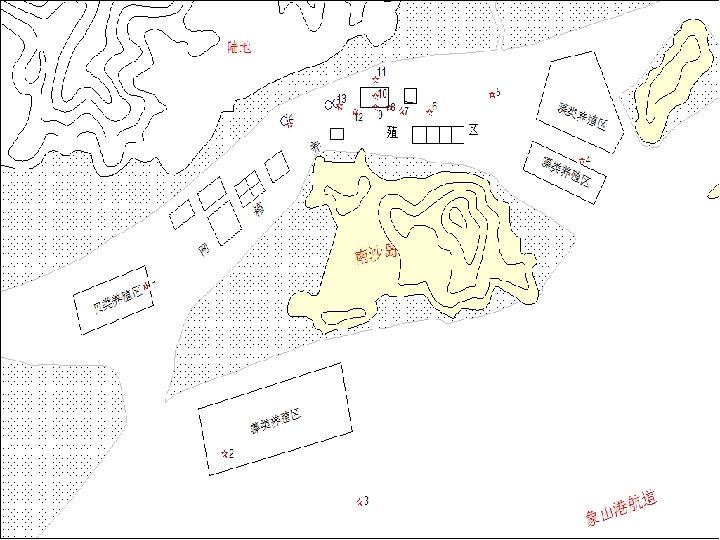
Part II. A case study

• Total 4000 polyethylene fish cages in use with dimensions 3 m× 6 m • Sea bass Lateolabrax Ljaponicus and large yellow croaker Pseudosciaena crocea were the main culture species

Nutrient Mass Balance • Feed+ Fry+ Hydrodynamic input + Release from sediment = Harvest of adult fish + Sedimention + Hydrodynamic output + Others

Amount and Composition of Feed Moisture Protein Lipid Carbohydrate Nitrogen Phosphorus 蓝圆鲹 Decapterus maruadsi 70. 50 19. 80 5. 26 2. 01 3. 17 0. 32 日本金线鱼 Nemipterus japonicus 63. 08 17. 72 13. 73 3. 22 2. 84 0. 41 黄斑篮子鱼 Siganus oramin 69. 97 18. 91 7. 63 2. 31 3. 03 0. 56 中华青鳞鱼 Harengula Zundsi 71. 10 18. 60 5. 20 1. 17 2. 98 0. 17 Average 68. 66 18. 76 7. 96 2. 18 3. 01 0. 37

Amount and Composition of Fry Moisture Protein Lipid Carbohydrate Nitrogen Phosphorus 鲈鱼 Lateolabrax japonicus 70. 14 18. 12 14. 89 0. 00 2. 90 0. 19 大黄鱼 Pseudosciae na crocea 71. 24 17. 25 10. 95 0. 67 2. 76 0. 13 美国红鱼 Lutjanus sanguineus 70. 23 16. 68 4. 03 2. 02 2. 67 0. 21 Average 70. 54 17. 35 9. 96 0. 90 2. 78 0. 18

Amount and Composition of adult fish Moisture Protein Lipid Carbohydrate Nitrogen Phosphorus 鲈鱼 Lateolabrax japonicus 76. 5 18. 6 3. 4 0 2. 98 0. 24 大黄鱼 Pseudosciae na crocea 77. 7 17. 7 2. 5 0. 8 2. 83 0. 17 美国红鱼 Lutjanus sanguineus 76. 6 17. 12 0. 92 2. 4 2. 74 0. 27 Average 76. 93 17. 81 2. 27 1. 07 2. 85 0. 23
 1#(mg/L) DIN PO 4 2007 -01 1. 288 0.")
Hydrodynamic input and output 5#(mg/L) 1#(mg/L) DIN PO 4 2007 -01 1. 288 0. 0781 0. 914 0. 0922 2007 -04 0. 955 0. 045 1. 159 0. 049 2007 -07 0. 668 0. 044 0. 659 0. 058 2007 -11 0. 960 0. 071 1. 192 0. 071 5 1

Sedimention flux • TPM: 34. 92 g/m 2. h • POM: 2. 49 g/m 2. h

Diffusion flux--Fick first law NO 2 --N NO 3 --N NH 4+-N DIN PO 4 -P 2007 -01 7. 79 314. 29 252. 55 574. 63 57. 71 2007 -04 21. 50 520. 63 505. 59 1047. 72 36. 91 2007 -07 -1. 11 5123. 88 1224. 32 6347. 09 34. 76 2007 -11 3. 88 -313. 10 486. 06 176. 85 37. 39 Annual average 8. 02 1411. 43 617. 13 2036. 57 41. 69 mol∙m-2∙d-1

Feed 84. 30% Fry 0. 49% Adult fish 15. 96% Only about 18%? FCR: 5. 16 Hydrodynamic output 19. 75% Hydrodynamic input 11. 60% Others 31. 30% Release 3. 61% Sedimentation 32. 98% Fig. 1 Nitrogen budget in marine fish cage culture system

Feed 91. 39% Fry 0. 28% Adult fish 11. 36% Only about 12%? Hydrodynamic output 8. 56% Hydrodynamic input 6. 89% Others 27. 76% Release 1. 44% Sedimentation 52. 32% Fig. 2 Phosphorus budget in marine fish cage culture system

IMTA? • Cage area: 618800 m 2 • Laminaria/Gracilaria area: 747073. 4 m 2 • Ostrea plicatula: 51390 m 2
 Time 2007 -01 Area NO")
0. 65 Nutrient content in water column (µmol/L ) Time 2007 -01 Area NO 2 -N NO 3 -N NH 4 -N PO 4 -P N/P Cage 0. 89 65. 43 3. 23 2. 43 28. 62 Shellfish 1. 00 56. 43 7. 86 2. 97 21. 98 Macroalgae 0. 86 62. 86 2. 93 2. 34 28. 48 Control 0. 86 55. 00 2. 52 23. 16 0. 90 59. 93 4. 13 2. 57 25. 56 Cage 0. 99 68. 71 2. 54 1. 51 47. 84 Shellfish 1. 21 78. 57 3. 00 1. 58 52. 39 Macroalgae 1. 07 81. 07 2. 29 1. 47 57. 44 Control 1. 21 71. 43 1. 00 1. 48 49. 76 1. 12 74. 95 2. 21 1. 51 51. 86 Cage 3. 29 40. 93 1. 43 1. 57 29. 08 Shellfish 4. 07 40. 71 2. 29 1. 87 25. 17 Macroalgae 3. 07 33. 93 0. 86 1. 52 24. 91 Control 4. 86 46. 43 0. 59 1. 94 26. 74 3. 82 40. 50 1. 29 1. 73 26. 48 Cage 0. 48 63 3. 19 2. 64 25. 25 Shellfish 0. 37 82. 86 1. 93 2. 29 37. 19 Macroalgae 0. 38 47. 5 1. 93 2. 32 21. 47 Control 0. 26 67. 86 1 2. 52 27. 42 0. 37 65. 31 2. 01 2. 44 27. 83 Average 2007 -04 Average 2007 -07 Average 2007 -11 16: 1 Average
×DIP(mg/L)× 106/4500 • E value much higher than 1 • Heavy eutrophication")
• E=COD×DIN(mg/L)×DIP(mg/L)× 106/4500 • E value much higher than 1 • Heavy eutrophication What’s wrong?

Sulfide content in sediment

Hypothetical IMTA Scheme • What is the optimal ratio?

Nutrient flow chart
 Nitrogen(39 kg)")
Calculation of nitrogen balance One 3 m× 6 m Cage Feed(1300 kg) Nitrogen(39 kg) Particulates (15. 3 kg) Ostrea plicatula (130 kg) Dissolved (16. 4 kg) Assimilation by fishes (7. 3 kg) Laminaria/Gracilaria (610 kg)/ (304 kg) Fish-Oyster-Seaweed (wet weight) 1 kg : 6. 8 kg : 2. 43 kg/ 1. 21 kg

Part III. Discussion • IMTA is not combined different species together simply • Spatial arrangement • Optimal ratio

Thanks for your attention
- Slides: 31