2 Chi Square Test X Chi Square is


(n-1) •")


")


2 = 1. 36 2731 (3591 –")


- Slides: 29
2 Chi Square Test X
• Chi Square is a test used to see if two pieces of data are significantly different or due to chance • In Biology, we use this test a lot to see if our data is significant. In a population lab, we would see if 2 species found are associated with each other
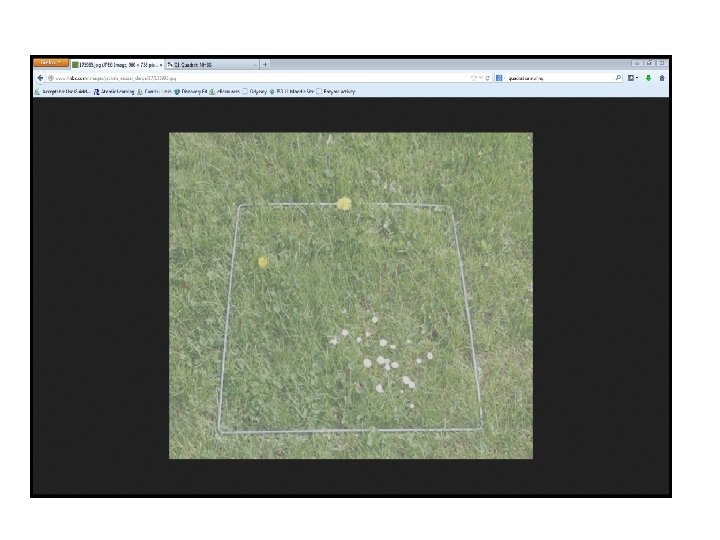
Quadrant Sampling • This method is only suitable for plants and other organisms that are not motile. Choose a random number to determine the length and width of your area If the absence or presence of more than one species is recorded in every quadrat during sampling of a habitat, it is possible to test for an association between species.
• A quadrat is a wire shaped into a square of a known size , such as 10 x 10 meters or 100 m 2. • If you want to know the population size of two plant species, take random samples of this area by throwing down the quadrat and recording the population numbers in each subunit of the quadrat.
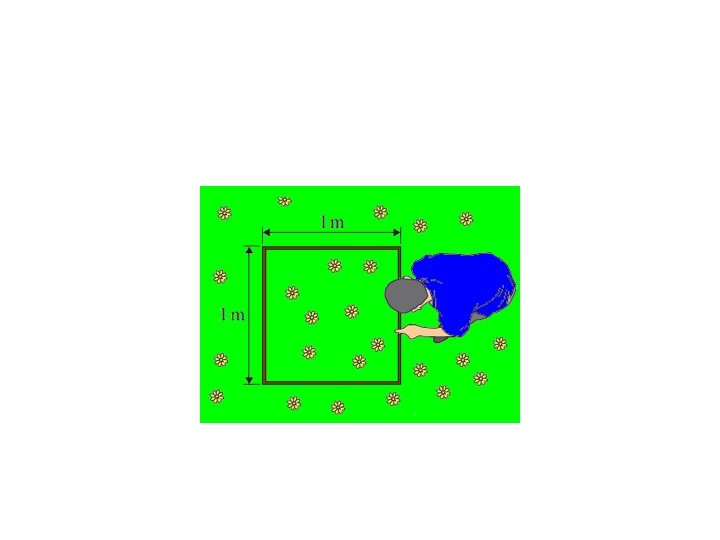
Setting up quadrats • Setting up quadrats This is a grid of 100 quadrats, each 10 m on a side. http: //www. csulb. edu/~rodrigue/geog 20 0/lab 4. html; Dr. Rodrigue http: //home. iae. nl/users/isse/Files/environmental_systems. htm; Environmental Systems
3. Count how many individuals there are inside the quadrat of the plant population being studied. Repeat steps 2 and 3 as many times as possible. 4. Measure the total size of the area occupied by the population, in square meters. http: //www. waite. adelaide. edu. au/school/Habitat/survey. html; Survey of native and exotic species
5. Calculate the mean number of plants per quadrat. Then calculate the estimated population size using the following equation: Population size = mean number per quadrat X total area of each quadrat
• Populations are often unevenly distributed because some parts of the habitat are more suitable for a species than others. • If two species occur in the same parts of a habitat, they will tend to be found in the same quadrats. • This is known as a Positive association
• There are 2 hypotheses: • H 0 -Two species are distributed independently – The Null Hypothesis H 1 – Two species are associated (either positively so they tend to occur together or negatively so they tend to occur apart) We can test these hypotheses using a statistical procedure – the chi square test
Method for Chi Square • Draw up a contingency table of observed frequencies. Species A present Species B absent Column totals Species A absent Row totals
• Calculate the row and column totals. • Adding the row and column totals should give the same grand total in the lower right cell.
• Calculate the expected frequencies, assuming the independent distribution for each of the four species combinations. • Each expected frequency is calculated from values on the contingency table using this equation. – Expected frequency = row total x column total • grand total
• Calculate the degree’s of freedom using this equation: DF = (m-1)(n-1) • Where m and n are the number of rows and columns in the contingency table
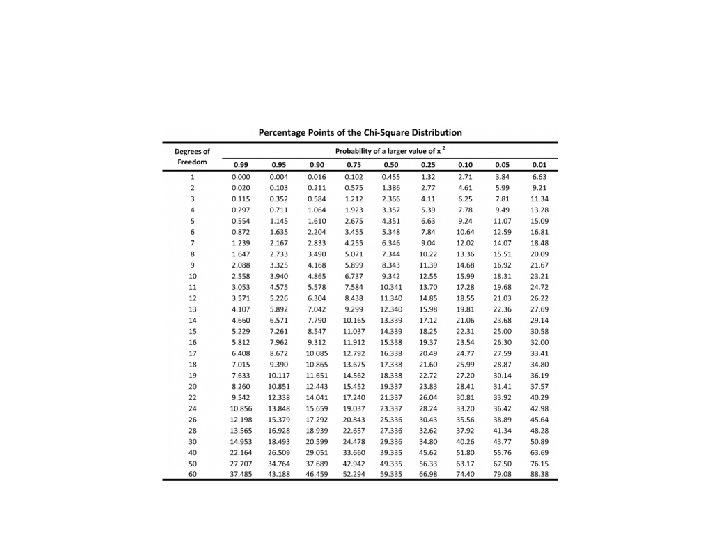
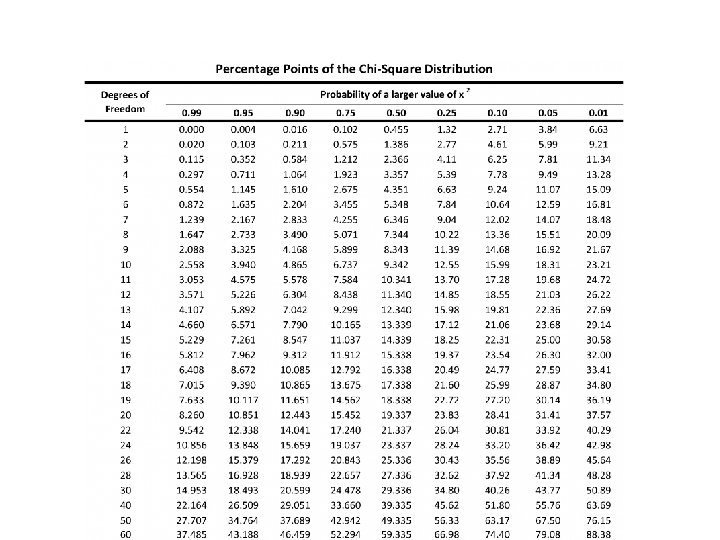
• Find the critical region for chi-squared from a table of chi-square values, using the degrees of freedom that you calculated. It should have a significance level (p) of 0. 05 (5%)
• What is statistically significant • H 0 - the null hypothesis with the belief that there is no relationship between the two • H 1 – There is a relationship • The usual procedure is to test the null hypothesis with the expectation of showing that it is false. • If you say that the results were statistically significant, it means that if the null hypothesis was true, the probability of getting results as extreme as the oberved results would be very small.
example • In a certain town, there about one million eligible voters. A simple random sample of 10, 000 eligible voters were chosen to study the relationship between sex and participation in the last election. The results are summarized in the following 2 x 2 contingency table: Men Women Voted 2792 3591 Didn’t vote 1486 2131
• We want to check whether being a man or a woman (columns) is independent of having voted in the last election (rows). In other words is ‘sex and voting independent’? • Null – sex is independent of voting • Alternative – sex and voting are dependent
• We now need to complete our contingency table. Men Women Total voted 2792 3591 6383 Didn’t vote 1486 5722 3617 Total 4278 5722 10000
Expected Table Men Women Total Voted 2731 3652 6383 Didn’t vote 1547 2070 3617 Totals 4278 5722 10000 Remember: expected frequencies = row totals x column totals grand total So: 6383 x 4278 / 10000 = 2731 6383 x 5722 / 10000 = 3652
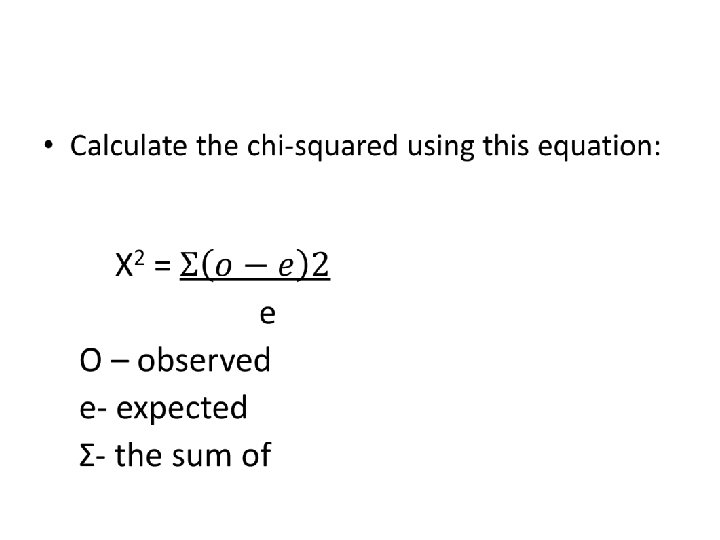
• Now we have the observed table and the expected table under the null hypothesis of independence. Now we need to compute X 2 • (O – e)2 e
• So…. . • (2792 – 2731)2 = 1. 36 2731 (3591 – 3652)2 = 1. 0 3652 Etc. X 2 = 1. 4+1. 0+2. 4+1. 8 = 6. 6 Degrees of freedom 2 – 1 = 1
• Since X 2 is 6. 6 which has a p value of 1%, we have to reject the NULL hypothesis. The data supports the hypothesis that sex and voting are dependent in this town.
http: //www. youtube. com/watch? v=WXPBo. FDq. NVk&safety_mode=true&persist_safety _mode=1