2 6 Rational Functions and their Graphs Objective

2. 6 Rational Functions and their Graphs Objective: Identify vertical and horizontal asymptotes. Graphing rational functions.

Lets review by finding the domain of these Rational Functions: The domain of f consists of all real numbers except 5. Domain of f(x) = Factor the denominator The domain of g consists of all real numbers except – 5 or 5. No real numbers cause the denominator of h(x) to equal 0. The domain of h consists of all real numbers.
 and b(x) are polynomial functions and The")
Rational Functions of the form where a(x) and b(x) are polynomial functions and The domain of a rational function is the set of all real numbers except the x-values that make the denominator zero.

Lets review by finding the Vertical Asymptotes & Holes of these Rational Functions: What is an asymptote? An asymptote is a line that the graph of a function approaches. The graph continues to approach the asymptote as the input increases and/or decreases without bound. Once a rational function is reduced, vertical asymptotes may be found by setting the denominator equal to zero (0) and solving Vertical Asymptotes: These vertical lines are written in the form: x = k, where k is a constant.

Factor the denominator Your Turn set it to zero Vertical Asymptote The lines x = – 1 and x = 1 are the vertical asymptotes for the graph of f.

IMPORTANT NOTE ON HOLES: In order to find asymptotes, functions must FIRST be reduced. Factor both the numerator and denominator to see if they have any factors in common that can be “cancelled” out. Any factor that “cancels” produces a hole in the graph. A hole exists at a value of x if that value makes both the numerator and denominator equal to zero (0). Find the vertical asymptote and any holes There is a hole at x = 0 Vertical Asymptote is at x = 2

Arrow Notation We use arrow notation to describe the behavior of some functions.

Let’s read some graphs

For each function, identify the, limit behavior at all vertical asymptotes,

Finding the Horizontal Asymptote:

Find the horizontal asymptote for

Find the horizontal asymptote for

Find the horizontal asymptote for

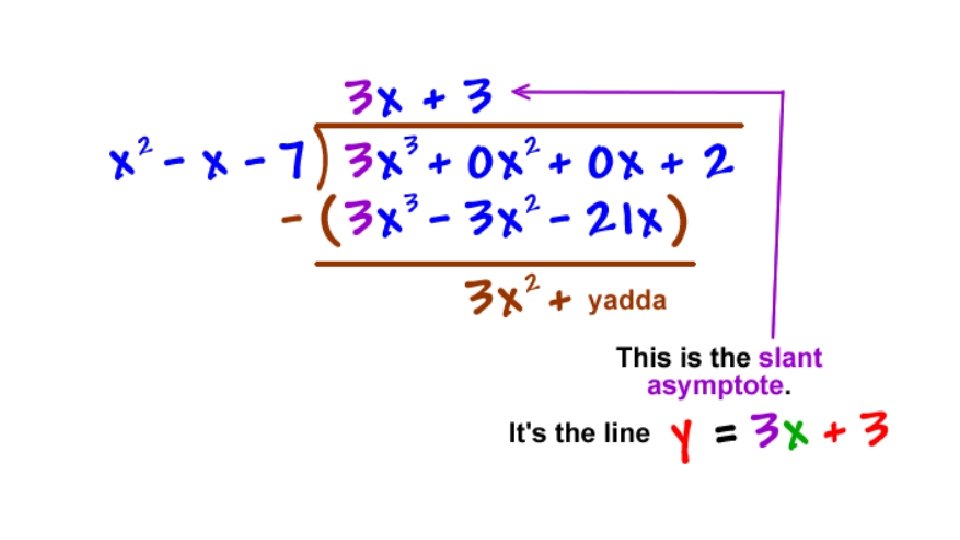
Find the horizontal asymptote for look at start in with some long division. . . and we get to ignore the remainder!

Your Turn
 if possible, by factoring")
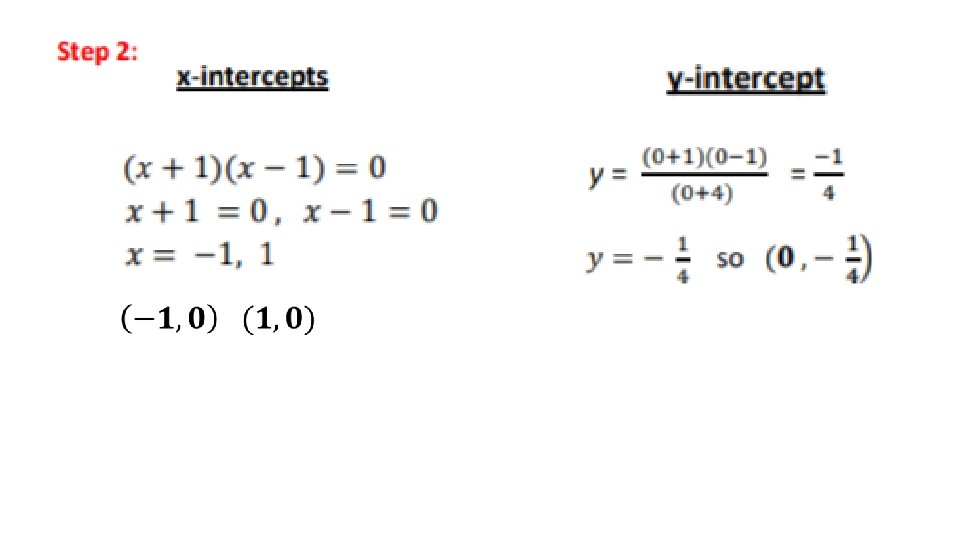
STEPS FOR GRAPHING RATIONAL FUNCTIONS 1. Simplify �� (�� ) if possible, by factoring the numerator �� (�� ) and denominator �� (�� ). From the factorization, A) Identify the Domain of the function. B) Note any resulting “Hole(s)”. 2. Find and plot the x-intercepts and y-intercept of the function (if they exist). A) x-intercept(s) B) y-intercept Set �� (�� ) = 0 and solve. Evaluate �� (0) if it exists.
. 4. Find and plot")
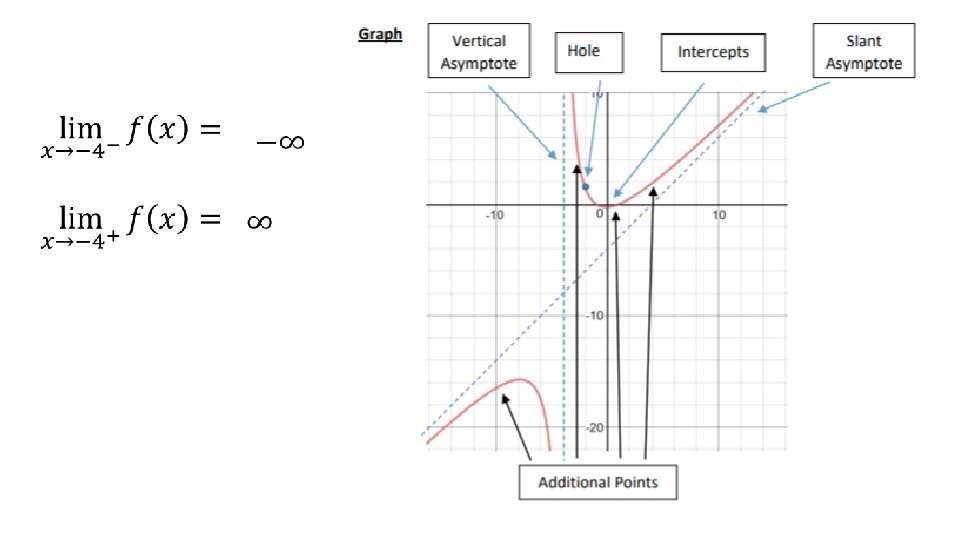
3. Find and sketch any Asymptotes (Horizontal, Vertical, or Slant). 4. Find and plot additional points if needed. Note – there should be at least one point in between and one point beyond each x-intercept and vertical asymptote. Constructing a Sign Chart and finding Origin / Y-axis Symmetry can also be used to aid in this step.

5. See if the graph passes through any of the nonvertical asymptotes. Set the rational function equal to the horizontal or oblique/slant asymptote If there are no solutions, then it does not cross the non-vertical asymptote

Now putting it altogether: Graph

Limit behavior at vertical asymptotes

Now putting it altogether: Graph Find y coordinate of “Hole”

There is no Horizontal but a slant asymptote

Graph State the domain and range. Find the vertical and horizontal asymptotes VA: HA: Plot at least two points to the left and right of x = 2 x 0 1 3 4 y Domain: Range:
 Find the vertical asymptotes. 2) Find the horizontal asymptote.")
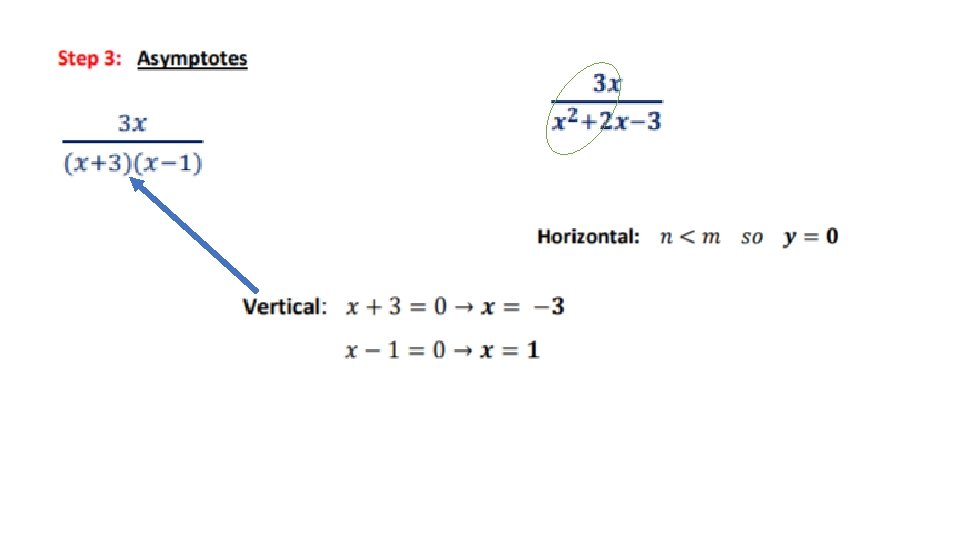
Graph 1) Find the vertical asymptotes. 2) Find the horizontal asymptote.
 Plot Points. x -4 -3 -1 0 1 3 4 y")
Graph 3) Plot Points. x -4 -3 -1 0 1 3 4 y
 Find the vertical asymptotes. 2) Find the horizontal asymptote. No horizontal asymptote.")
Graph 1) Find the vertical asymptotes. 2) Find the horizontal asymptote. No horizontal asymptote. 3) Find the slate asymptote. Slant asymptote is y=x -1
 Plot Points. x -3 -2 -1. 5 -. 5 0 1 2")
Graph 3) Plot Points. x -3 -2 -1. 5 -. 5 0 1 2 y
- Slides: 31