2 4 Numerical Summaries of Data Numerical and


 38, 59, 60, 62, 63, 64, 65, 67, 68, 70,")


 construct box with ends located at Q 1 and Q 3;")
 3) whiskers: draw lines from the ends of the")

 Q 1 = 63, Q 3 = 78 n")


- Slides: 42
2. 4 Numerical Summaries of Data Numerical and More Graphical Methods to Describe Univariate Data
2 characteristics of a data set to measure center measures where the “middle” of the data is located n variability measures how “spread out” the data is n
The median: a measure of center Given a set of n measurements arranged in order of magnitude, Median= middle value n odd mean of 2 middle values, n even n Ex. 2, 4, 6, 8, 10; n=5; median=6 n Ex. 2, 4, 6, 8; n=4; median=(4+6)/2=5
Student Pulse Rates (n=62) 38, 59, 60, 62, 63, 64, 65, 67, 68, 70, 70, 71, 72, 73, 74, 75, 75, 76, 77, 77, 78, 79, 80, 80, 84, 85, 87, 90, 91, 92, 93, 94, 95, 96, 96, 98, 103 Median = (75+76)/2 = 75. 5
Medians are used often Year 2019 baseball salaries Median $1, 400, 000 (max=$42, 000 Max Sherzer; min=$555, 000) n Median age of TV sports viewers: PGA 64, NASCAR 58, MLB 57, WTA 55, NFL 50; NHL 49, NBA 42, MLS 40 n Median existing home sales price: Nov. 2019 $271, 300; Nov. 2018 $257, 400 n US Median household income (2018 dollars) 2018 $63, 179; 2017 $61, 136 n NC Median household income (2018 dollars) 2018 $53, 369; 2017 $50, 755 n
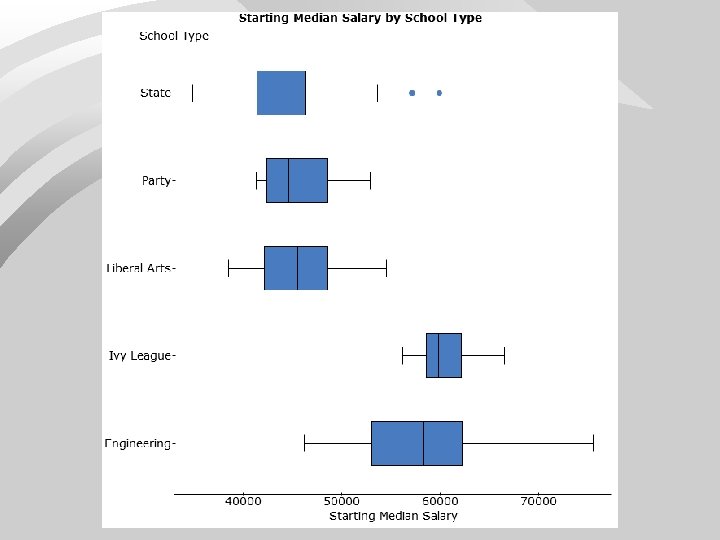
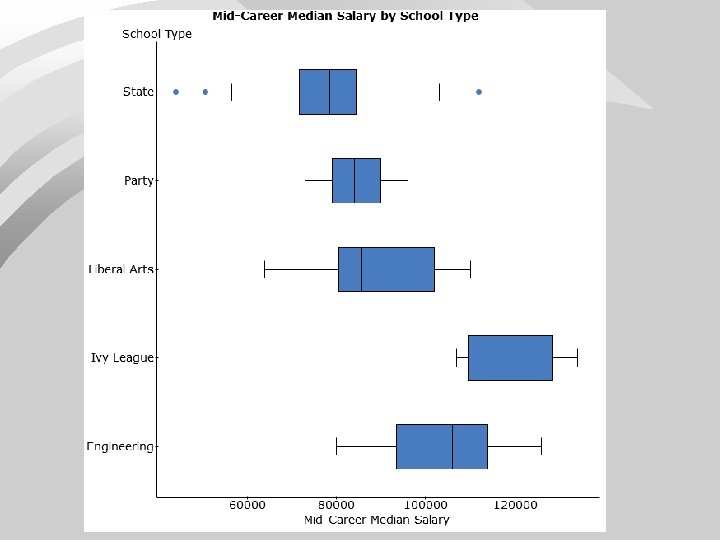
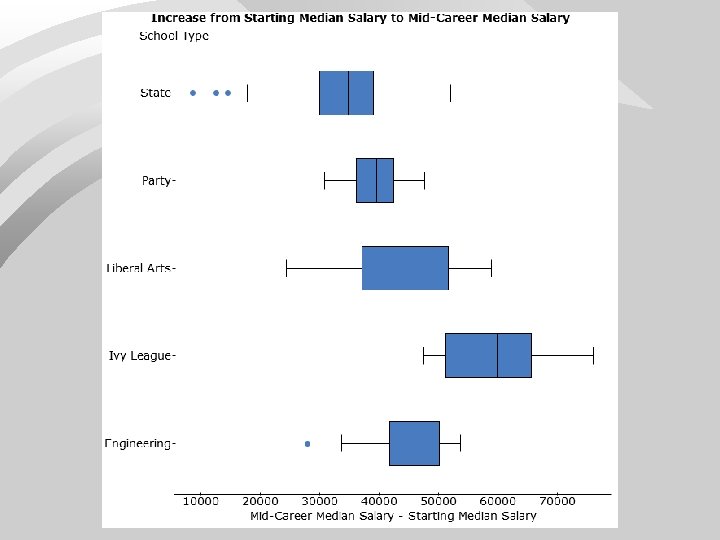
Median Salaries by Major
The median splits the histogram into 2 halves of equal area
The median splits the histogram into 2 halves of equal area Median $25, 966 NC $24, 358
Examples Example: n = 7 17. 5 2. 8 3. 2 13. 9 14. 1 25. 3 45. 8 n Example n = 7 (ordered): m = 14. 1 n 2. 8 3. 2 13. 9 14. 1 17. 5 25. 3 45. 8 n Example: n = 8 17. 5 2. 8 3. 2 13. 9 14. 1 25. 3 35. 7 45. 8 n m = (14. 1+17. 5)/2 = 15. 8 Example n =8 (ordered) 2. 8 3. 2 13. 9 14. 1 17. 5 25. 3 35. 7 45. 8 n
Think about the median n Six people in a room have a median age of 45 years. One person who is 40 years old leaves the room. Question: What is the median age of the 5 people remaining in the room? 10
Below are the annual tuition charges at 7 public universities. What is the median tuition? 4429 4960 4971 5245 5546 7586 1. 2. 3. 4. 524 5 4965. 5 4960 4971
Below are the annual tuition charges at 7 public universities. What is the median tuition? 4429 4960 5245 5546 4971 5587 7586 1. 2. 3. 4. 524 5 4965. 5 5546 4971
Measures of Spread n The range and interquartile range
Ways to measure spread range=largest-smallest § OK sometimes; in general, too crude; sensitive to one large or small data value § The range measures spread by examining the ends of the data § A better way to measure spread is to examine the middle portion of the data
Quartiles: Measuring spread by examining the middle The first quartile, Q 1, is the value in the sample that has 25% of the data at or Q 1= first quartile = 2. 3 below it (Q 1 is the median of the lower half of the sorted data). m = median = 3. 4 The third quartile, Q 3, is the value in the sample that has 75% of the data at or below it (Q 3 is the median of the upper half of the sorted data). Q 3= third quartile = 4. 2
Quartiles and median divide data into 4 pieces 1/4 Q 1 1/4 M 1/4 Q 3
The Economic Value of College Majors
Mid-career earnings by major: 25 th, 50 th, 75 th percentiles.
Quartiles are common measures of spread n https: //oirp. ncsu. edu/students/admission s/freshman-profile/ n University of Southern California
Rules for Calculating Quartiles Step 1: find the median of all the data (the median divides the data in half) Step 2 a: find the median of the lower half; this median is Q 1; Step 2 b: find the median of the upper half; this median is Q 3. Important: when n is odd include the overall median in both halves; when n is even do not include the overall median in either half.
11 n Example 2 4 6 8 10 12 14 16 18 20 n = 10 n. Median nm = (10+12)/2 = 22/2 = 11 n. Q 1 : n. Q 3 median of lower half 2 4 6 8 10 Q 1 = 6 : median of upper half 12 14 16 18 20 Q 3 = 16
Pulse Rates n = 138 Median: mean of pulses in locations 69 & 70: median= (70+70)/2=70 Q 1: median of lower half (lower half = 69 smallest pulses); Q 1 = pulse in ordered position 35; Q 1 = 63 Q 3 median of upper half (upper half = 69 largest pulses); Q 3= pulse in position 35 from the high end; Q 3=78
Below are the weights of 31 linemen on the NCSU football team. What is the value of the first quartile Q 1? 1. 2. 3. 4. 287 257. 5 263. 5 262. 5 # stem leaf 2 22 55 4 23 57 6 24 26 7 25 7 10 26 257 12 27 59 (4) 28 1567 15 29 35599 10 30 333 7 31 45 5 32 155 2 33 6 1 34 0
Interquartile range lower quartile Q 1 n middle quartile: median n upper quartile Q 3 n interquartile range (IQR) IQR = Q 3 – Q 1 measures spread of middle 50% of the data n
Example: beginning pulse rates n Q 3 = 78; Q 1 = 63 n IQR = 78 – 63 = 15
Below are the weights of 31 linemen on the NCSU football team. The first quartile Q 1 is 263. 5. What is the value of the IQR? 1. 2. 3. 4. 23. 5 39. 5 46 69. 5 # stem leaf 2 22 55 4 23 57 6 24 26 7 25 7 10 26 257 12 27 59 (4) 28 1567 15 29 35599 10 30 333 7 31 45 5 32 155 2 33 6 1 34 0
5 -number summary of data n Minimum Q 1 median Q 3 maximum n Pulse data 45 63 70 78 111
Boxplot: display of 5 -number summary Largest = max = 6. 1 BOXPLOT Q 3= third quartile = 4. 2 m = median = 3. 4 Q 1= first quartile = 2. 3 Smallest = min = 0. 6 Five-number summary: min Q 1 m Q 3 max
Boxplot: display of 5 -number summary n Example: age of 66 “crush” victims at rock concerts in a recent year. 5 -number summary: 13 17 19 22 47
Rock concert deaths: histogram and boxplot
Boxplot construction 1) construct box with ends located at Q 1 and Q 3; in the box mark the location of median (usually with a line or a “+”) 2) fences are determined by moving a distance 1. 5(IQR) from each end of the box; 2 a) upper fence is 1. 5*IQR above the upper quartile 2 b) lower fence is 1. 5*IQR below the lower quartile Note: the fences only help with constructing the boxplot; they do not appear in the final boxplot display
Box plot construction (cont. ) 3) whiskers: draw lines from the ends of the box left and right to the most extreme data values found within the fences; 4) outliers: special symbols represent each data value beyond the fences; 4 a) sometimes a different symbol is used for “far outliers” that are more than 3 IQRs from the quartiles
Boxplot: display of 5 -number summary Largest = max = 7. 9 8 BOXPLOT Q 3+1. 5*IQR= 4. 2+2. 85 = 7. 05 Q 3= third quartile = 4. 2 Interquartile range Q 3 – Q 1= 4. 2 − 2. 3 = 1. 9 Q 1= first quartile = 2. 3 1. 5 * IQR = 1. 5*1. 9=2. 85. Individual #25 has a value of 7. 9 years, so 7. 9 is an outlier. The line from the top end of the box is drawn to the biggest number in the data that is less than 7. 05
Beg. of class pulses (n=138) Q 1 = 63, Q 3 = 78 n IQR=78 63=15 n n 1. 5(IQR)=1. 5(15)=22. 5 n Q 1 - 1. 5(IQR): 63 – 22. 5=40. 5 n Q 3 + 1. 5(IQR): 78 + 22. 5=100. 5 45 63 70 78 100. 5
Below is a box plot of the yards gained in a recent season by the 136 NFL receivers who gained at least 50 yards. What is the approximate value of Q 3 ? 0 136 273 410 547 684 821 958 Pass Catching Yards by Receivers 1. 2. 3. 4. 45 0 750 215 545 1095 1232 1369
Careful! Boxplots Do NOT Show Gaps in the Data Boxplots are all the same, histograms differ. Do not rely solely on a boxplot for data exploration
Automating Boxplot Construction Excel “out of the box” does not draw boxplots. n Many add-ins are available on the internet that give Excel the capability to draw box plots. n SAS, JMP, Minitab, R, etc. all make boxplots (learning curve) n Statcrunch (http: //statcrunch. stat. ncsu. edu) makes box plots (no learning curve). n
ATM Withdrawals by Day, Month, Holidays
Tuition 4 -yr Colleges