2 2 Polynomial Functions OBJECTIVE GRAPH POLYNOMIAL FUNCTIONS

2. 2 – Polynomial Functions OBJECTIVE: GRAPH POLYNOMIAL FUNCTIONS & MODEL REAL-WORLD DATA WITH POLYNOMIAL FUNCTIONS.

Polynomial Graphs:
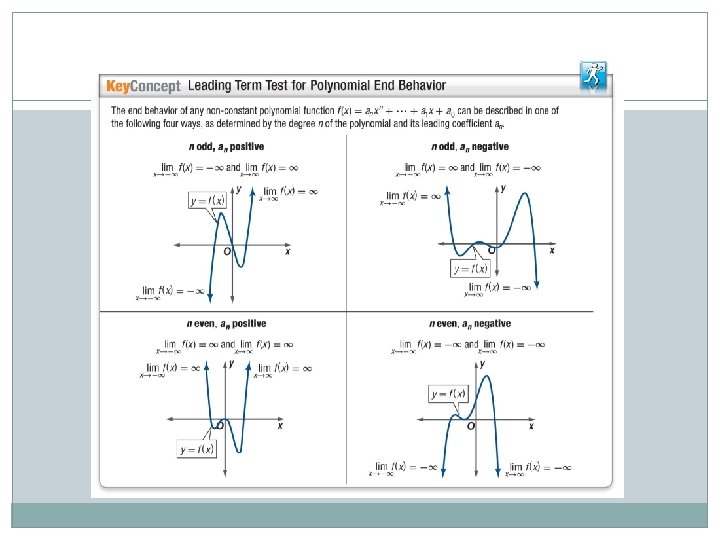

Example 2: Without a calculator, describe the end behavior of the graph using limits. Explain your reasoning using the leading term test. a. f (x) = 3 x 4 – x 3 + x 2 + x – 1 b. f (x) = – 3 x 2 – 2 x 5 – x 3

�Turning Points: where the graph of a function changes from increasing to decreasing and vice versa. �How are zeros related to turning points? ? ?
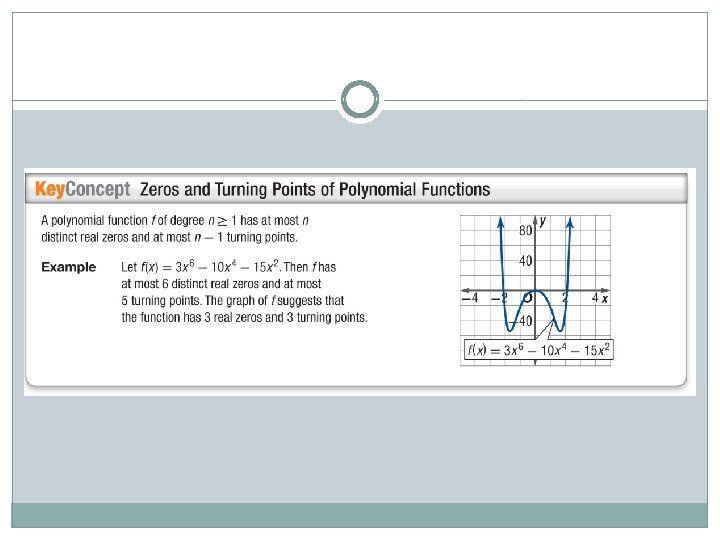

Example 3: State the number of possible real zeros and turning points of f (x) = x 3 + 5 x 2 + 4 x. Then determine all of the real zeros by factoring.

Example 4: State the number of possible real zeros and turning points. Then determine all of the real zeros by factoring. a. g (x) = x 5 – 5 x 3 – 6 x b. h (x) = x 4 + 5 x 3 + 6 x 2
 = x(3 x + 1)(x – 2) 2: A.")
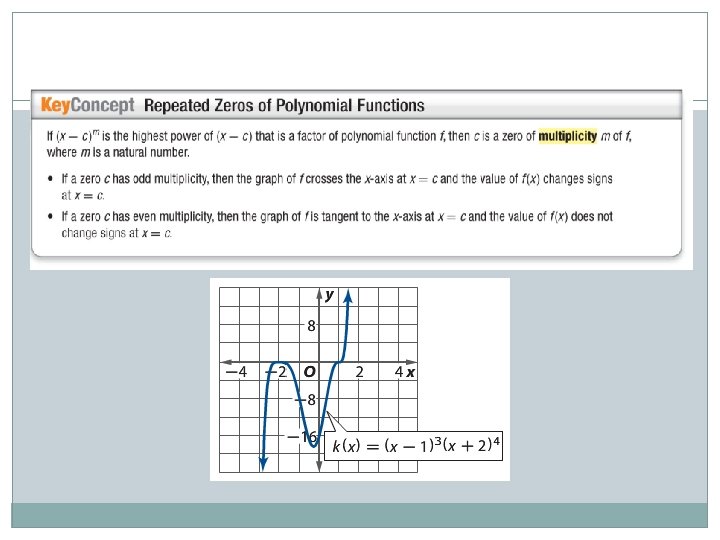
Example 5: For f (x) = x(3 x + 1)(x – 2) 2: A. Apply the leading-term test. B. Determine the zeros and state the multiplicity of any repeated zeros.
.")
Example 5: C. Sketch the graph (without a calculator).

Example 6: Determine the zeros and state the multiplicity of any repeated zeros for f (x) = 3 x(x + 2)2(2 x – 1)3. Then sketch the graph. A. 0, – 2 (multiplicity 2), B. 2 (multiplicity 2), – C. 4 (multiplicity 2), D. – 2 (multiplicity 2), (multiplicity 3)
- Slides: 12